

marchmeena29/iStock via Getty Images
DSTL Strategy And Portfolio
The Distillate Fundamental Stability & Value ETF (NYSEARCA:DSTL) has been tracking the Distillate U.S. Fundamental Stability & Value Index since October 2018. It has 100 holdings, a distribution rate of 1.10%, and an expense ratio of 0.39%.
As described in the prospectus by Distillate Funds, eligible companies must be in the 500 largest U.S.-listed companies in free-float market capitalization and have:
- at least 5 years of cash flow data,
- a net profit in at least one of the last three fiscal years,
- headquarters in the U.S. or Ireland,
- an average daily traded value of $ 50 million in the last 30 days.
Proprietary metrics are used to filter out companies with excessive debt, high volatility of cash flow, low free cash flow to enterprise value. The underlying index finally selects 100 companies. Constituents are weighted by two-thirds of equal weight plus one-third of a cash flow metric. The index is reconstituted quarterly. The turnover is quite high (73% of asset value in the last fiscal year).
DSTL current portfolio is exclusively in U.S. companies, 58% in the large cap segment, 40% in mid-caps and 2% in small caps (according to Fidelity size segments). The top 10 holdings, listed below with valuation ratios, represent 20% of asset value. The top position weights 2.8%, so the risk related to individual stocks is quite low.
|
Ticker |
Name |
Weight (%) |
P/E TTM |
P/E fwd |
P/Sales TTM |
P/Net Free CashFlow |
Yield% |
|
Johnson & Johnson |
2.80% |
24.77 |
17.91 |
5.17 |
N/A |
2.46 |
|
|
UnitedHealth Group Inc |
2.66% |
29.88 |
25.18 |
1.75 |
37.87 |
1.06 |
|
|
AbbVie Inc |
2.21% |
24.30 |
11.04 |
4.96 |
21.89 |
3.60 |
|
|
Home Depot Inc. |
2.03% |
20.31 |
19.58 |
2.17 |
46.82 |
2.41 |
|
|
Comcast Corp |
1.85% |
15.59 |
13.38 |
1.88 |
17.41 |
2.28 |
|
|
Alphabet Inc |
1.81% |
22.82 |
21.93 |
6.69 |
25.70 |
0.00 |
|
|
Meta Platforms Inc |
1.77% |
14.52 |
16.39 |
4.76 |
14.34 |
0.00 |
|
|
Broadcom Inc |
1.64% |
34.07 |
16.81 |
9.00 |
35.25 |
2.74 |
|
|
Cisco Systems Inc |
1.64% |
18.97 |
15.39 |
4.33 |
29.80 |
2.87 |
|
|
Philip Morris International Inc |
1.62% |
17.69 |
17.50 |
5.12 |
44.09 |
4.85 |
The top three sectors are healthcare (22.4%), technology (18.3%), and industrials (18.2%). Compared to the S&P 500 (SPY), the fund overweights healthcare, industrials, consumer staples and materials. It underweights technology, communication, financials, energy, real estate and ignores utilities. It results in a more balanced portfolio, especially in the top 3 sectors.
Sector weights (chart: author; data: Fidelity)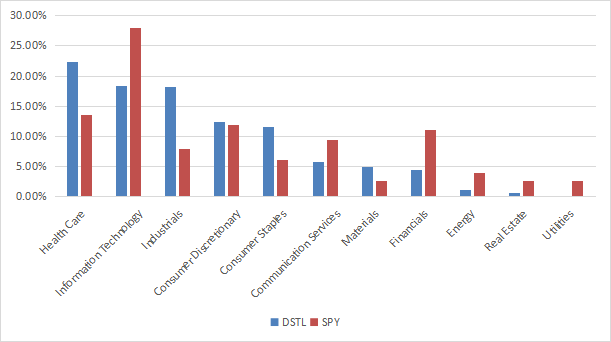
Since inception in October 2018, DSTL has outperformed SPY by 2.3 percentage points in annualized return. The risk measured in maximum drawdown and volatility (standard deviation of monthly returns) is similar.
|
Total.Return |
Annual.Return |
Drawdown |
Sharpe ratio |
Volatility |
|
|
DSTL |
91.60% |
20.58% |
-31.88% |
1.07 |
18.08% |
|
SPY |
78.99% |
18.24% |
-32.05% |
1.02 |
17.48% |
Data calculated with Portfolio123
The next chart plots the equity values of $100 invested in DSTL and SPY since DSTL inception. The two funds have alternatively outperformed each other. In the recent correction, DSTL drawdown was smaller.
DSTL vs. SPY (chart: author; data: portfolio123)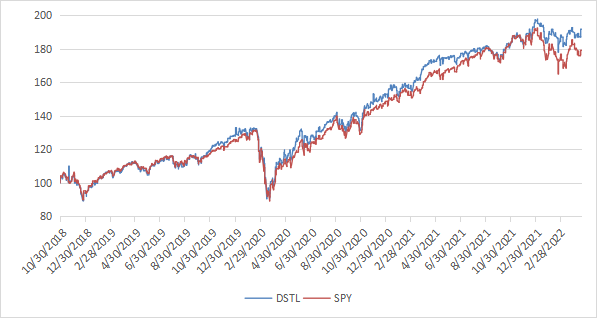
Scanning DSTL Portfolio For Value And Quality
As expected for a value ETF, DSTL is cheaper than the S&P 500 regarding the usual valuation ratios, reported in the next table.
|
DSTL |
SPY |
|
|
Price / Earnings TTM |
18.9 |
21.92 |
|
Price / Book |
3.89 |
4.23 |
|
Price / Sales |
1.56 |
2.94 |
|
Price / Cash Flow |
13.14 |
17.15 |
Three holdings are risky regarding my preferred quality metrics. These are companies with at least two red flags among: negative ROA, bad Piotroski score, and bad Altman Z-score. Risky stocks weigh less than 5% of the portfolio, which is a good point. The weighted average ROA is much better than for the S&P 500 (see next table). The Altman Z-score is also better and the Piotroski F-score is similar.
|
Altman Z-score |
Piotroski F-score |
ROA %TTM |
|
|
DSTL |
4.01 |
6.3 |
10.91 |
|
SPY |
3.51 |
6.4 |
7.78 |
These metrics point to a portfolio quality significantly superior to the benchmark.
Takeaway
DSTL implements a systematic strategy based on a ranking system using cash flow yield, its stability over time and debt. It is not only a value ETF, but also a quality ETF. DSTL portfolio is superior to SPY in aggregate valuation ratios and quality metrics. Price history is too short to elaborate an opinion about performance, but it gives encouraging clues. DSTL has beaten SPY by over 2 percentage points in annualized return without taking more risk in drawdown and volatility. The portfolio has a high turnover, which is not a bad thing when it comes with excess return, and expense ratio is reasonable for this category of product. With a note of caution due to its short history, DSTL implements a promising strategy efficiently mixing value and quality.
Be the first to comment