


Darren415
This article was first released to Systematic Income subscribers and free trials on Oct. 5.
Many income assets touched new lows at the start of October with the HY corporate bond yields moving closer to 10%. This further weakness in the income market opens up new opportunities for allocation in our view. In this article we look at previous episodes of similarly high yields. The key takeaway is that forward returns for 1-3 years after this event were almost universally positive.
While the broader income space looks quite attractive we remain convinced that we are not in a “buy everything” kind of environment. This is for three reasons. First, inflation expectations look too optimistic while Treasury yields remain significantly below current levels of inflation. Second, credit spreads are far from cheap territory. And three, the inverted yield curve is creating significant income tailwinds for certain leveraged assets.
For these reasons we continue to focus on assets which take advantage of the current market environment, specifically focusing on decent-quality, shorter-maturity assets.
Past Is Prologue
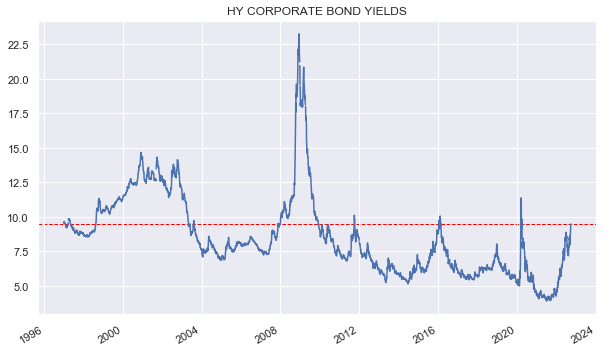
Let’s take a big picture look at what the high-yield corporate bond yields look like over the last 25 years or so. Current yields of around 9.5% are above their recent June peaks and are also not far from previous peaks except for two – the recession of the early 2000s and the GFC.
Systematic Income
One way to look at current yield levels is to see what forward returns were in the high-yield corporate bond space for positions entered at the current level of 9.5%. These levels were breached in 1996, 1998, 2007, 2011, 2016 and 2020.
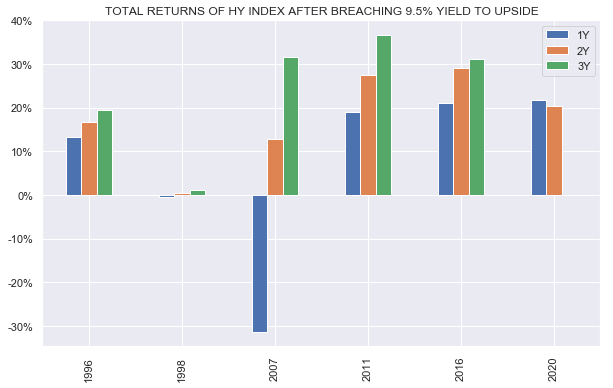
The chart below shows unannualized 1Y, 2Y and 3Y total returns for High-Yield corporate bonds entered when the sector yield breached 9.5% to the upside.
Systematic Income
What we see is that in only one case – the 1Y forward return in Nov-2007 to Nov-2008 was the return negative (though it was a doozy). The 2Y and 3Y returns were strongly positive for that period, however.
This highlights another important factor in investor allocations which is a worry about defaults and how they will impact total returns. This is the right thing to worry about, however, as the chart above shows an increased level of defaults over these periods did not prevent total returns from being strongly positive across all 2Y and 3Y periods.
A big part of the reason why defaults did not historically prevent returns from being strongly positive is that credit spreads, which are the compensation for taking credit risk, have typically exceeded the default (and especially the loss) rate.

JPM
In addition, it’s worth highlighting that investors earn the credit spread that they allocate at over the life of the portfolio while defaults tend to peak quite quickly. It also ignores the recovery rate – historically high-yield corporate bonds have seen recoveries of around 40% meaning each 1% default rate only led to a 0.6% loss. Third, defaults don’t tend to happen from par – bonds that default will tend to already trade at fairly depressed prices, further minimizing actual losses. Finally, there is also a Treasury yield component that investors earn on their holdings which goes straight to their bottom line.
And Some Risks
This upbeat forward return study does not suggest that we are definitely not going to see more volatility or lower prices, or that some income assets won’t continue to struggle. It also doesn’t mean that the (likely) coming recession is going to neatly fit into the previous episodes we saw over the last couple of decades.
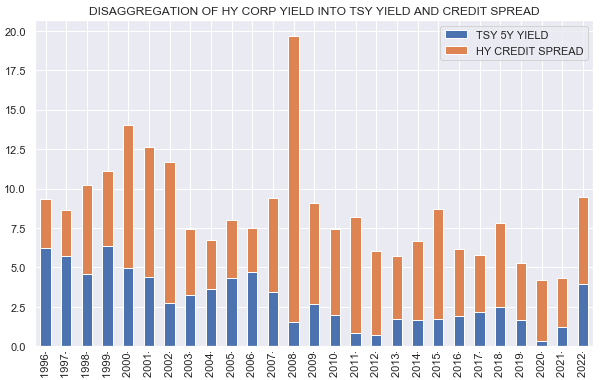
Finally, it has to be said that while overall yields are fairly elevated, particularly looking over the past decade, credit spreads are still on the tighter-end of their historic levels. In other words, the reason why high-yield corporate bond yields look high is mainly due to an unusually high level of Treasury yields versus credit spreads. We can see this in the rightmost bars in the chart below where the blue bar (5Y Treasury yield) looks unusually high relative to the previous 15 years or so.
Systematic Income
This means the current market environment could, in effect, overstate how attractive current income yields are. In other words, high corporate bond yields are largely due to high Treasury yields which are high due to high inflation. In other words, investors are compensated less for bearing credit risk than for bearing inflation risk.
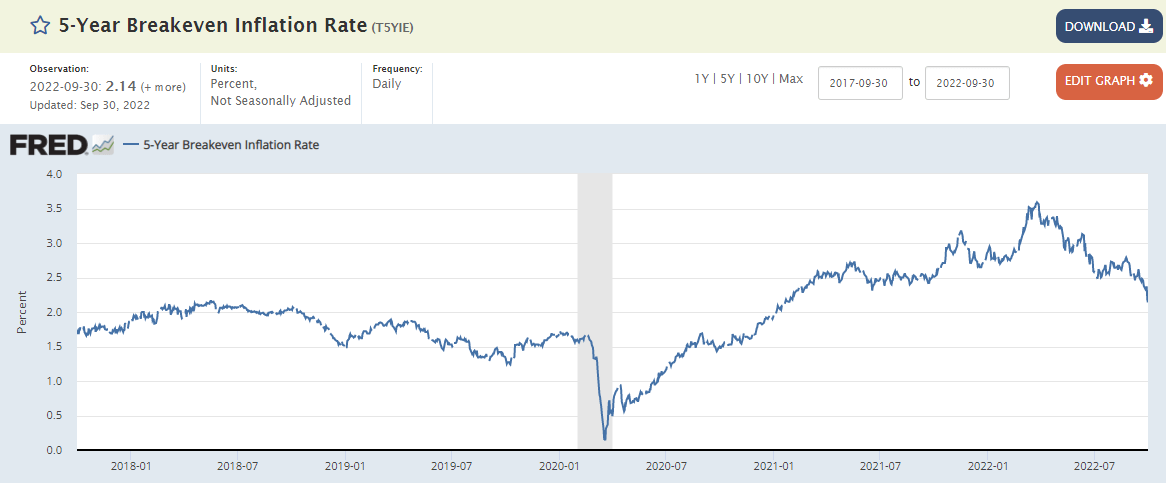
The downside here is that inflation remains even more persistent than market participants currently expect. For example, the current 5Y inflation breakeven rate (i.e. inflation expectations as sourced from the TIPS market) seem too low at close to 2%. If inflation remains significantly above this figure for longer we could see a further rise in yields which would be a drag on return. It could also mean that if we fall into a recession, the typical pattern of falling Treasury yields which historically supported bond prices, may no longer be a tailwind and corporate bond returns would be lower going forward.
FRED
Overall we see two main risks for investors. One is that credit spreads continue to rise. As discussed, spreads are on the expensive end of the fair-value range in our view which creates a potential vulnerability for the market.
And second, breakeven inflation looks too optimistic. Or in other words, the gap between Treasury yields and current inflation could continue to close. This is not our base case but it cannot be ruled out.
This is why within a diversified portfolio we continue to focus on decent-quality assets (given credit spreads could continue to rise), as well as shorter-maturity assets (which are less vulnerable to a back-up in both credit spreads and Treasury yields due to their lower credit duration). We are also cautious on leveraged assets with fixed-income assets and floating-rate liabilities given the sharp back-up in short-term rates which could easily remain high for an extended period of time. These securities will continue to see a reduction in the amount of income they can generate for investors.
Some Ideas
Though we continue to hold positions in many of the typical credit assets such as high-yield corporate bond and loan funds, our focus for new capital allocations at present lies on shorter-duration, decent-quality securities.
These include the Angel Oak Financial Strategies Income Term Trust (FINS) trading at a 12.8% discount and a 8.5% yield. The fund holds primarily investment-grade floating-rate bonds. FINS just released its shareholder report where it registered a sizable 17% rise in net income over the previous semi-annual period. This is despite the fact that the average level of Libor for the period was a full 2.5% below current levels which suggests a big rise in net income over the coming year.
We also like the Cohen & Steers Limited Duration Preferred & Income Fund (LDP) which allocates to mostly investment-grade preferreds while hedging some of the long duration exposure. The fund trades at a 8.6% yield and a 7.7% discount.
The AGNC Series G (AGNCL) looks attractive as well at a 9.35% yield which resets to a 5Y Treasury yield + 4.39% in 2027 unless redeemed. The preferred has a decent level of equity coverage on a portfolio of agency MBS securities.
Finally, the Business Development Company Golub Capital (GBDC) has a strong credit underwriting history with a floating-rate profile. It trades at a 9.1% yield and a 87% valuation.
Be the first to comment