

RHJ
Part I – Introduction
Idaho-based Hecla Mining (NYSE:HL) produces 40% of all silver made in the USA and relies heavily on this commodity, which has not been doing great the past few months.
However, the gold segment, with 46.4%, is the most significant part of the revenues in the third quarter, as the chart below shows:
HL Quarterly Revenue per metal in 3Q22 (Fun Trading)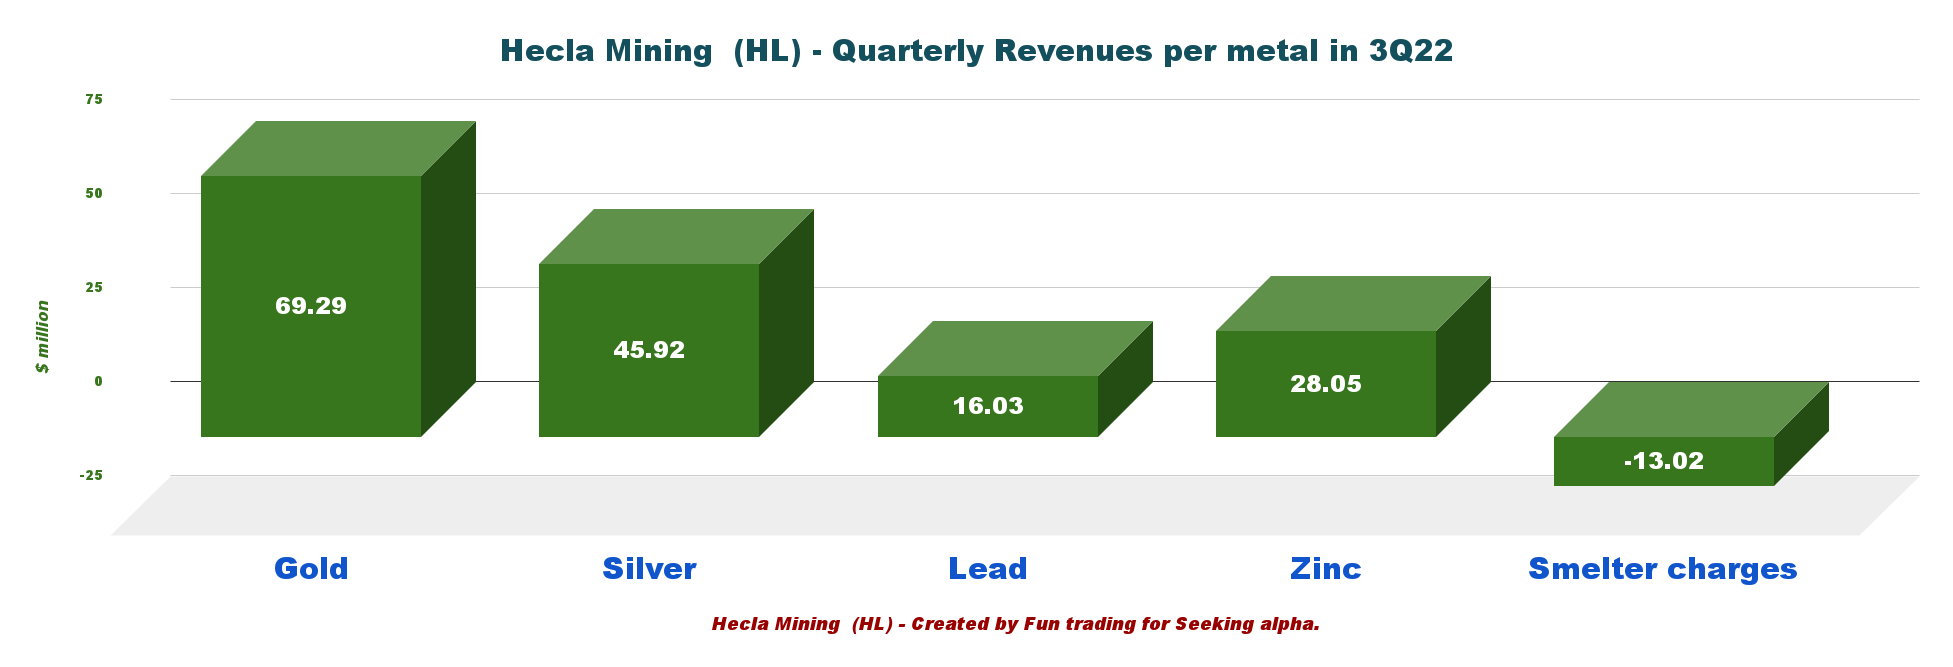
The Company released its third quarter of 2022 results on November 9, 2022.
Note: This article is an update of my article published on September 7, 2022. I have followed HL on Seeking Alpha since June 2019.
1 – A new beginning with the Alexco acquisition and the Keno Hill project in Yukon
On July 5, 2022, Hecla Mining announced the acquisition of Alexco Resources (AXU). The sale was completed on September 9, 2022.
Hecla issued 17,992,875 million shares of its common stock to Alexco shareholders for a total consideration of approximately $69 million… The silver streaming interest at Alexco’s Keno Hill property held by Wheaton Precious Metals Corp was terminated in exchange for US$135 million of Hecla common stock, in the form of 34,800,989 million shares of Hecla common stock… Hecla provided Alexco with a US$30 million secured loan facility, of which US$25 million was drawn when the transaction closed.
With this new addition, the company expects production growth of 30-50% to 17-20 Ag Moz by 2024. The Keno Hill Silver project was the motivation for the Alexco acquisition.
HL Quick November Snapshot (HL November Presentation)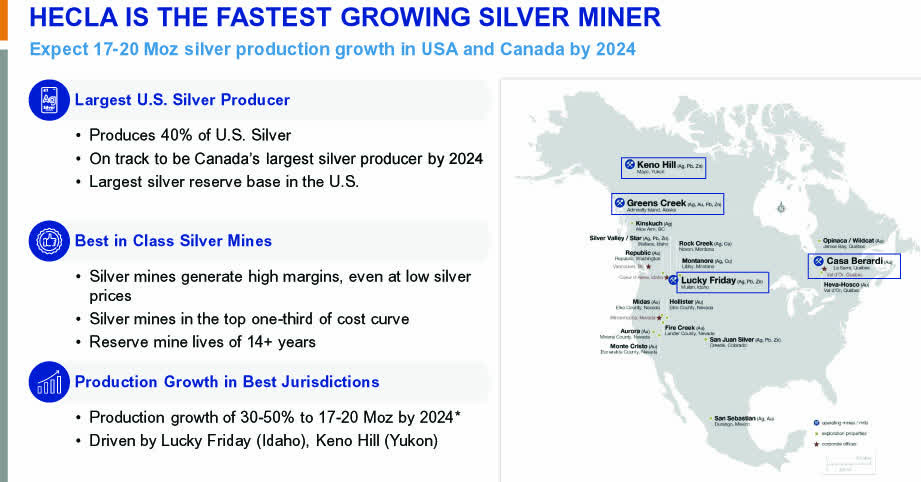
I consider Keno Hill a significant acquisition with excellent growth potential, which helped the stock over the past few months. The Keno Hill is expected to be in full production at the end of 2023.
At the Keno Hill mine, focus is on development and drilling of the Bermingham and Flame & Moth deposits to bring the mine into full and consistent production by the end of 2023. As of October 31, 2022, 30% of total planned pre-production development is complete, and we expect to complete approximately 50% of the development by the end of the fourth quarter. (press release)
HL Keno Hill Project previous presentation (HL Presentation)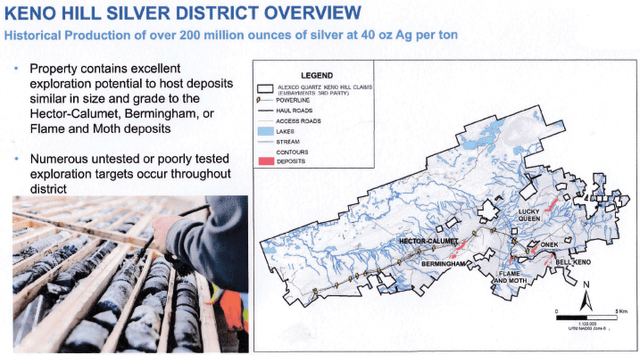
President and CEO Phillips Baker said in the conference call:
While we are investing our business with large capital programs in each of the mines at Keno Hill, we ended the quarter with a very strong balance sheet, which we’re committed to maintain.
2 – 3Q22 results snapshot
Hecla Mining announced that the Company produced 3,549.4K Ag Oz and 44,747 Au Oz in the third quarter of 2022. Revenues were relatively weak, $146.34 million, due to the assignment of approximately $24 million in sales at Greens Creek and Lucky Friday to the fourth quarter silver mines.
HL Revenues and costs 1Q to 3Q (HL Presentation)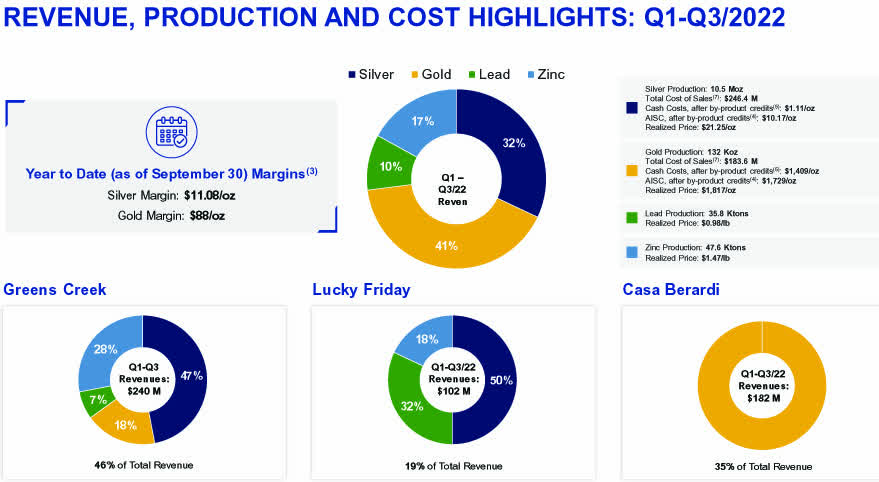
3 – Stock performance
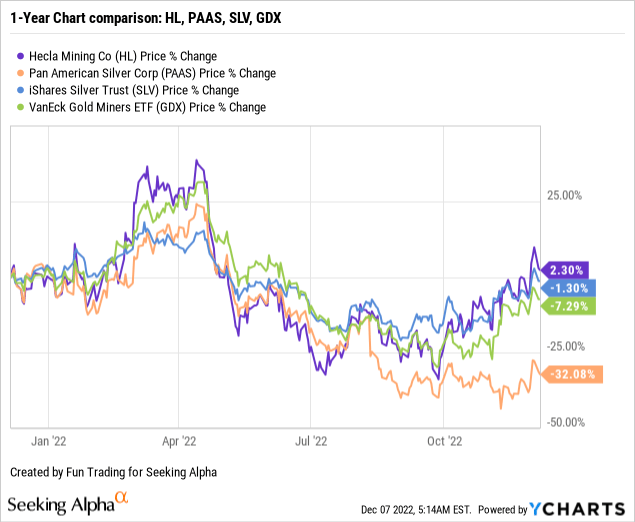
HL has outperformed the VanEck Vectors Gold Miners ETF (GDX) and the iShares Silver Trust (SLV) on a one-year basis. Hecla Mining is up 2% on a one-year basis. I have indicated Pan American Silver (PAAS) which represents a good comparison.
4 – Investment thesis
Despite a struggling commodity environment and painful inflationary pressures, I continue rating HL as a potential long-term investment in gold and silver. The Keno Hill project, the company’s substantial silver margin and its sound balance sheet with a liquidity of $262 million as of November 2022 justify the narrative.
I can see potential, even if the price has significantly recovered since my last article, where I noticed a stock price opportunity to build a safe long-term position with assets in North America.
On the commodity price side, gold and silver have recovered nicely in the past few weeks, but it is still very volatile, and the next Fed rate decision on December 14 could stop this nascent rally.
However, as I said in my preceding article, the Company is small and presents recurring technical weaknesses. Inflationary pressures are an increasing threat, especially for the Casa Berardi mine, but the by-product metals (lead and zinc) have partially offset, so far, their harmful effects.
Thus, I suggest trading short-term LIFO HL using at least 40% of your total position – more details at the end of this article.
Hecla Mining – Company Balance Sheet And Production In 3Q22 – The Raw Numbers
| Hecla Mining | 3Q21 | 4Q21 | 1Q22 | 2Q22 | 3Q22 |
| Sale Revenue and others in $ million | 193.56 | 185.08 | 186.50 | 191.24 | 146.34 |
| Net Income in $ million | -0.98 | 11.88 | 4.15 | -13.52 | -23.53 |
| EBITDA $ million | 46.64 | 29.54 | 55.65 | 35.44 | 10.91 |
| EPS diluted in $/share | 0.00 | 0.00 | 0.01 | -0.03 | -0.04 |
| Cash from operating activities in $ million | 42.74 | 53.36 | 37.91 | 40.18 | -24.32 |
| Capital Expenditure in $ million | 26.90 | 28.84 | 21.48 | 34.33 | 37.43 |
| Free Cash Flow In $ million | 15.84 | 24.52 | 16.43 | 5.85 | -61.75 |
| Total cash $ million | 190.90 | 210.01 | 212.03 | 198.19 | 144.67 |
| Total debt in $ million | 521.89 | 521.48 | 523.43 | 534.54 | 530.75 |
| Dividend per share in $ | 0.00625 | 0.00625 | 0.00625 | 0.00625 | 0.00375 |
| Shares outstanding (diluted) in a million | 536.97 | 543.13 | 544.06 | 539.40 | 554.53 |
| Silver and Gold Production | 3Q21 | 4Q21 | 1Q22 | 2Q22 | 3Q22 |
| Silver Production K Au Oz | 2,676 | 3,227 | 3,325 | 3,645 | 3,549 |
| Gold production K Ag Oz | 42.21 | 47.98 | 41.64 | 45.72 | 44.75 |
| Silver realized $/oz | 23.97 | 23.49 | 24.68 | 20.68 | 18.30 |
| Gold price realized $/oz | 1,792 | 1,797 | 1,880 | 1,865 | 1,713 |
| Ag AISC by-product | 12.82 | 10.08 | 8.66 | 8.55 | 14.20 |
Data Source: Company material 10-Q.
Part II – Analysis: Silver And Gold Production Details For The Third Quarter Of 2022
1 – Total silver/gold production
HL Quarterly gold and silver production history (Fun Trading)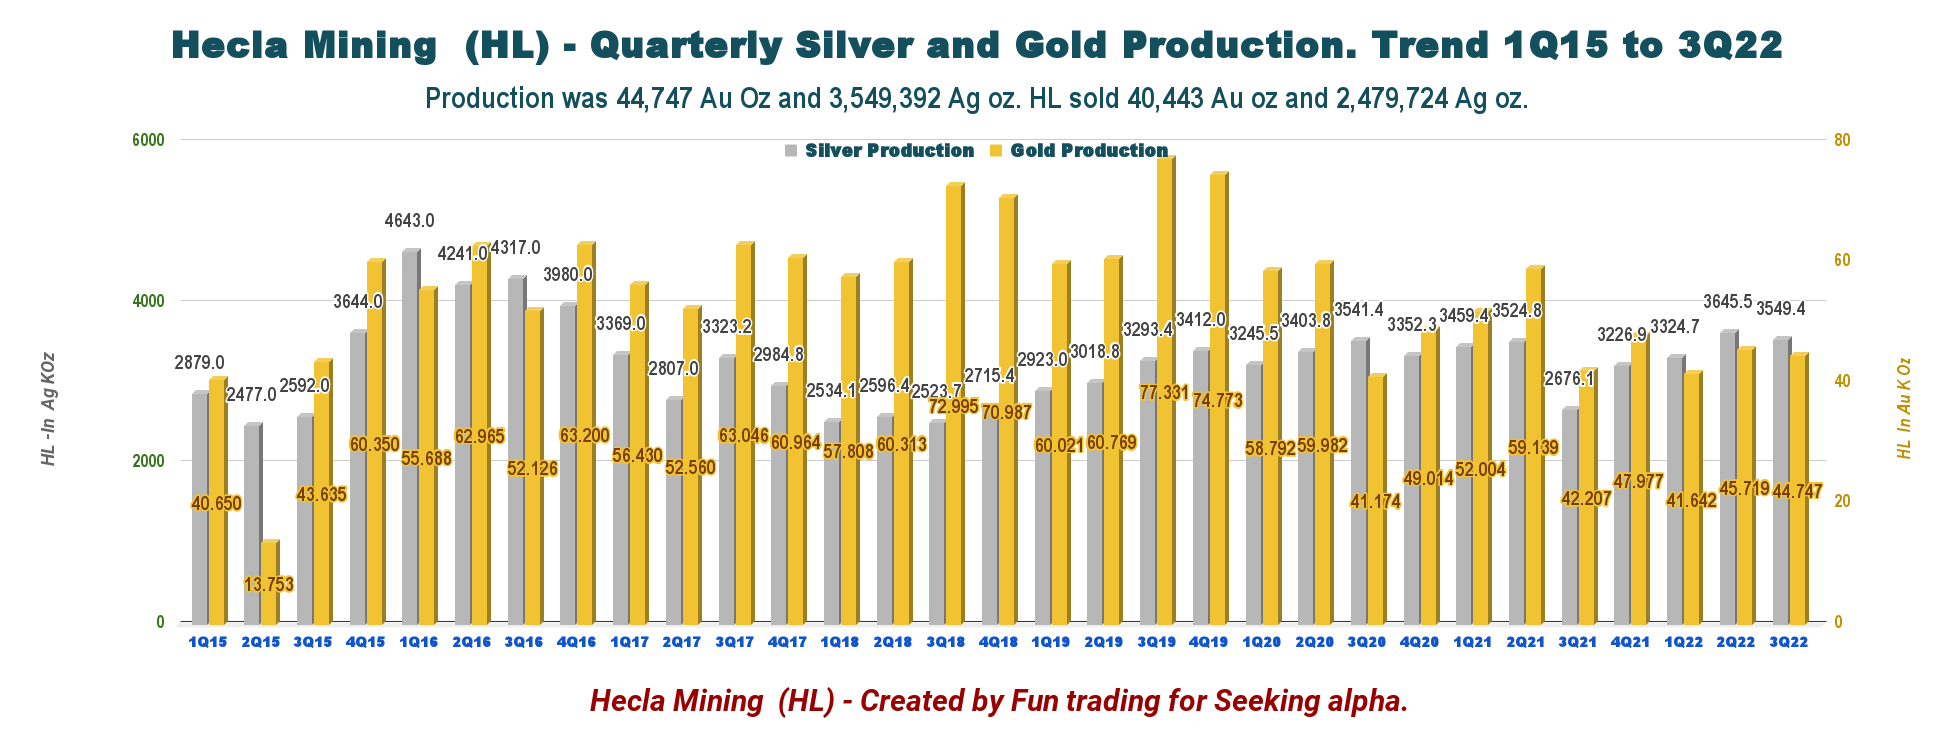
This quarter, gold and silver production increased sequentially, with silver production of 3.55 Moz and gold production of 44,747 Oz.
Below is the production history at the Greens Creek mine, which is the Company’s flagship:
HL Greens creek production history (Fun Trading)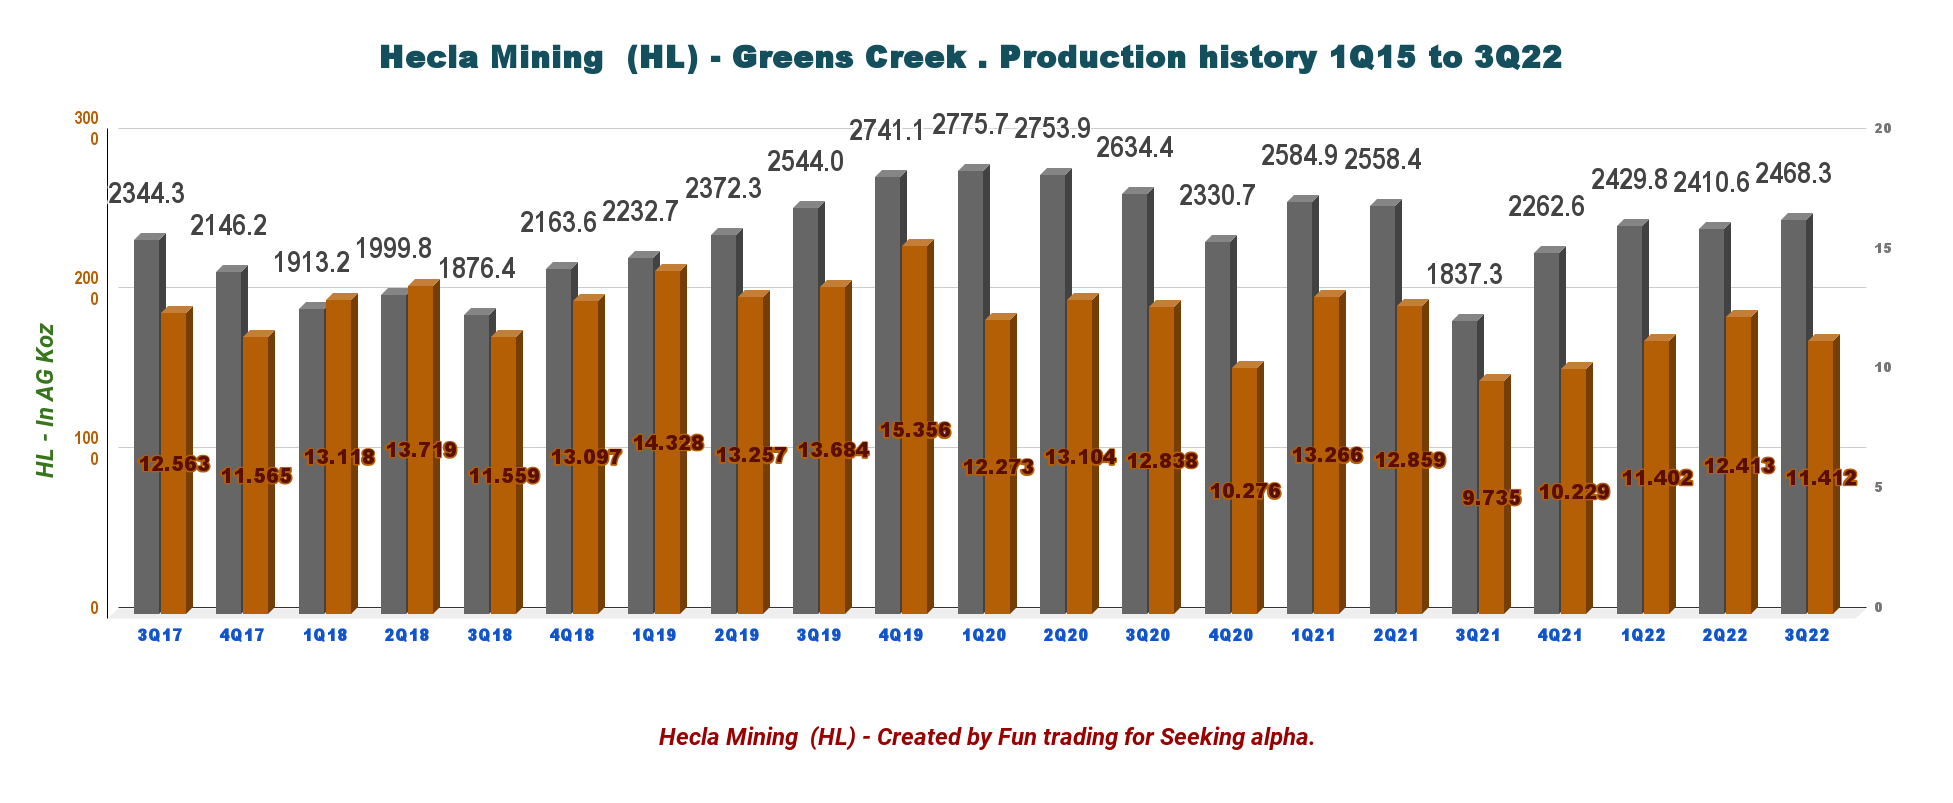
Details per mine are below:
HL Quarterly production per mine 3Q22 (Fun Trading)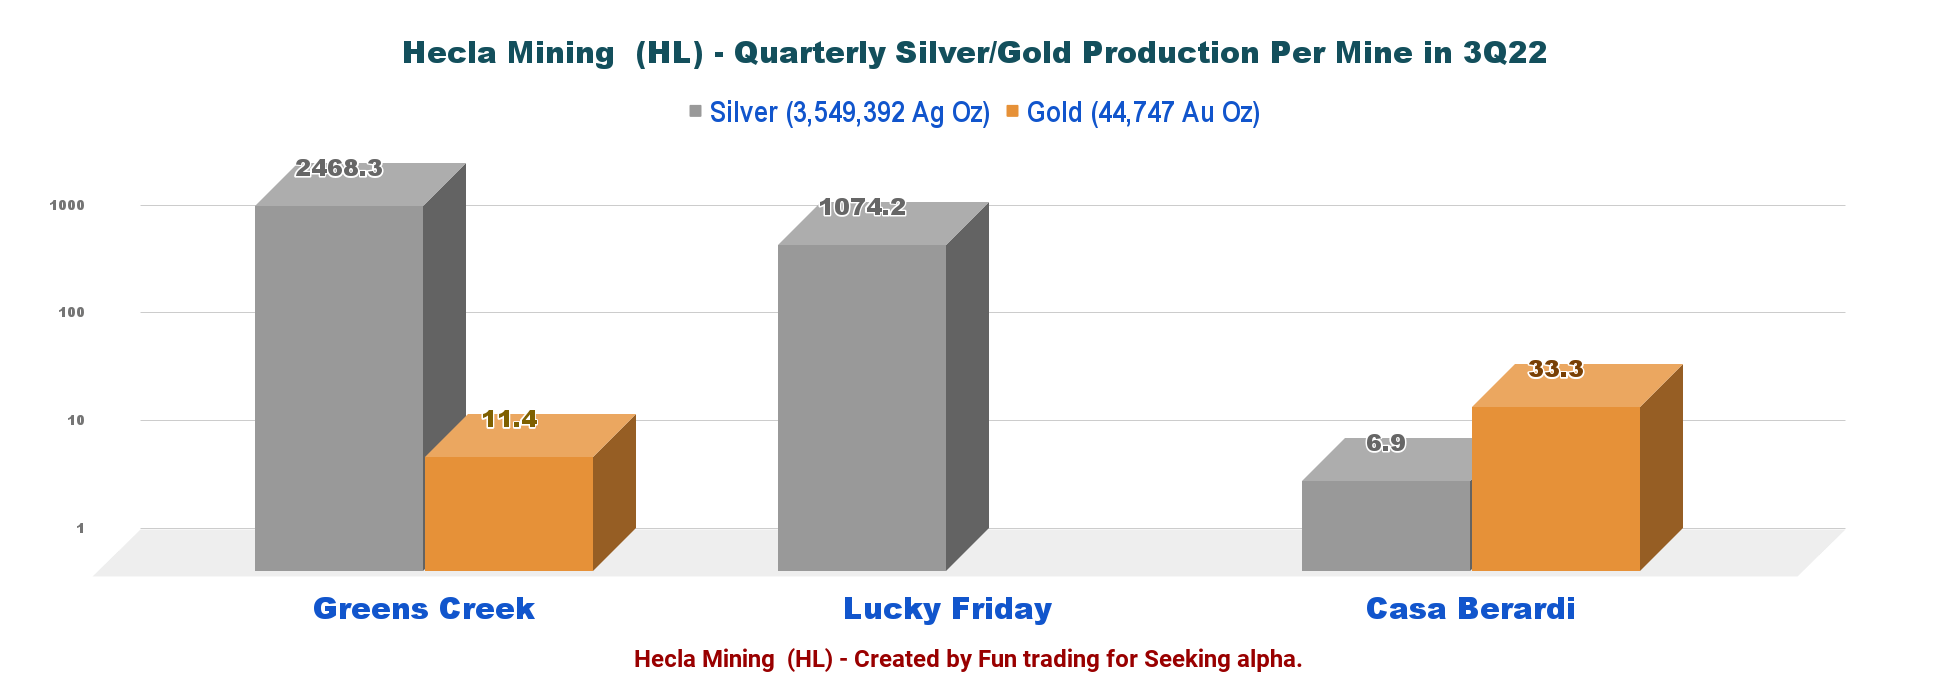
| Metal price in 3Q22 | Price $ |
| Gold per ounce |
1,713 |
| Silver per ounce | 18.30 |
| Lead per Lb | 0.95 |
| Zinc per Lb | 1.23 |
2 – All-in sustaining costs and silver price realized history
HL Quarterly AISC and Silver history (Fun Trading)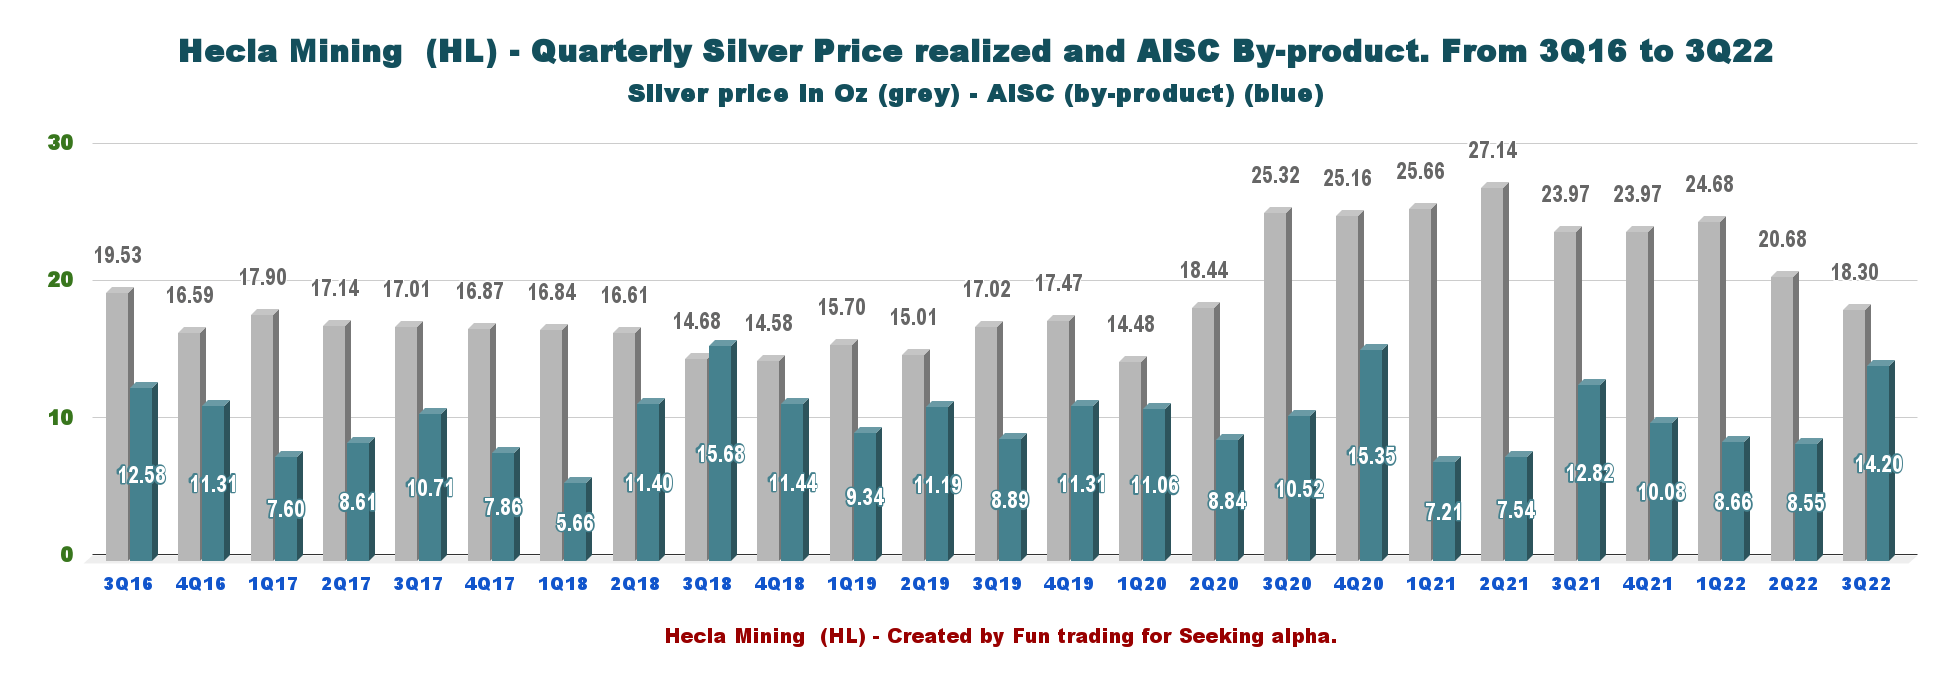
CFO Russell Lawlar said in the conference call:
we’ve seen in inflationary environment of earlier this year continuing to the third quarter where prices of key inputs continue to remain elevated around 15% higher than at the beginning of the year. We are continuing to experience a tight labor market especially as we recruit for experienced miners in skilled trades such as mechanics and electricians.
3 – 2022-2024 guidance increase
The Company has reaffirmed its annual production, cost, exploration, and pre-development guidance. In November, the company increased its forecast, as shown below.
The Company is maintaining its consolidated capital guidance with lower forecasted CapEx at Lucky Friday and Casa Berardi due to the timing of expenditures, offset by the inclusion of Keno Hill.
HL November Guidance 2022-2024 (HL Presentation)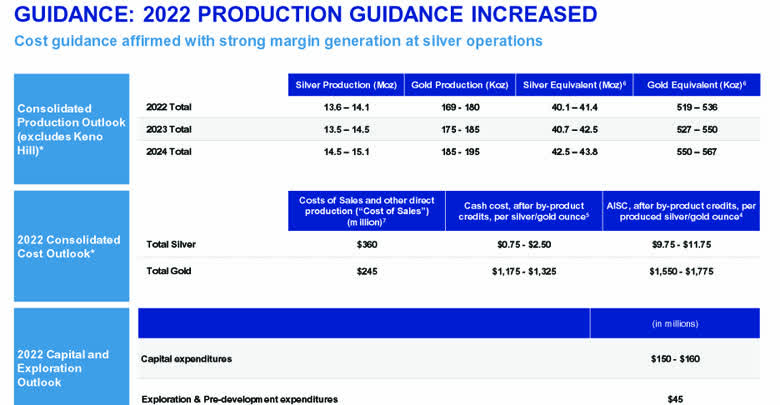
Part III – Financial Snapshot
1 – Total revenues were $146.34 million in 3Q22
HL Quarterly Revenues history (Fun Trading)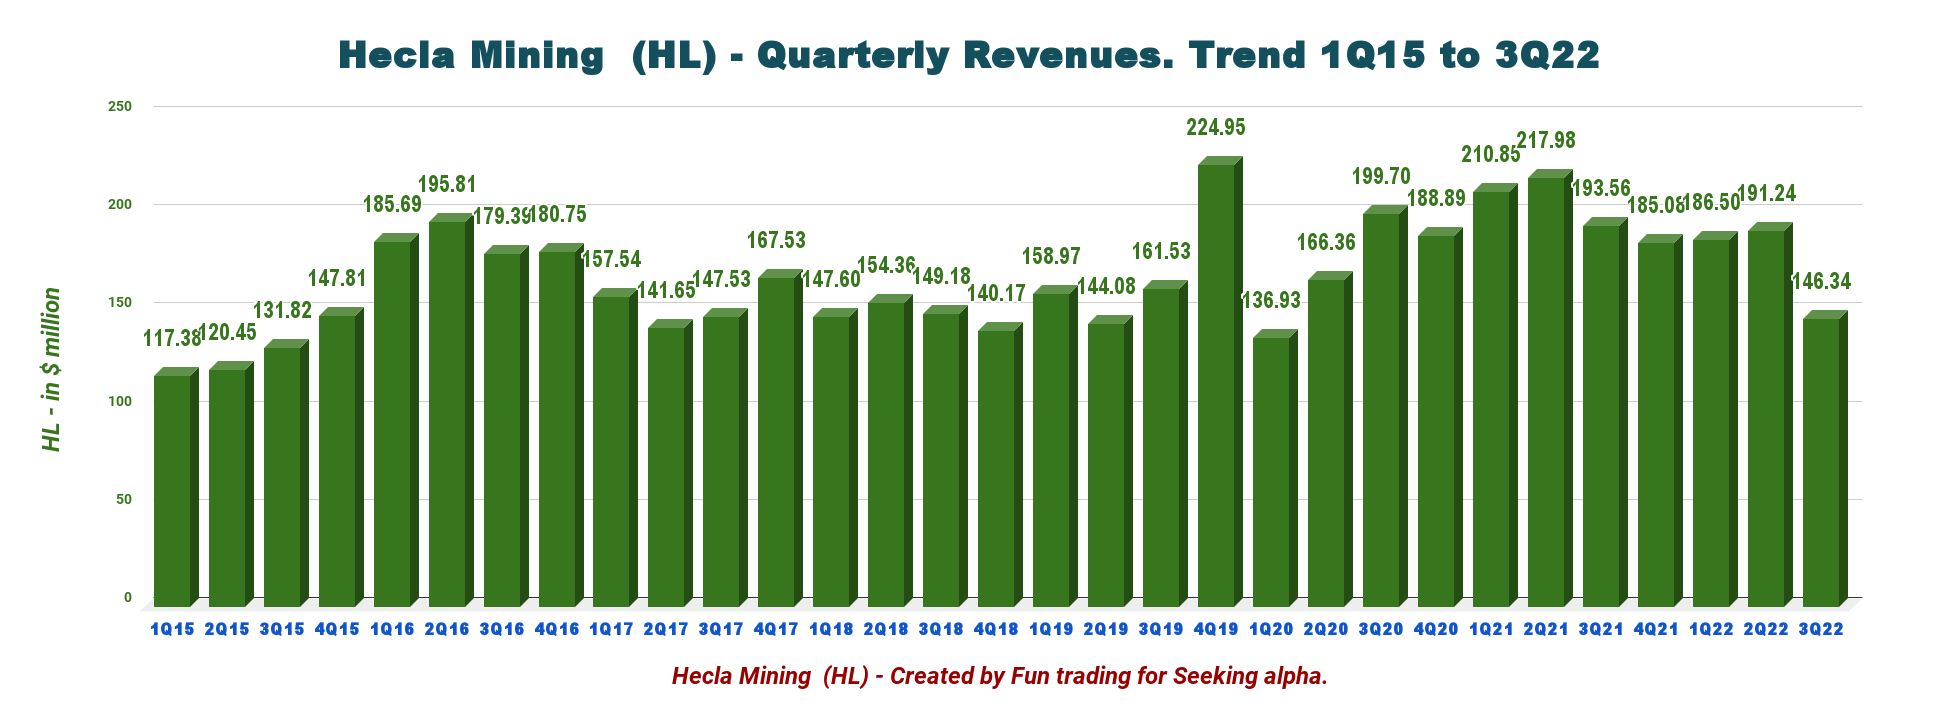
The revenues were $146.34 million in 3Q22, down from $193.56 million a year ago and down 23.5% sequentially.
Hecla Mining reported a third quarter loss of $23.53 million, or 0.04 per diluted share, compared to a loss of $0.98 million in the same period a year earlier, or $0.00 per diluted share.
CFO Russell Lawlar said in the conference call:
Our revenues decreased approximately $45 million from the prior quarter primarily due to the deferral at Greens Creeks and lucky Friday silver shipments to the fourth quarter as Lauren has described. These different shipments had an impact of approximately $24 million on revenues. And we also saw lower prices across all four metals.
2 – Free cash flow was a loss of $61.75 million in 3Q22
HL Quarterly Free cash flow history (Fun Trading)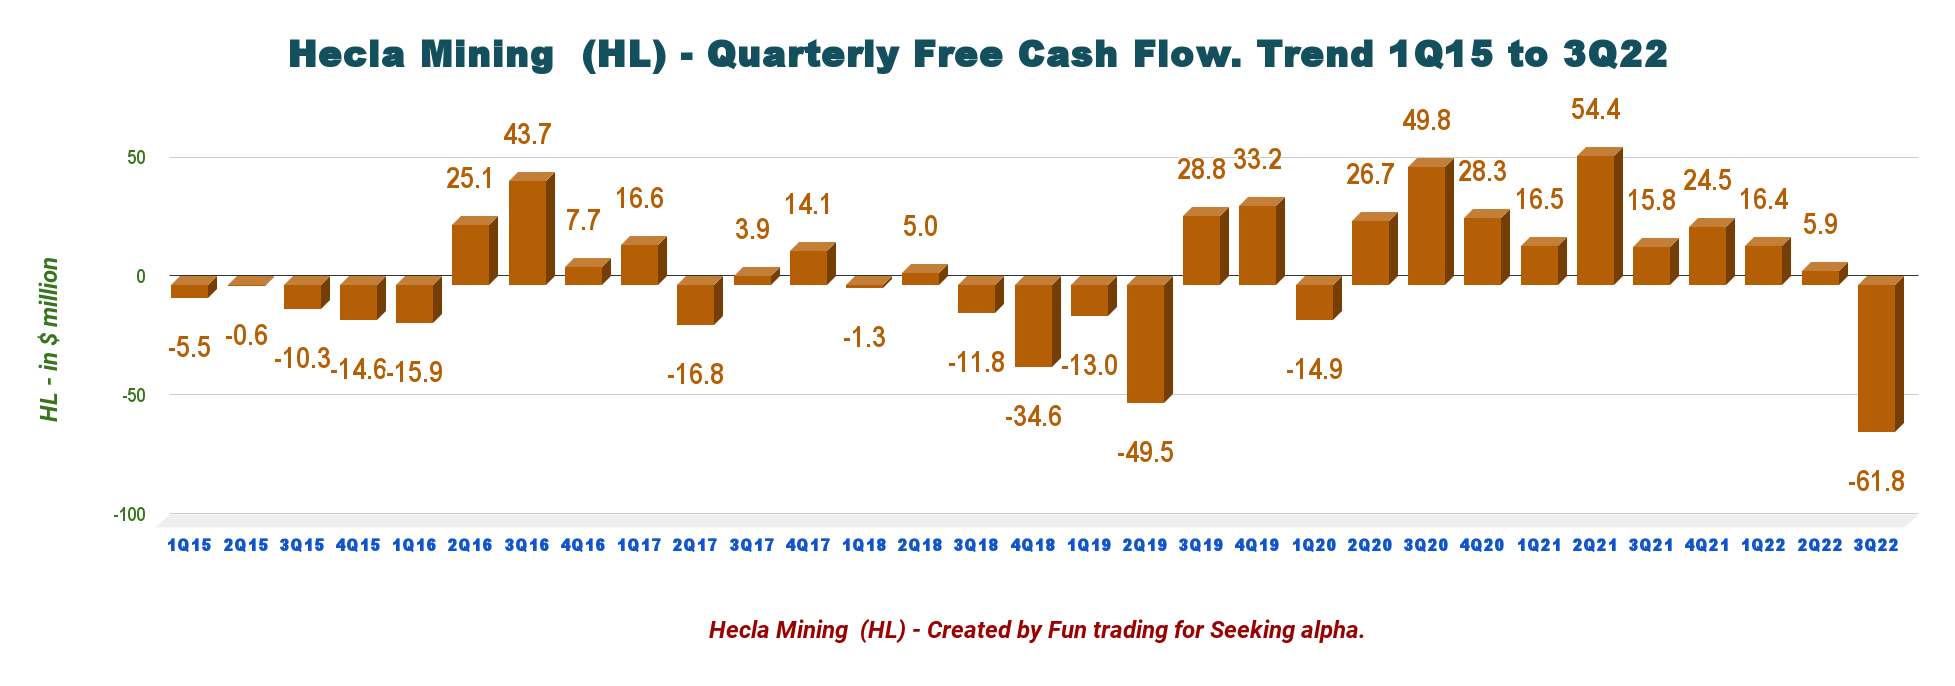
Note: The generic free cash flow is the cash from operating activities minus CapEx.
Trailing 12-month free cash flow was a loss of $14.95 million, with a free cash flow loss of $61.75 million this quarter.
The quarterly dividend dropped to $0.00375 per share due to the drop in free cash flow. I think the quarterly dividend will be back to $0.00625 in 4Q22.
3 – The net debt is $407.17 million in 3Q22
HL Quarterly Cash versus Debt history (Fun Trading)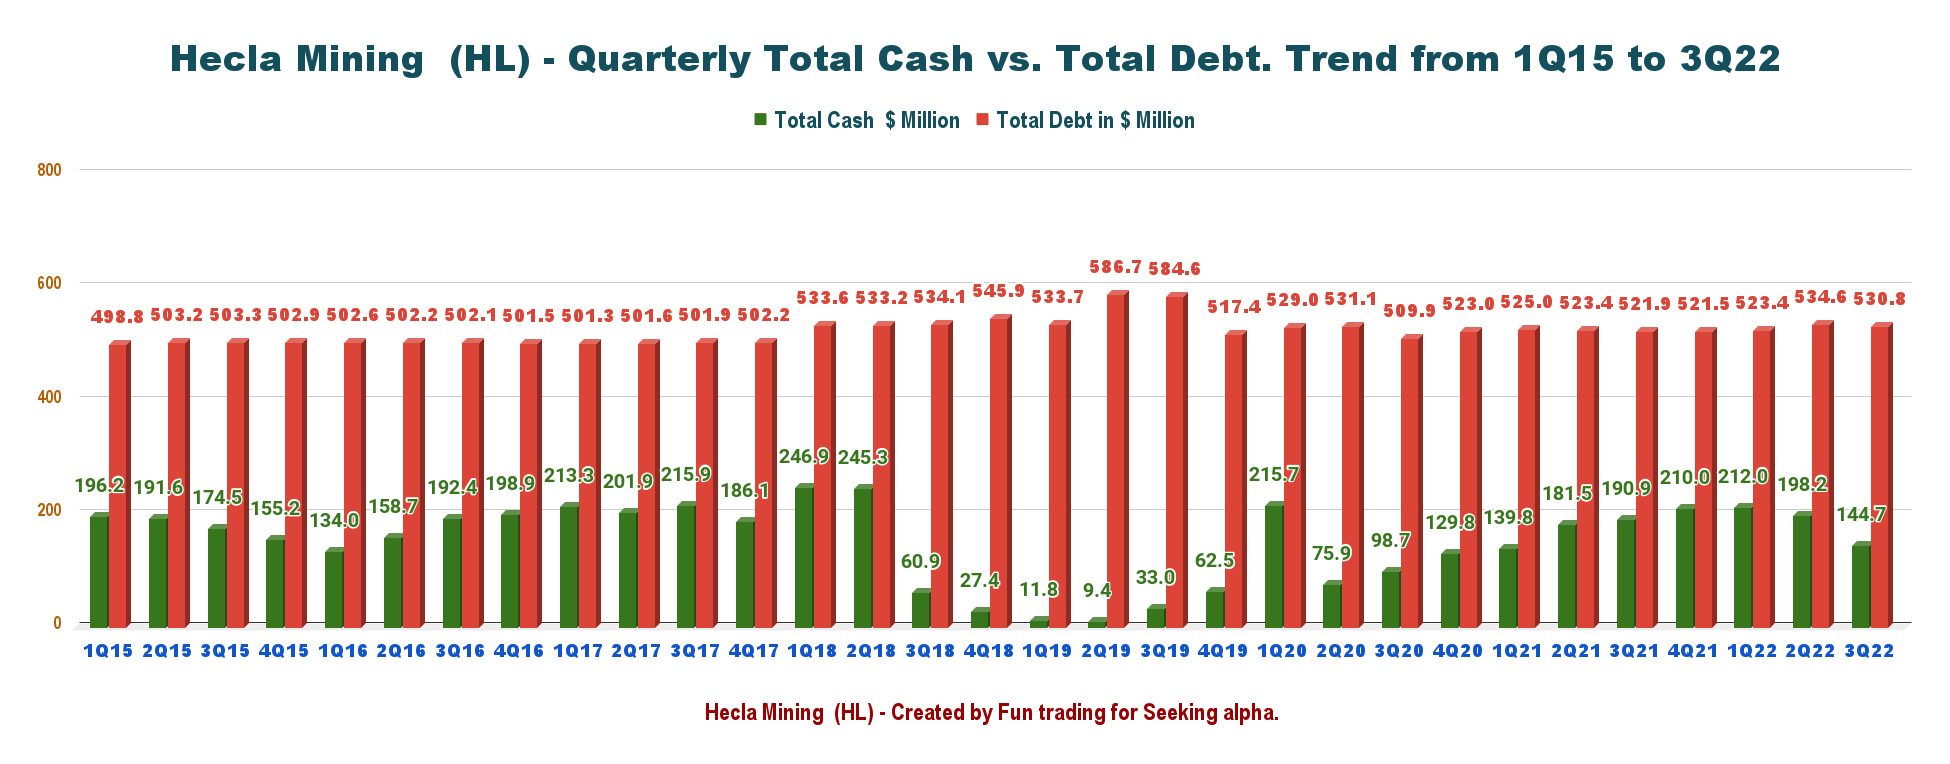
The Company indicated $144.67 million in total cash. Net debt is now $407.17 million. Available liquidity is over $262 million for the third quarter. The net debt/LMT adjusted EBITDA is 1.9x.
On July 21, 2022, the company entered a new credit agreement facility. The New Credit Agreement is a $150 million senior secured revolving facility, with an option to be increased in an aggregate amount not to exceed $75 million. The revolving loans under the New Credit Agreement will have a maturity date of July 21, 2026.
Part IV – Technical Analysis And Commentary
HL TA Chart short-term (Fun Trading StockCharts)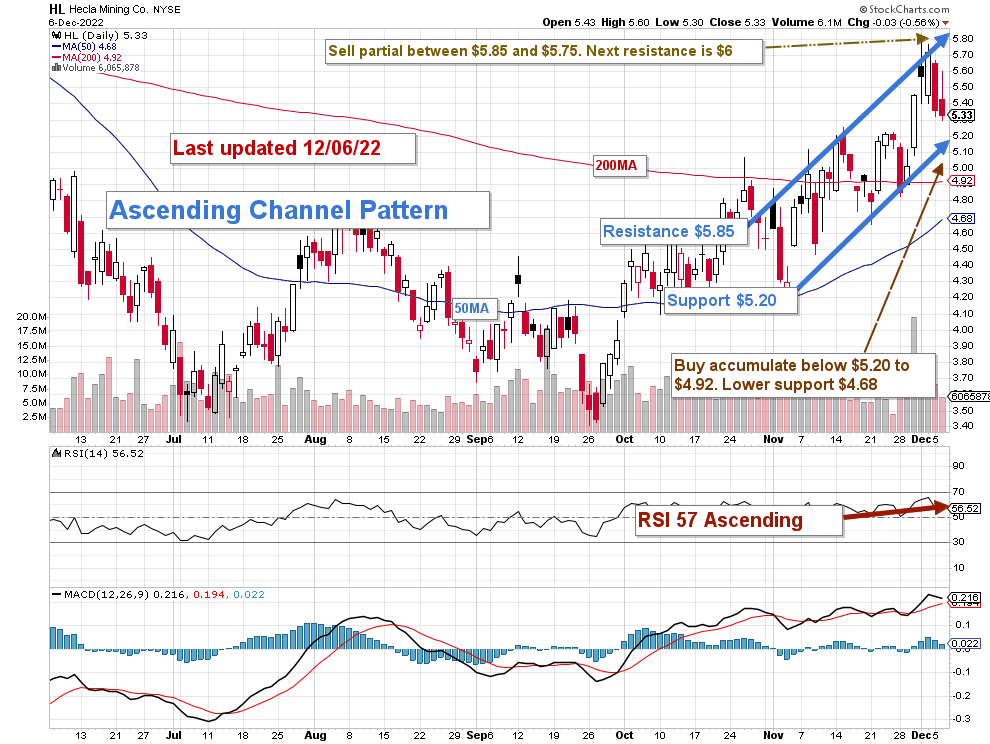
Note: The chart is adjusted for the dividend.
HL forms an ascending channel pattern, with resistance at $5.85 and support at $5.20. Ascending channel patterns are short-term bullish moving higher within an ascending channel, but these patterns often form within longer-term downtrends as continuation patterns.
The trading strategy is to take profits between $5.75 and $5.85 and accumulate below $5.20 to $4.92, with a possible lower low at $4.68.
As I said in my preceding article, I recommend using about 50% of your long position to trade LIFO, which is perfectly adapted to the high volatility of the gold and silver sectors, which are struggling due to the Fed’s action against rampant inflation.
Gold and silver prices have dramatically retreated since mid-April but have recently recovered, as shown below.
HL Gold and silver 1-year chart comparison (Fun Trading StockCharts)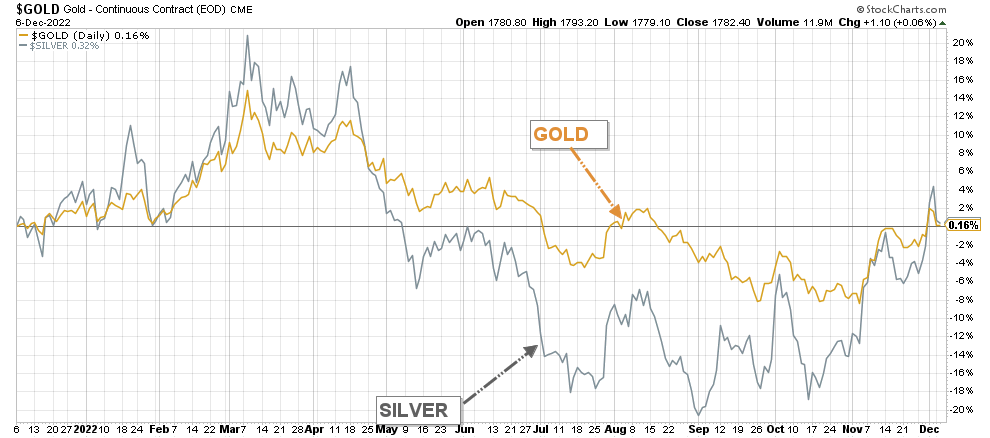
However, if the gold and silver prices can somehow turn bullish from here, which is debatable, HL could trade above $5.15 with a possible retest of $6.
Warning: The TA chart must be updated frequently to be relevant. It is what I am doing in my stock tracker. The chart above has a possible validity of about a week. Remember, the TA chart is a tool only to help you adopt the right strategy. It is not a way to foresee the future. No one and nothing can.
Author’s note: If you find value in this article and would like to encourage such continued efforts, please click the “Like” button below as a vote of support. Thanks.
Be the first to comment