

tomch
Thesis
By this time, Google, aka Alphabet Inc. (NASDAQ:GOOG), investors have had plenty of time to digest its Q2 earnings. Overall, the search engine giant reported a healthy quarter and reported some margin pressure. Revenues grew to $69.69B, representing a 12.6% YoY growth. But profit declined by about 14% (from $18.5B a year ago to $16B) due to margin pressure. The pressure came from record dollar strengthening (causing about a 3.4% headwind alone), rising TAC costs, and also general inflation.
Here we want to take a step back from the busy earnings season and just review the basics. I will put GOOG on our investment roadmap to gain a broader perspective. And the conclusion is really clear – under the current conditions, GOOG provides far superior return potentials to the overall market. You will see that the key argument is built on 4 simple charts, illustrating its extremely competitive return on capital employed (“ROCE”), capital allocation flexibility, growth potential, and reasonable valuations. And I will start with ROCE immediately below.
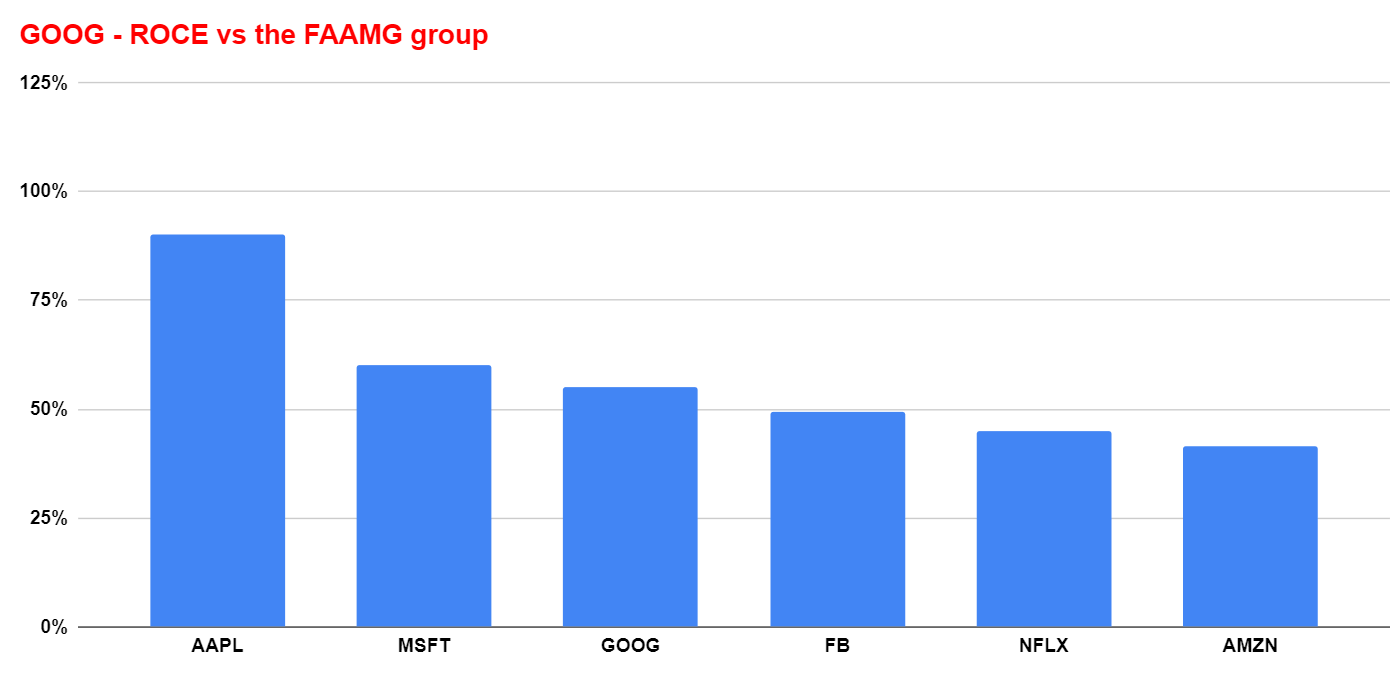
Chart 1: ROCE competitive even among FAAMG
The following chart compares GOOG’s ROCE against the FAAMG group. In my view, ROCE is the most fundamental profitability measure as detailed in my blog article. As seen, its ROCE is about 55% on average in recent years. Admittedly, its ROCE has been better before. It peaked around 75% during 2011 and have graduated declined to the current 55% over the years due to competition (more on that later) and the various headwinds mentioned above. However, a 55% ROCE is still extremely competitive, even among the FAAMG pack. It is a close third, only slightly below MSFT’s 60%.
Looking forward, I am optimistic about its profitability. It still dominates the search space and at the same time has plenty of other growth opportunities ongoing. Take YouTube as an example: a recent Pew Research Center survey showed YouTube has replaced Facebook and has become the most popular platform among teenagers. More specifically, the survey found that the percentage of 13- to 17-year-olds using Facebook has dropped from 71% in 2015 to 32% now. And YouTube is the platform that grabbed the most Facebook users. 95% of teens in this age group use YouTube, and 19% of them say YouTube is their most used platform. As the parent of a teenage kid, I can add one more confirming data point to this survey.
Author
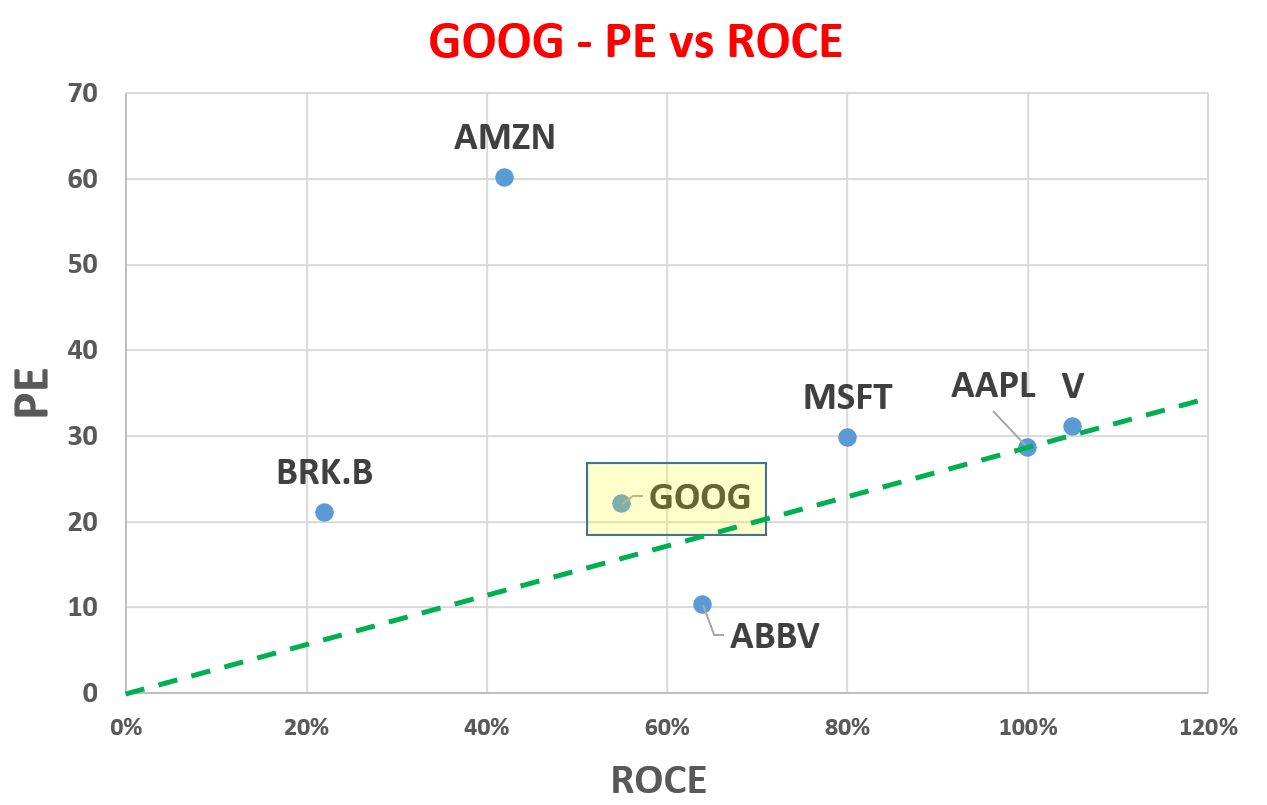
Chart 2: competitive against Buffett picks too
Besides comparing it to its FAAMG peers, another of my favorite comparison is against Buffett-type compounders including Apple (AAPL), Visa (V), Amazon (AMZN), AbbVie (ABBV), et al, as shown in the second chart below. As detailed in my earlier articles:
Instead of looking at ROCE or PE alone, the chart plots them together to show valuation adjusted for quality. The green line is what I call the Buffett value line. It is a line linking A) the origin (a business that has 0 ROCE should be worth zero PE), and B) Buffett’s two large holdings, Apple and Visa, both happen to have the highest ROCE among this group of stocks.
Now you can clearly see how GOOG stacks up against these Buffett-type compounders. AAPL and V may seem expensive in terms of PE (about 28x and 31x respectively). But such PEs are totally reasonable when adjusted for their astronomical ROCEs (in the range of 90% to 95% respectively). GOOG is quite close to this line too as you can see at its current PE of around 22x.
Author
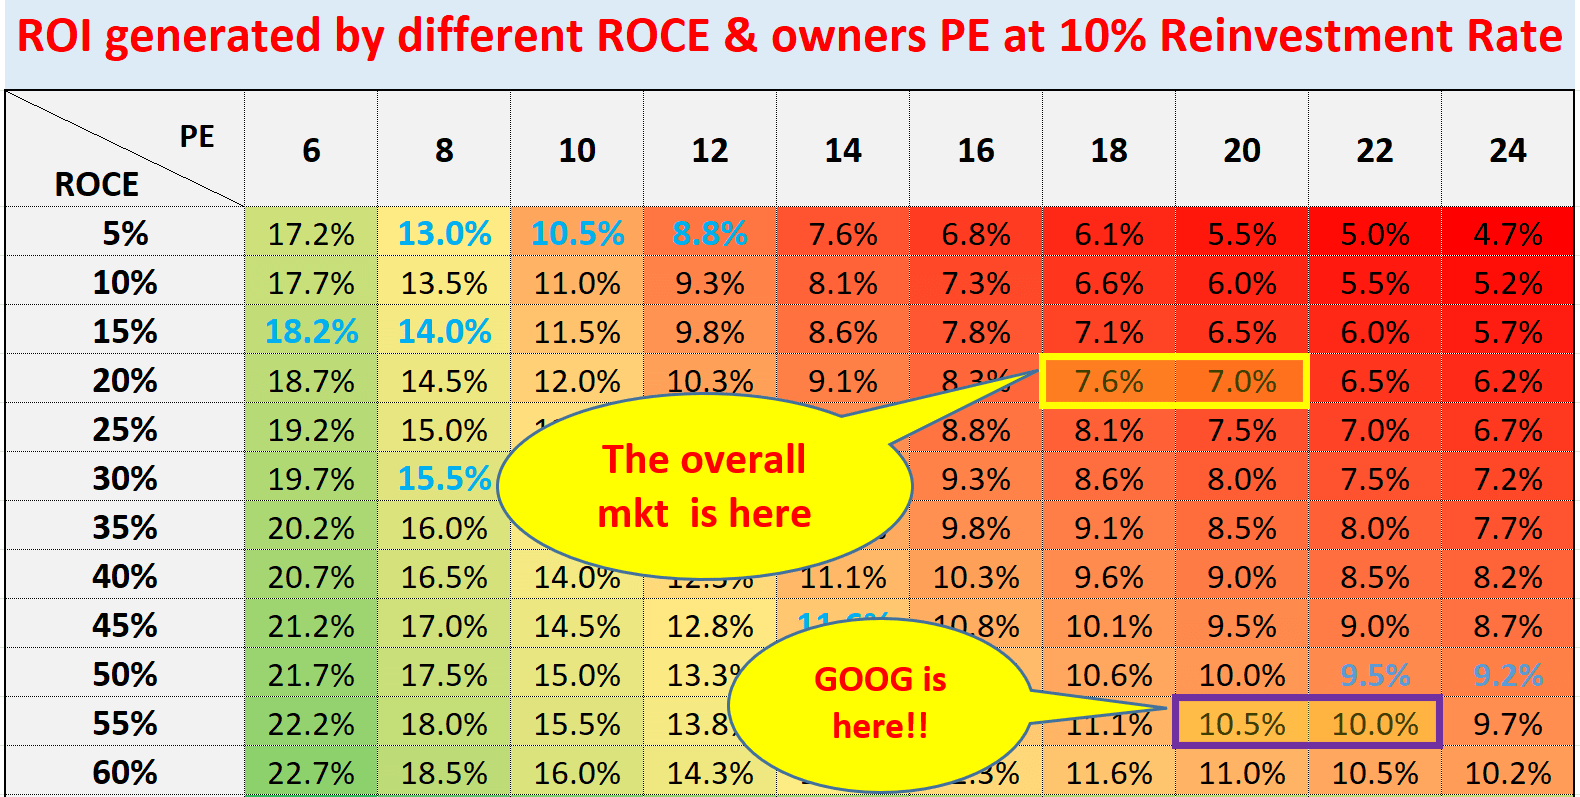
Chart 3: Let’s put it on the map
The next chart put it on our investing roadmap. It is what we use ourselves and for our marketplace service to pick our tactical holdings. As you can see, GOOG is projected to provide a double-digit annual return (“ROI”) in the range of 10.5% to about 11% assuming a 10% reinvestment rate. While the overall market is projected to return about 7% to 7.6% only. The building of this roadmap is detailed in our earlier article and our holdings based on this roadmap is shown at the end. In short,
- The long-term ROI for a business owner is simply the summation of two things: A) the price paid to buy the business and B) the long-term growth rate of the business. More specifically, part A is determined by the owner’s earning yield (“OEY”) when we purchased the business.
- Part B, the long-term growth rate, is governed by ROCE and the Reinvestment Rate. These are the two most important growth engines, and they mutually enhance each other.
- Longer-Term ROI = valuation + quality = OEY + Growth Rate = OEY + ROCE*Reinvestment Rate.
So, for GOOG, its perpetual growth rate is projected to be about 5.5% assuming 10% reinvestment rate (55% ROCE * 10% reinvestment rate = 5.5%). And at its current price level, the OEY is ~4.5%, leading to a double-digit total return.
Author
As such, I feel this projection for GOOG is on the conservative side because it assumes the same 10% reinvestment rates for both GOOG and the overall economy. In practice, GOOG reinvests more heavily than the overall economy and in more promising areas. GOOG invests heavily in areas like AI, Search, Cloud, Google Fiber, et al. GOOG started betting on AI years ago, and now the bet is paying off. As reported in its recent earnings, its AI technologies are already underpinning many of its popular products and services and make them even more powerful. Visual searches and Google Translate are two good examples. People around the world now conduct more than 8 billion visual searches per month. And the new monolingual approach enabled 24 new languages to Google Translate, spoken by 300 million people. And finally, Google fiber is planning its biggest expansion in years to push into five new states and territories according to a Reuters report.
Chart 4: but how about dividends?
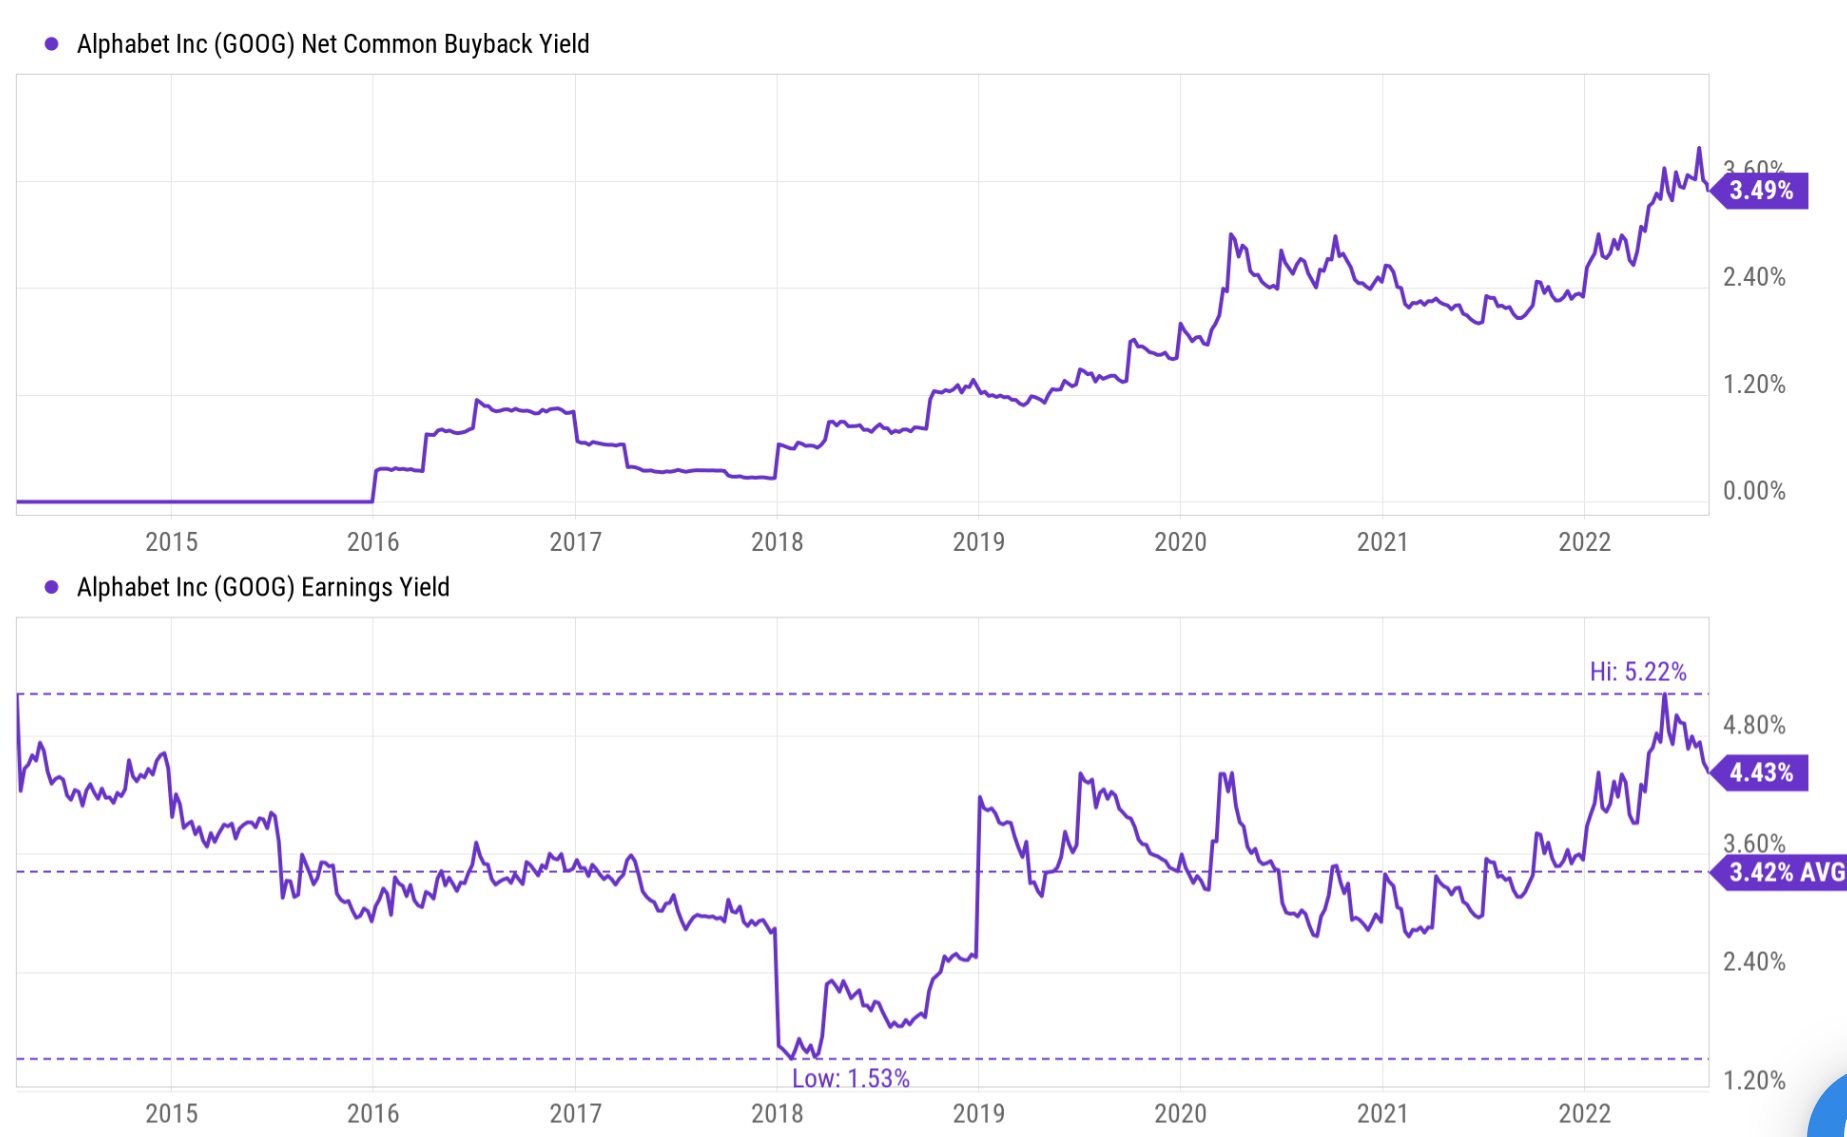
Finally, I often receive questions and comments regarding stocks such as GOOG that do not pay dividends. And I always suggest investors deemphasize dividends and focus more on total shareholder returns. The dividend is only ONE component of the shareholder returns, and other components may be more important in many cases. For example, as you can see from the chart below, GOOG consistently repurchases its shares and currently provides a 3.5% buyback yield (totally equivalent to a 3.5% dividend yield in my view). And its current earnings yield is about 4.4%, substantially higher than its historical average of 3.4%.
Seeking Alpha
Final thoughts and risks
Putting GOOG under a broader perspective can help to filter out many of the short-term noises. After comparing it to its FAAMG peers and other compounders that Buffett handpicked, it becomes very clear to me that GOOG provides far superior return potential to the overall market. It provides a balance total return potential in the double-digits consisting of ~5% of growth and ~5% of OEY.
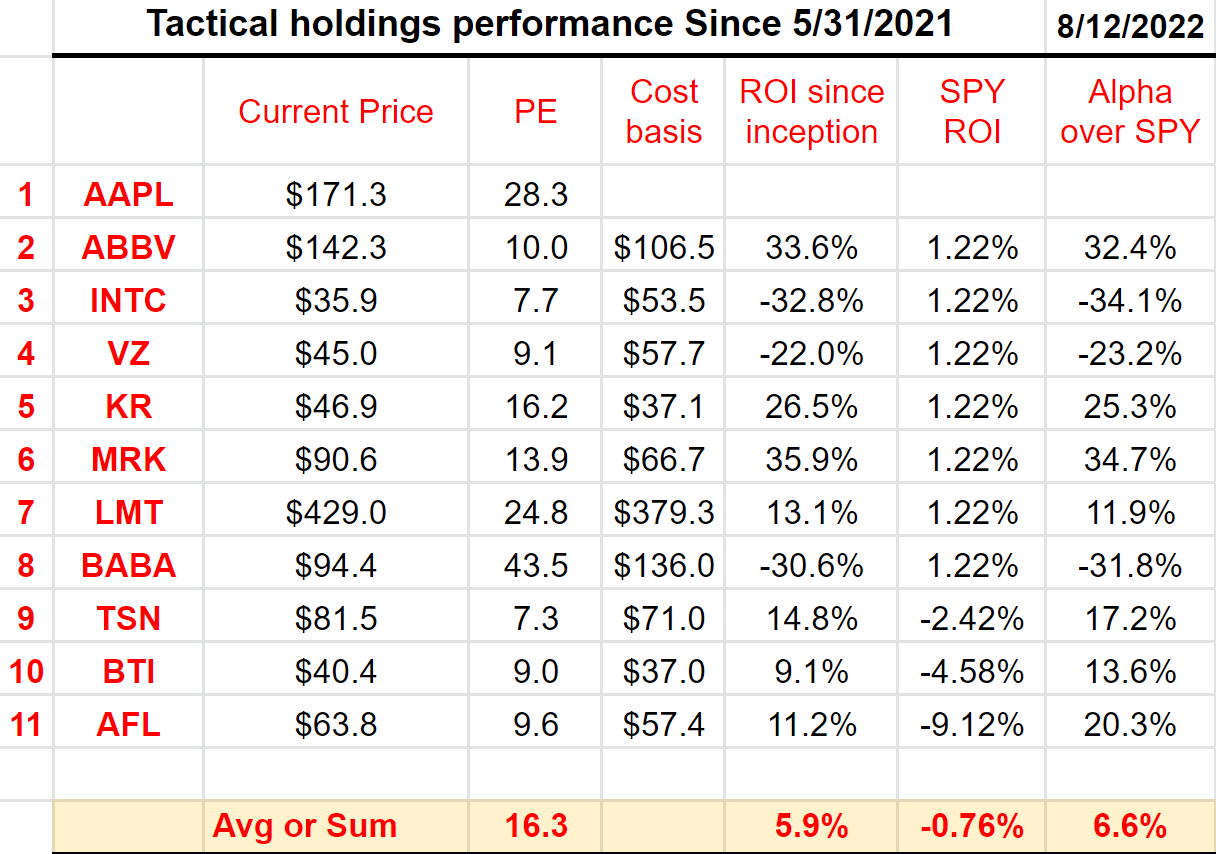
Finally, our tactical stock holdings picked by our roadmap are shown in the next chart. Using the date I first published it on 5/31/2021 as the inception date, its performance relative to the S&P 500 (represented by SPY) is shown in the second chart below. Note that AAPL has been a legacy holding and its returns are not included (otherwise, it will completely dominate the picture).
Now risks. Near-term risks, as mentioned above, include margin pressure, currency headwinds, TAC costs, and general inflation. In the longer term, GOOG has no lack of competition on multiple fronts. According to the same Pew Research Center report mentioned above, TikTok now also surpassed Facebook in popularity, with nearly 70 percent of respondents saying they have used the platform. TikTok directly competes with Google’s YouTube platform. Its other key growth engine, Google Cloud, is in direct competition with Azure and AWS. As of Q1 of 2022, Google cloud’s market share (8%) is behind both AWS (33%) and Azure (21%).
Author

Author
Be the first to comment