

sdominick/E+ via Getty Images
Gilead Sciences (NASDAQ:GILD) is probably best characterized as the ugly duckling among major U.S. pharma companies, when looking at its recent share price performance (or lack thereof). The firm, with its current market cap of $76 billion and enterprise value of $96 billion, certainly cannot be compared to broadly diversified pharma behemoths, such as Johnson & Johnson (JNJ), or Bristol-Myers Squibb (BMY), and also lacks current blockbusters such as Merck (MRK) with its checkpoint inhibitor Keytruda (pembrolizumab). Somehow, I view Gilead’s stock as one that has fallen victim to the company’s previous success, considering the blockbuster Hepatitis C virus therapies Sovaldi (sofosbuvir) and Harvoni (combination of ledipasvir and sofosbuvir), which propelled the company’s revenues to an all-time high of almost $33 billion in 2015 (Figure 1). In 2021, the company generated $27 billion in revenues and accordingly is much cheaper at a current price-to-sales ratio of 2.8, than it was in 2013 and 2015, at ratios of 12.3 and 4.1, respectively. So you might ask – what’s not to like?
Figure 1: Gilead’s historical net revenues (own work, based on the company’s 2010 to 2021 10-Ks)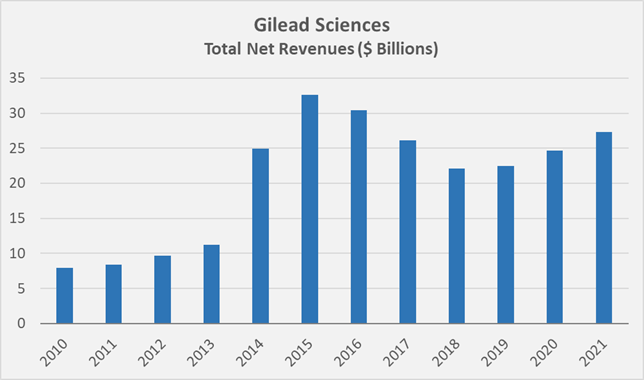
Gilead – Rightly The Ugly Duckling Among Big Pharma Companies?
Compared to today, the expectations placed on Gilead in 2013, when the success of sofosbuvir became widely known, were understandably much higher. For 2022, management actually expects revenues to decline by roughly 12% YoY to $23.8 to 24.3 billion. Notably, Gilead still expects $2 billion in revenues from its COVID-19 treatment Veklury (remdesivir), which are included in the aforementioned figure. Personally, I very much appreciate Gilead’s success with Veklury, as the company has once again demonstrated its ability to react quickly and bring a (previously developed) drug to market very successfully. In the second quarter of 2020, when SARS-CoV2 had only been known for a few months, investors became increasingly optimistic about Gilead, but sentiment deteriorated quickly, even though the company was able to market Veklury well above expectations, as it later turned out (see, e.g., FY2020 earnings release).
While the expected double-digit decline sounds concerning, it should be noted that excluding Veklury, the company actually expects revenue growth of 2 to 4% YoY. However, shares are trading well below recent levels and could retest the late-2020 low of $57 as investors increasingly view Gilead’s acquisitions of Kite and Forty Seven as failures. This is somewhat comprehensible when comparing the $12 billion price tag for Kite, which was acquired in 2017, to Yescarta’s and Tecartus’ combined 2021 revenues of 870 million. Investor sentiment was further impacted by the recent partial clinical hold, put on a Phase 3 trial of magrolimab, the company’s promising anti-CD47 cancer therapy. Magrolimab was developed by Forty Seven, which was acquired by Gilead in early 2020 for almost $5 billion.
Striking a more positive tone, Trodelvy (sacituzumab-govitecan), while contributing only marginally to current revenues, is expected to peak at $2 to $3 billion. The drug has been approved a year ago for the treatment of metastatic triple-negative breast cancer in adults who have received two or more prior systemic therapies, with at least one of them for metastatic disease. The company obtained Trodelvy through its comparatively bold acquisition of Immunomedics for $21 billion in late 2020. Gilead’s success with its HIV therapeutic Biktarvy (combination of bictegravir, emtricitabine and tenofovirafenamide), which contributed more than $8 billion in revenues in 2021 on 19% year-over-year growth, is also a testament to the company’s continued ability to develop successful antiviral therapeutics.
Overall, Gilead seems to be disproportionately punished for its recent acquisitions and the company’s inability to date to gain a foothold in the oncology business. It should be remembered that the company’s new CEO, Daniel O’Day (the former COO of Roche’s pharma division), only joined Gilead in March 2019. Moreover, investors don’t seem to care much about the company’s unwavering ability to develop successful antiviral therapies.
The current price-to-sales ratio of 2.8 certainly confirms investors’ sentiment, as does the price-to-earnings ratio of just above 8. Gilead is certainly not an overly leveraged company at a net debt to EBITDA ratio of 1.4 and an equity ratio of 31%. As a consequence, also enterprise value-based ratios such as EV/EBITDA (around 6.6) suggest that the company is pretty cheap. From the perspective of a dividend investor, the shares appear extraordinarily cheap at a current yield of almost 5%, which is well above the long-term average of 1.9%. The current yield seems particularly compelling when also considering the dividend’s long-term compound annual growth rate (CAGR) of nearly 8%. Note, however, that dividend growth has been quite uninspiring since 2020 (see Figure 2).
Figure 2: Historical growth rate of Gilead Sciences’ dividend (own work, based on the company’s historical dividend payments)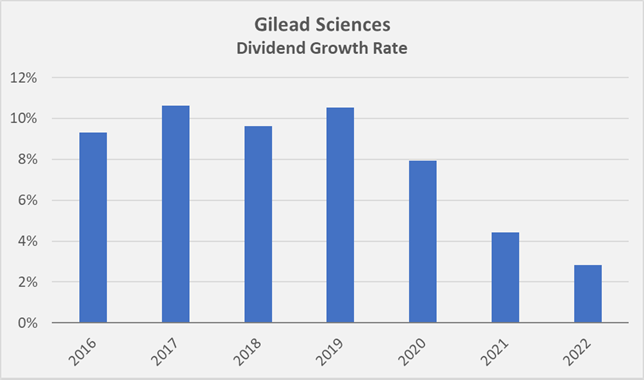
The dividend is certainly very safe, considering the payout ratio of less than 50% of normalized FCF. Normalized FCF is my own conservative estimate, which takes into account stock-based compensation expenses, impairment charges and normalized movements in working capital. For Gilead, I derived a normalized FCF of $8 billion. A discounted cashflow analysis based on this estimate, and an expected growth rate of 0% (!) over the next decade and 2% thereafter, yields a fair value of $70 per share, assuming a discount factor (cost of equity) of 10%. In my opinion, the current investor sentiment is best represented graphically (Figure 3). Today, in times of continued strong free cashflow productivity, the company is underappreciated due to uncertainties related to the future success of its cancer and HIV therapeutics, whereas it was one of Wall Street’s darlings in 2013 when the success of the HCV franchise became apparent. Gilead’s stock serves as a textbook example of the market’s behavior of valuing the future rather than the present.
Figure 3: Gilead’s historical normalized free cash flow (nFCF) and market capitalization, as observed in the month after the company announced each year’s earnings (own work, based on the company’s 2010 to 2021 10-Ks and corresponding share price data)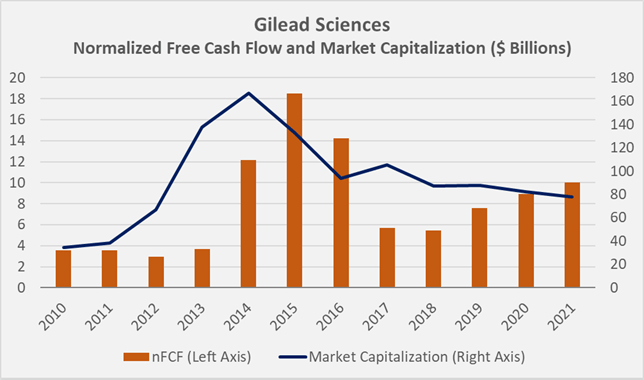
Besides the well covered dividend, the company returns cash to shareholders by repurchasing its own shares, more than offsetting dilution due to stock-based compensation expenses. This form of compensation is substantial, both in absolute terms ($635 million in 2021) and in relative terms, compared to, e.g., Merck and Bristol-Myers Squibb (Figure 4) and in light of Gilead’s M&A performance so far. Nevertheless, since 2010, Gilead has reduced its weighted average diluted shares outstanding from 1.75 billion to 1.26 billion, an average reduction of 2.8% per year. In total, the company has spent $62 billion on dividends and share repurchases since 2010, which compares very favorably to the $96 billion in normalized FCF generated over the same period.
Figure 4: Stock-based compensation (SBC) expenses at Gilead, Merck and Bristol-Myers Squibb, compared to each company’s normalized free cash flow (nFCF) and 2019 to 2021 average revenues (own work, based on each company’s 2019 to 2021 10-Ks)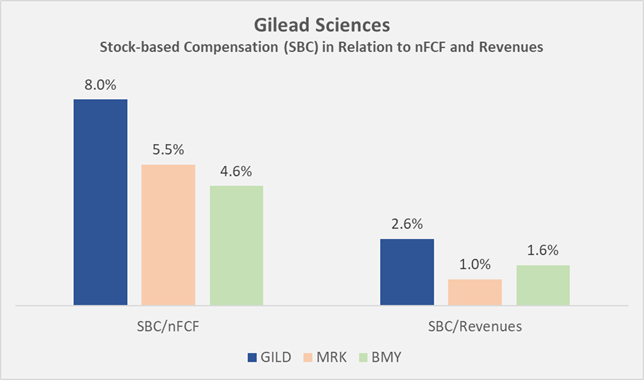
The quality of Gilead’s balance sheet, even after the acquisition of Immunomedics, and taking into account the generous return of cash to shareholders, is far from worrisome and is in fact very robust. The ratio of gross debt to normalized FCF is very manageable at a factor of 3, suggesting that it would take the company three years to pay off all of its debt if it skipped the dividend and buybacks, but leaving its current $6.5 billion of cash and marketable securities untouched. However, I see no reason why Gilead should reduce debt given the low interest rate environment and the maturity profile of the company’s exclusively fixed-rate debt (Figure 5). In this context, Bristol-Myers Squibb’s debt structure appears somewhat weaker, when comparing my expectation of the company’s normalized FCF of $13 billion to the upcoming maturities. Nevertheless, it should not be forgotten that BMY’s very strong free cashflow is expected to remain very solid in the coming years, thanks to Eliquis (apixaban) and Revlimid (lenalidomide), which the company obtained in 2019 through the acquisition of Celegene. Merck’s long-term debt is similarly well distributed over the coming decades as Gilead’s debt. Considering Merck’s success with Keytruda and the still acceptable leverage (gross debt to normalized FCF of 4 years), it seems plausible – as discussed in my recent note – that the company will direct increasing amounts of cash from operations towards dividends and share buybacks. Acquisitions are also expected, but rather in the distant future, as Keytruda’s loss-of-exclusivity in 2028 is still a long way off.
Figure 5: Maturity profiles of Gilead’s, Merck’s and Bristol-Myers Squibb’s long-term debt (own work, based on each company’s 2021 10-K)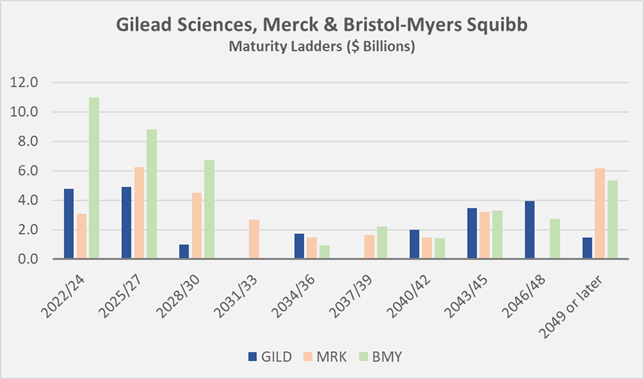
Also, when looking at Gilead’s interest coverage ratio in terms of normalized FCF (Figure 6) and other financial stability metrics (Table 1), our supposedly ugly duckling compares favorably to much larger peers BMY and MRK. Of note, Gilead’s goodwill, compared to its shareholders’ equity, is considerably smaller than BMY’s and MRK’s. I don’t expect this to change much in the near future, as promising takeover targets (especially larger ones) are becoming increasingly rare, with BMY and AbbVie (ABBV), for example, buying up Celegene and Allergan, respectively, in rather bold deals. Arguably, Biogen (BIIB) could be a digestible takeover target for Gilead, at a market cap of currently $30 billion. Personally, I am not optimistic about BIIB, especially given the well-documented failure of its Alzheimer’s treatment Aduhelm (aducanumab), so I would not like to see management pursue such an acquisition.
Figure 6: Gilead’s historical interest coverage ratio in terms of normalized free cash flow (nFCF) (own work, based on the company’s 2010 to 2021 10-Ks and own estimates)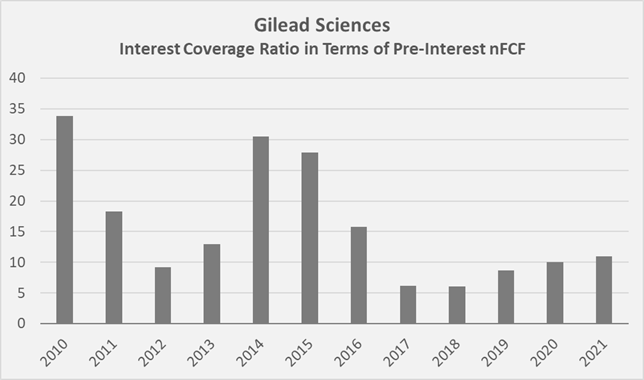
Table 1: An analysis of Gilead’s, Merck’s and Bristol-Myers Squibb’s financial stability, in particular taking each company’s normalized free cash flow (nFCF) into account (own work, based on each company’s 2021 10-K and own estimates)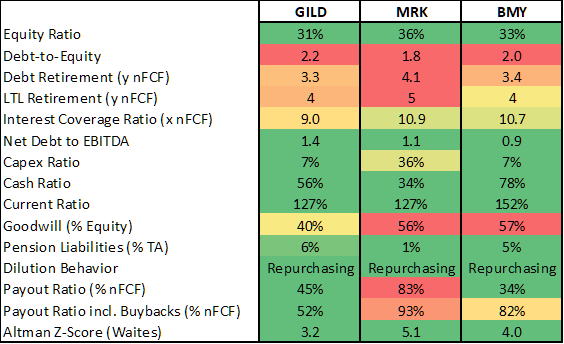
In terms of growth, Gilead is currently underappreciated in my opinion, as outlined above, but also considering the company’s 10-year normalized FCF CAGR of roughly 10%. BMY has performed even stronger in this regard, but this is to a significant extent attributed to the acquired cashflows from Celegene. Merck actually more or less treaded water with a CAGR of only 3%. Clearly, past performance is not a reliable indicator of future performance, but nonetheless, I believe it has a certain merit in gauging a company’s long-term performance.
Another reason for the currently pretty depressed share price is – in my opinion – attributable to Gilead’s decline in gross margin from 81.2% in 2020 to 75.6% in 2021, largely due to a $1.25 billion legal settlement charge in Q4. However, I want to emphasize that Gilead is still on par with Merck and Bristol-Myers, for which I have obtained 2021 gross margins of 72% and 79%, respectively. Cashflow conversion is particularly strong at Gilead (90% versus 50% and 75% for MRK and BMY, respectively) and this is also the reason for the company’s comparatively strong cash return on invested capital (CROIC) of 15% (Figure 7), on par with that of BMY, and markedly stronger than Merck’s current CROIC of only 11%. If there is one thing not to like about Gilead in this context, it is the comparatively weak cash conversion cycle of 110 days, while BMY seems much more efficient at only 42 days. Gilead could probably benefit from stretching its payment terms, as payables are typically settled after only about 40 days, whereas Bristol-Myers is much slower, with over 100 days payables outstanding.
Figure 7: Gilead’s historical cash return on invested capital, which is based on normalized free cash flow (nFCF) (own work, based on the company’s 2010 to 2021 10-Ks and own estimates)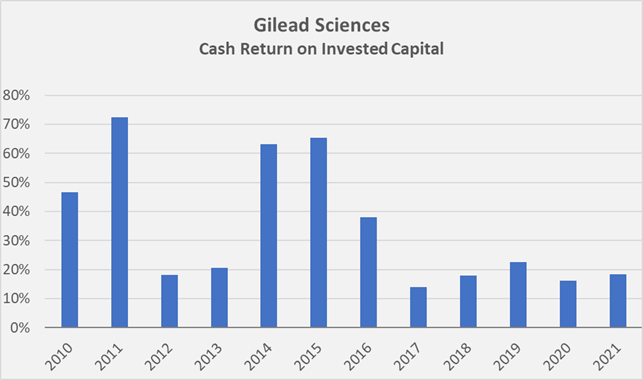
Quick Investor Takeaway
The broader market clearly doesn’t like Gilead, and hasn’t for some time. To some extent, this is due to the company’s resounding success with its hepatitis C therapeutics Sovaldi and Harvoni, which has yet to be repeated. The fact that Gilead continues to demonstrate its ability to bring to market well-selling antiviral therapeutics such as Biktarvy and Veklury goes largely unnoticed by the market, in my opinion. Certainly, recent acquisitions appear to have been largely unsuccessful, but I would give Gilead the benefit of the doubt considering the company’s long-term track record, still relatively new CEO, very respectable profitability that is in line with its peers, and conservative balance sheet. It is rare for a company that distributes substantial cash to its shareholders to do so solely out of its own pocket. In fact, Gilead has spent only two-thirds of its normalized free cashflow generated since 2010 on buybacks and dividends, while other companies have sacrificed their shareholders’ equity for very expensive and untimely buybacks (Home Depot and Starbucks, I am looking at you!).
At $59, I think Gilead is a very compelling value, also from a dividend stock perspective, which is underscored by the current yield of almost 5%. Some investors view Gilead as a yield trap, but its past and current performance and strong free cashflow tell a different story. Sure – the company’s near-term outlook is uninspiring, as the chart below from FAST Graphs also shows, but in my opinion the uncertainties are well priced in at the current share price.
Figure 8: FAST Graphs chart for GILD, based on adjusted operating earnings (obtained with permission from FAST Graphs)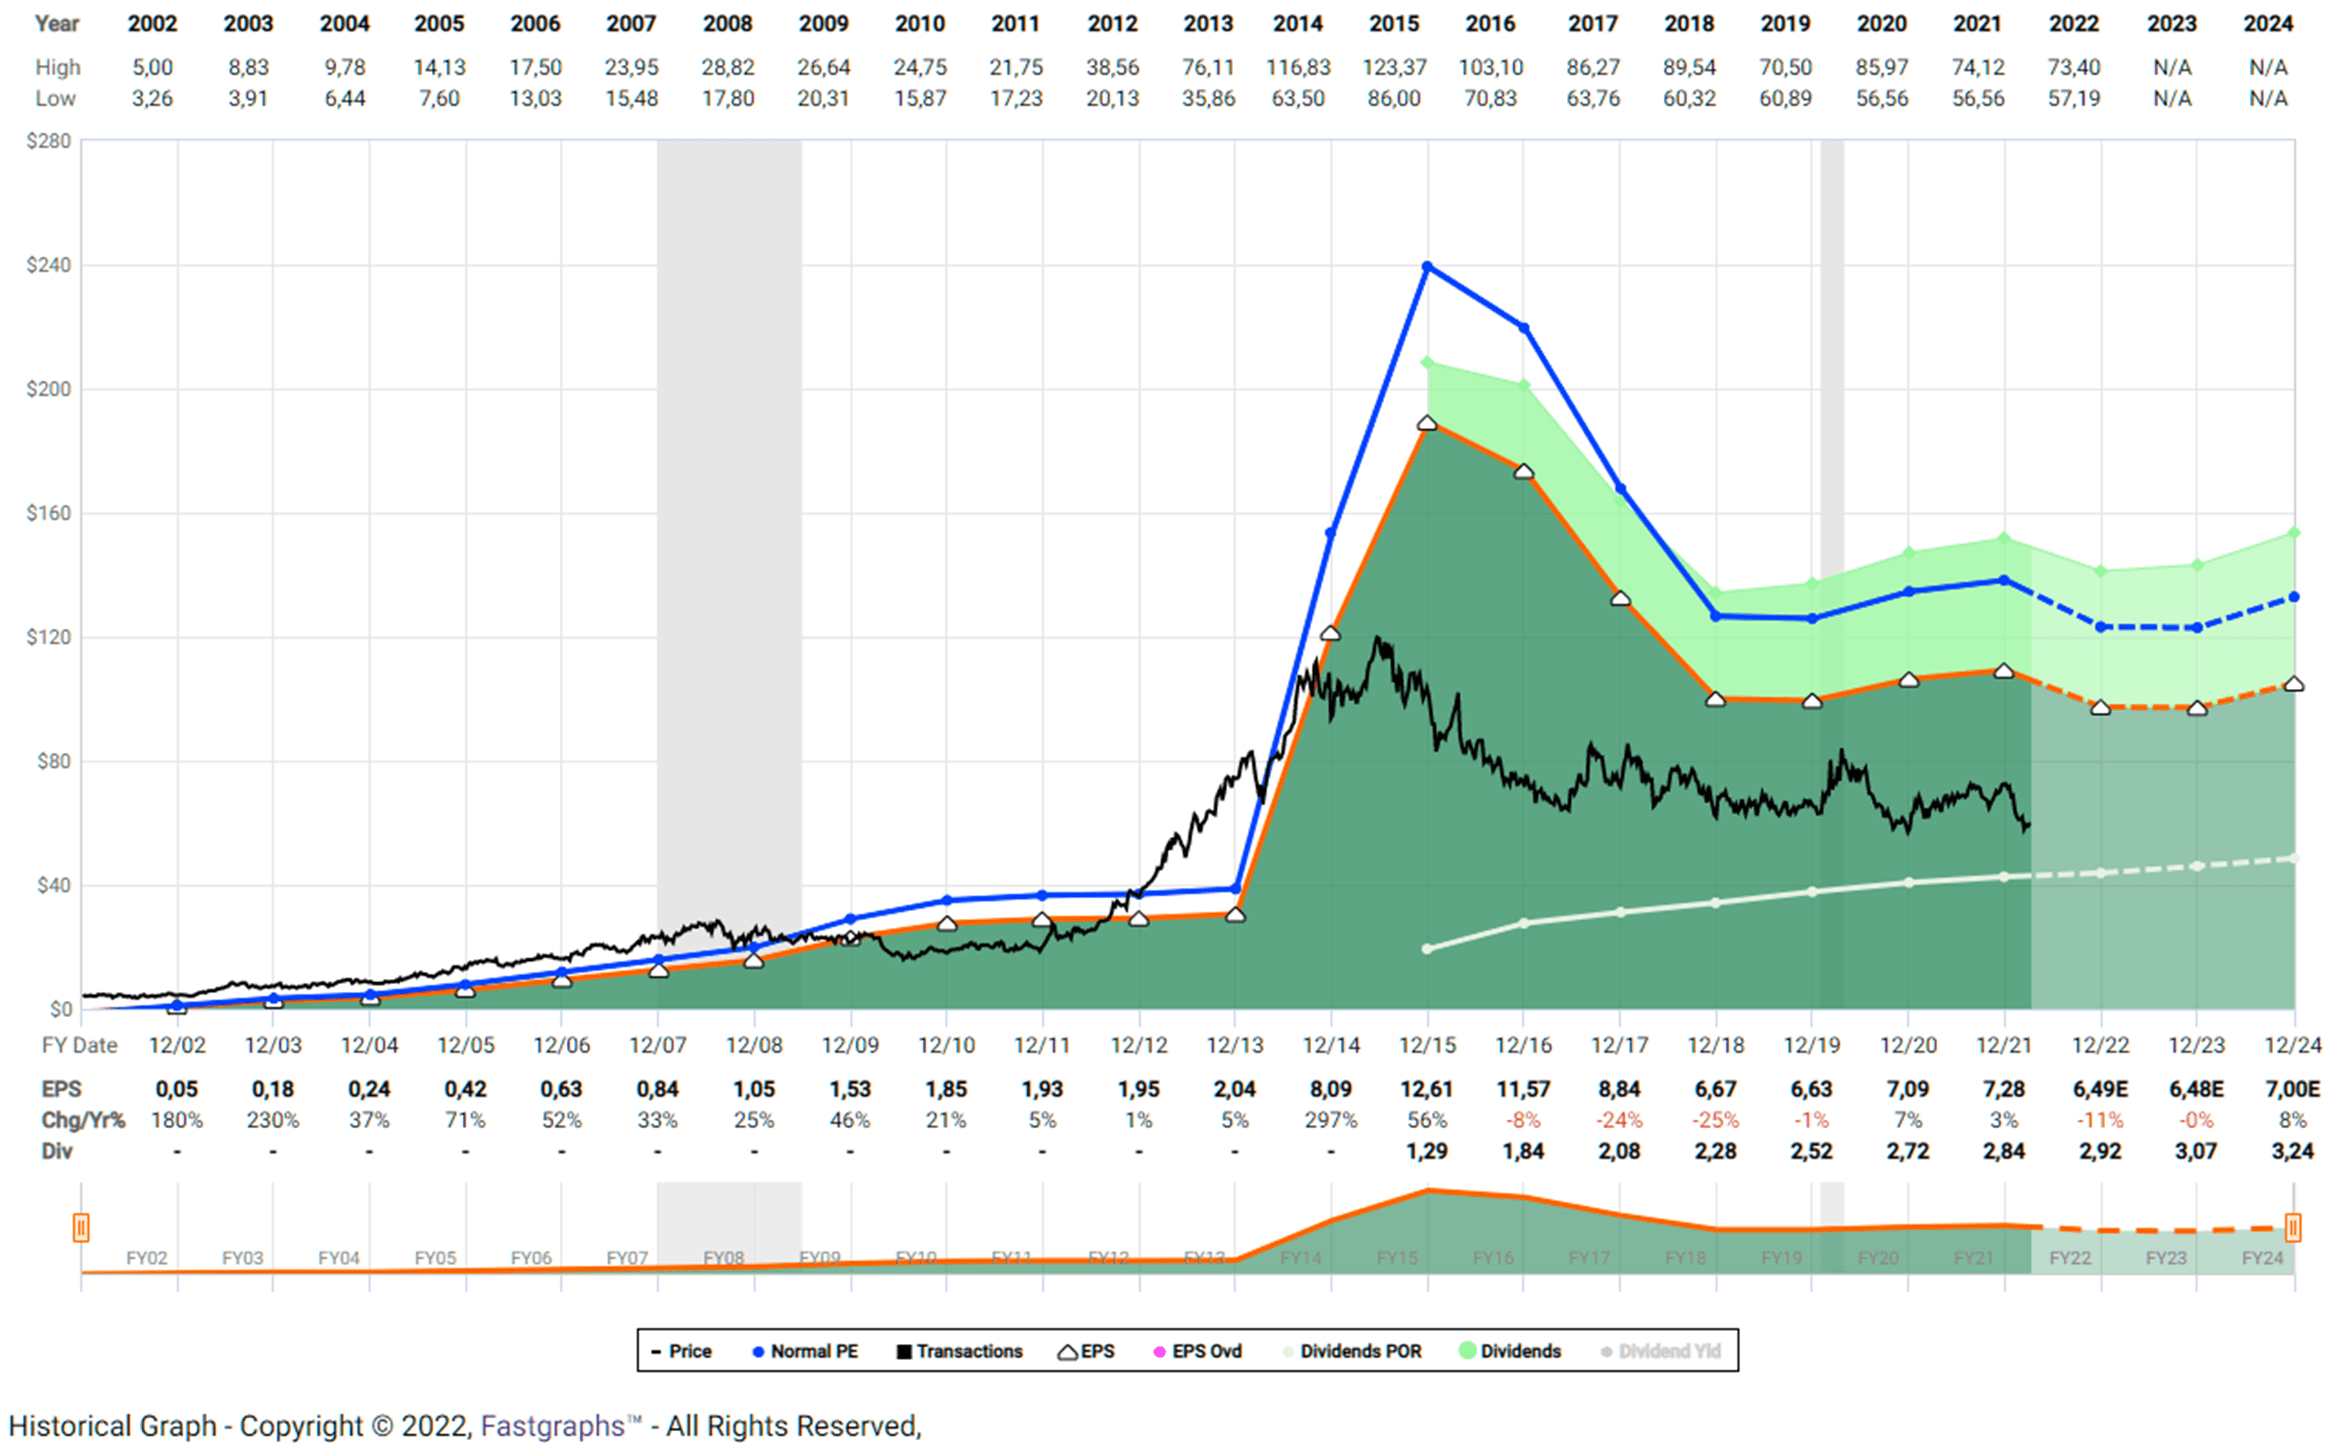
Be the first to comment