


francescoch
Thesis
I believe Moody’s Corporation (NYSE:MCO) is a long-term compounder with strong fundamentals. I theorize that the macro-economic short term trends into 2023 will place pressure on the fundamentals of the business ultimately effecting the stock price negatively. I value the fair value of MCO stock price with three Discounted Cash Flow (DCF) scenarios between approximately $211 and $346 based on a mixture of analyst estimates and historical descriptive analytics. The large volume of insider selling over the past two years is concerning and does not create comfort for investors looking to establish positions. I observe that multiple high performing investors with similar fundamentally oriented investment styles maintain large positions in MCO though their purchase prices were much more reasonable as assessed by different multiples. My assessment concludes that there are negative looming aspects for currently investing into MCO and that a fair price with a margin of safety may present itself in the future, but the price is currently a bit in excess.
Introduction
Mr. Warren Buffett famously says in his Berkshire Hathaway’s 1989 Letter to Shareholders, “It’s far better to buy a wonderful company at a fair price than a fair company at a wonderful price.”
MCO is a well-covered and notable wonderful company in the financial sector. They are a strong firm and undoubtedly have a superb competitive advantage in their current competitive landscape. MCO has established itself as a leader in the perpetual field of rating debt and providing analytical services. They are famous for having Berkshire Hathaway and other renowned investment firms like Akre Capital Management retaining large holdings with superb outcomes over the past two decades since they began trading in October of 2000. MCO is also infamous for their participation in the Global Financial Crisis for mis-rating assets and their stock price suffered accordingly with the negative sentiment.
When I attempt to conceptualize Mr. Buffet’s quote, I consider it as two variables that must be met for my own implementation prior to investing. Is it a wonderful company AND is it currently a fair price for my investment style? MCO is undoubtedly a wonderful company for shareholders and already has extensive literature supporting its competitive advantage. The focus of this article is to attempt to determine if it is currently at or near a fair price based on a multitude of factors and trends. When attempting to value Moody’s Corporation, I explore information from the following items and synthesize my perspective to determine where I would be willing to start establishing a position factoring in a margin of safety.
- Macro-economic trends
- Descriptive analytics & discounted cash flow valuation
- Insider trading
- Historical multiples
This article is not a complete portrayal of each and every variable affecting MCO as a firm. The intent is to highlight important aspects and derive assumptions from those in a proportional and relevant manner.
Macro-Economic Trends
Macro-economic trends are extremely important to MCO since they make a large percentage of their revenue on the rating of debt for global organizations (Figure 1). The global organizations range from corporate firms, governments, and specific projects among others. MCO Q1 report shows that approximately 54% of their quarterly revenue is from investment services of which approximately 33.7% is U.S. sourced. This emphasizes a large need to capture the market trends of debt issuance in order to continue their growth.
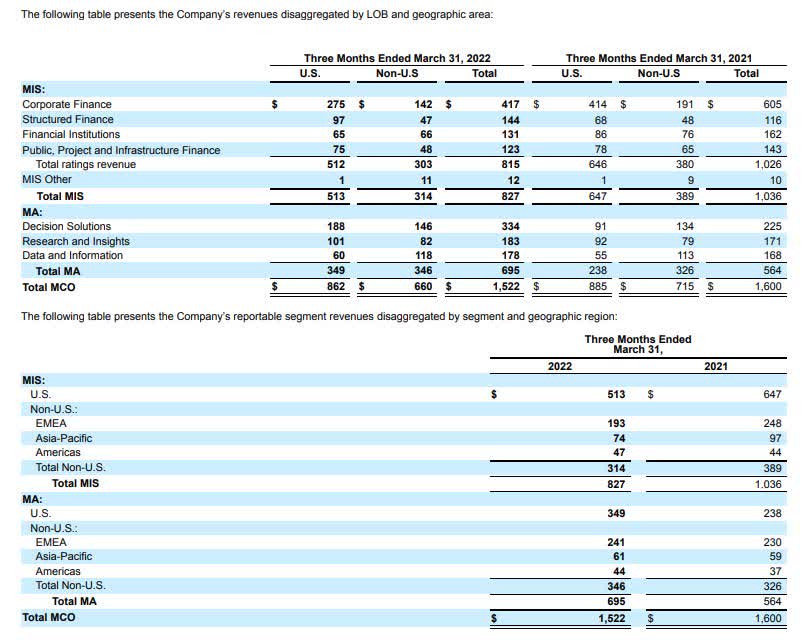
Figure 1. Q1 revenue by segment and geographic region (MCO investor relations)
The issuance of debt by U.S. organizations and their need to be rated by MCO and its competitors is historically correlated with Moody’s revenue (Figure 1, blue line, R2 = 0.705, P < 0.0001). What this means is that there is a historical trend for higher debt issuance typically meaning that there is higher revenue for MCO. MCO does currently have multiple sources of recurring revenue and those are being strengthened by MCO to create a more stable total revenue segment. A reliance on a single source of revenue is not ideal for any business, and that MCO strategically maneuvers well to diversify their income segments though debt issuance is still fairly significant.
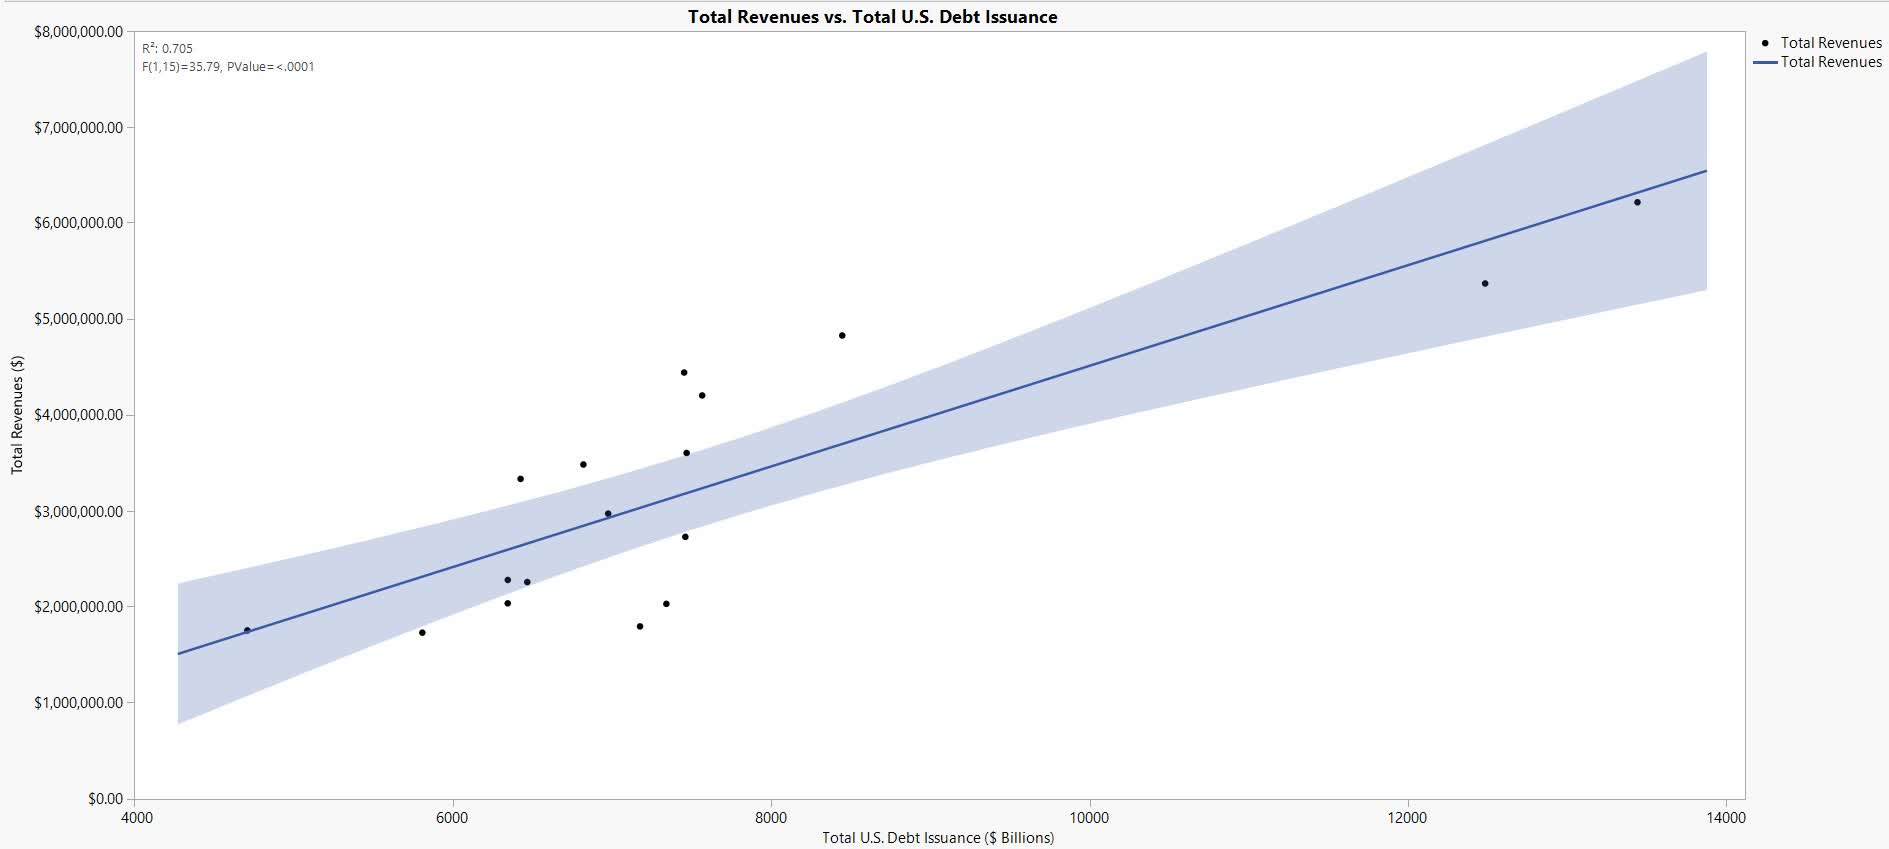
Figure 2. MCO revenue vs. total U.S. debt issuance (Author)
Equity issuance including IPOs should also be considered because this equates to more organizations that will likely augment their corporate structure with debt issuance in the future. This logically leads to exploratory analysis of the debt and equity historical trends to potentially forecast short term sentiment in issuance.
Debt and equity issuance into public markets shows a generally growing annualized trend from 1996 to 2021 (Figure 3). Debt issuance appears to grow more consistently compared to equity issuance and is a substantially larger market which is beneficial for rating agencies. The data also shows how each year varies in relation to the trend line. The year 2020 and 2021 appear to vary higher than the trend which could be of significance moving into the future.
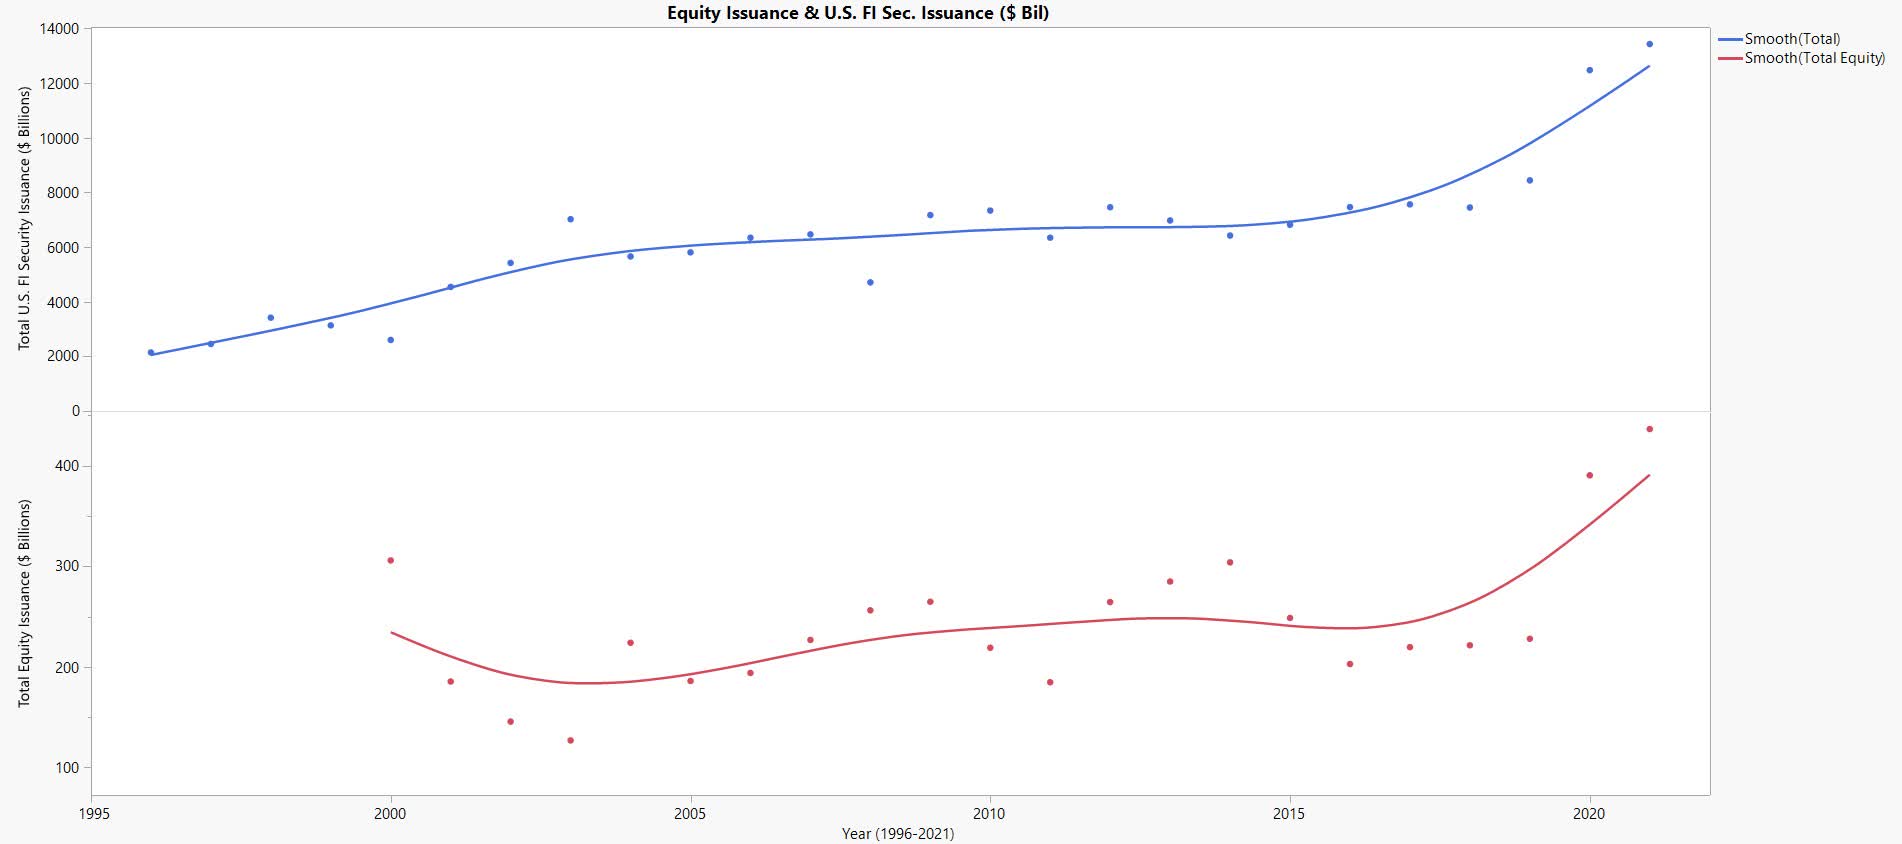
Figure 3. Annual trends of U.S. debt and equity issuance (Author)
When observing a monthly trend between 2020 and July 2022, the total U.S. debt issuance and U.S. corporate issuance have both been on a monthly decrease since their peaks (Figure 4). This may suggest an outcome of more conservative debt issuance in the U.S. moving forward into 2023 which could affect MCO revenue if the trend continues.
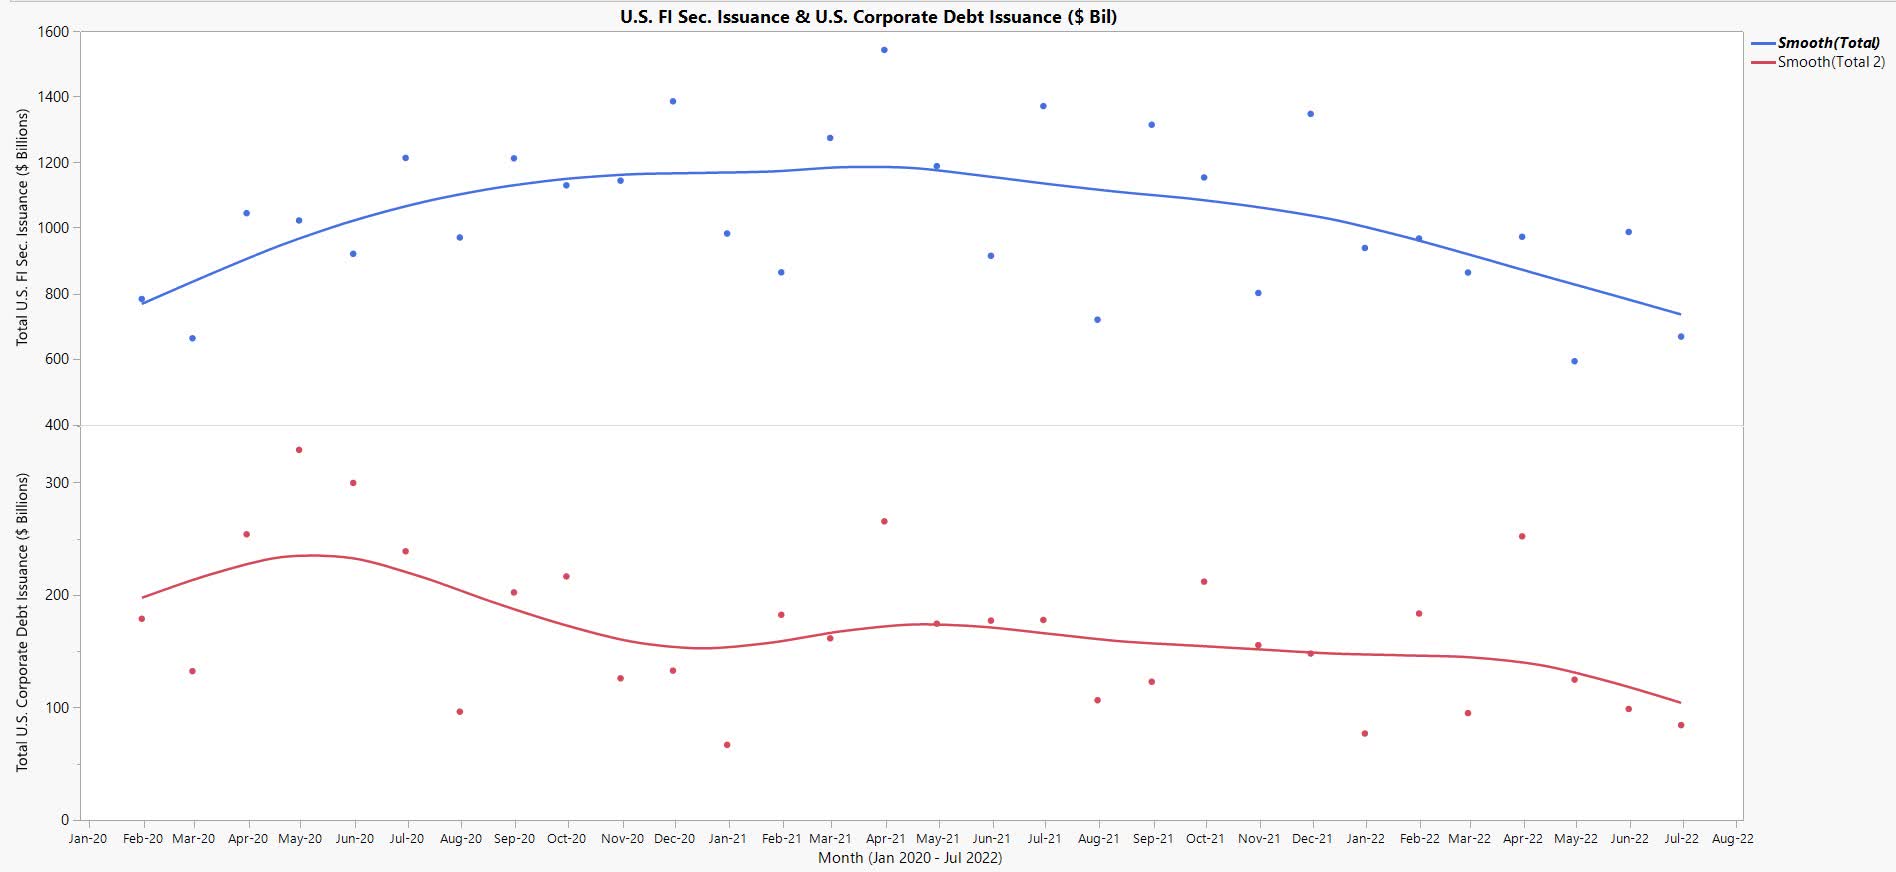
Figure 4. Monthly trend of U.S. total and corporate debt issuance from 2020 to present (Author)
As mentioned, equity issuance including IPOs should also be considered because this equates to more organizations that will likely augment their corporate structure with debt issuance in the future. This logically leads to exploratory analysis of the equity historical trends. Total equity issuance and IPOs have been declining since their peaks in 2021, which, augmented with an increasing Volatility index (VIX), shows a trend of recent fearful sentiment and less issuance of equity into public markets (Figure 5).
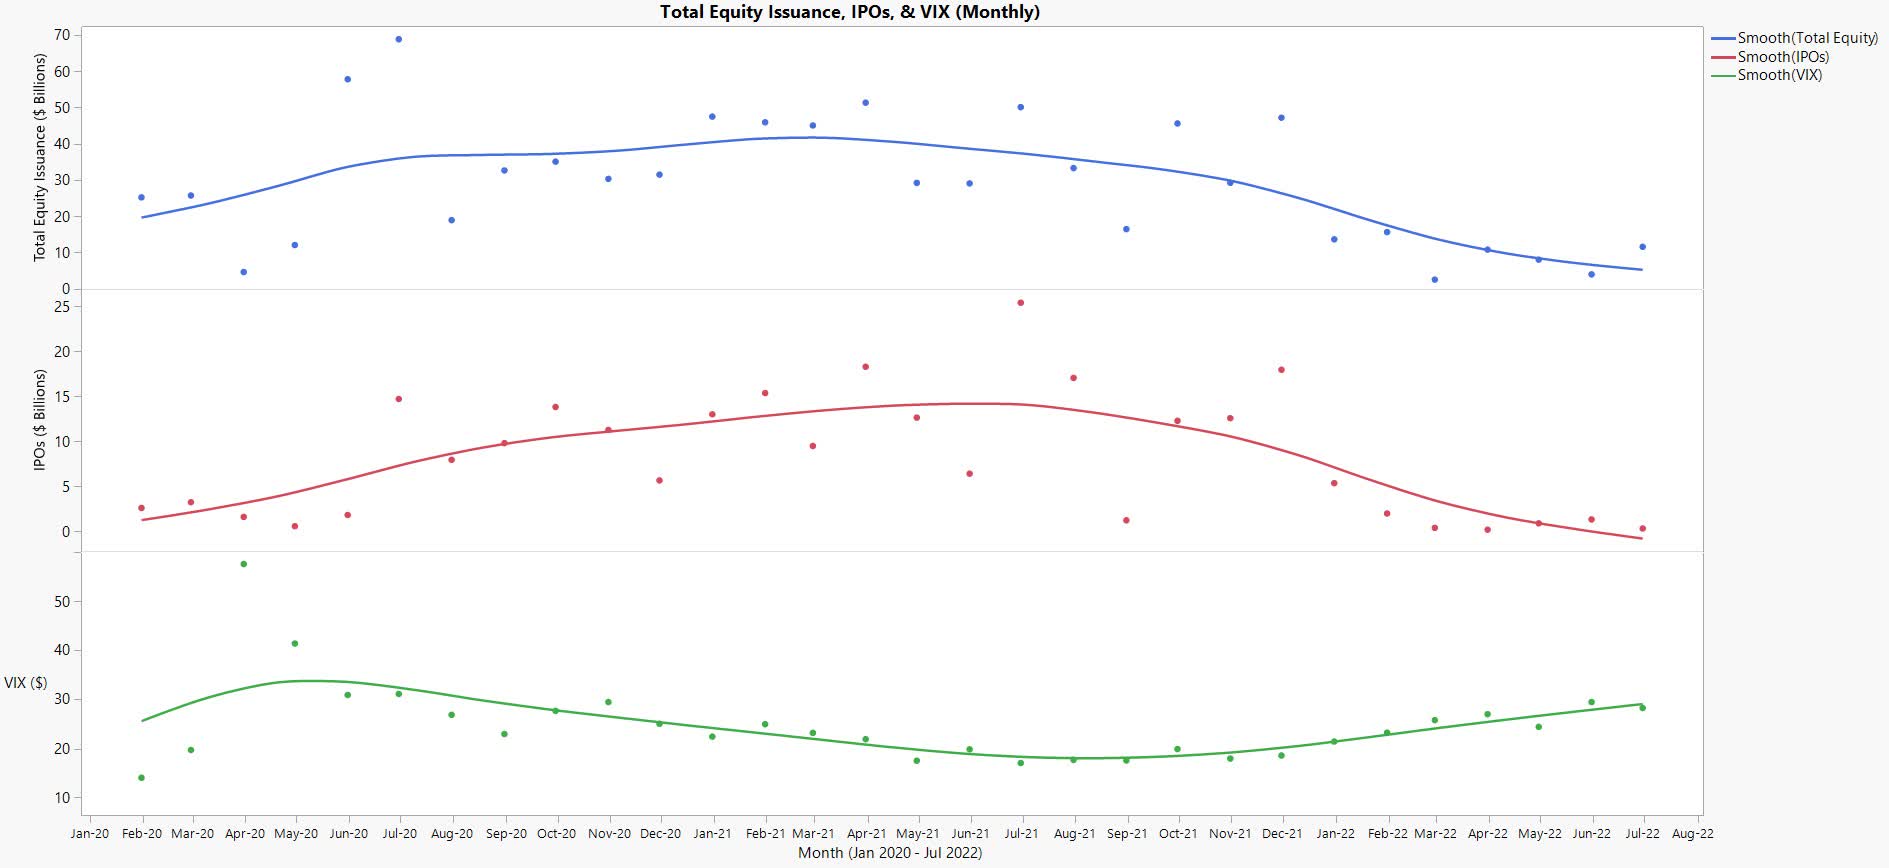
Figure 5. Total equity issuance, IPOs, & VIX (Author)
These trends aren’t groundbreaking news since they are well discussed in current macro analysis, but they are nonetheless significant for investors. MCO is already predicting flat revenue growth for 2022, a decrease in earnings, and stable free cash flow (FCF) according to their 1Q22 investor presentation (Figure 6).
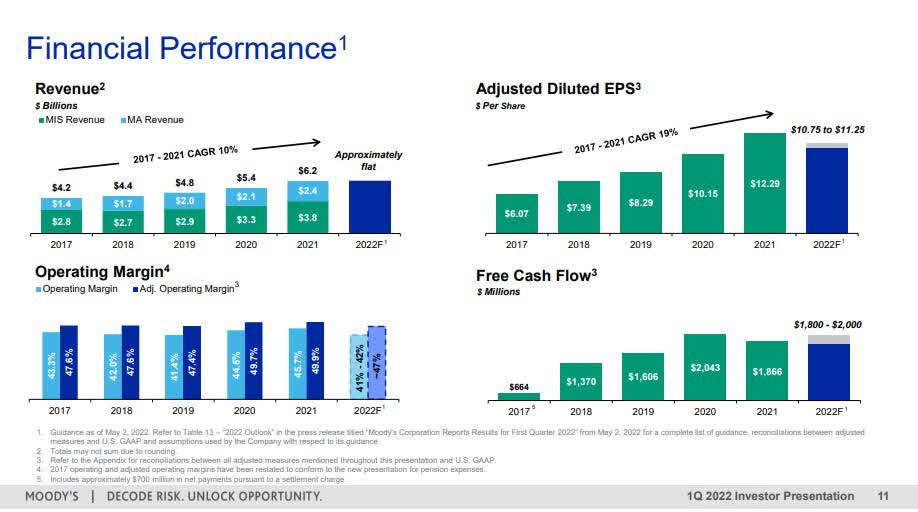
Figure 6. 1Q Financial Performance (MCO investor relations)
I interpret these recent trends, while detrimental, as possibly being already priced into MCO’s stock price. I do also consider that more negative forecasted news in upcoming earnings through 2022 would be a significant pressure on the stock price. There is no way to truly determine if and when the trend will continue on an upward trajectory but historical precedence would suggest that it will eventually stabilize and continue upwards.
The issuance data was gathered from the Securities Industry and Financial Markets Association (SIFMA) and recompiled into relevant perspective aligning with MCO analysis.
Descriptive Analytics & Valuation
Descriptive Analytics
The descriptive analytics are going to be used to derive inputs for the valuation model. The free cash flow and revenue can be utilized to create a discounted cash flow model for estimating the fair value of the firm.
The distribution of quarterly FCF margins since 2010 shows a strong performance and a small volatility spread (Figure 7). The mean and median are approximately equal representing a normal distribution. The median FCF margin is 31.225% and there is a 95% confidence interval range for the mean between 29.1% and 33.4%. This FCF margin distribution represents a very stable metric and it’s important to note that one outlier was discarded due to it being extreme.
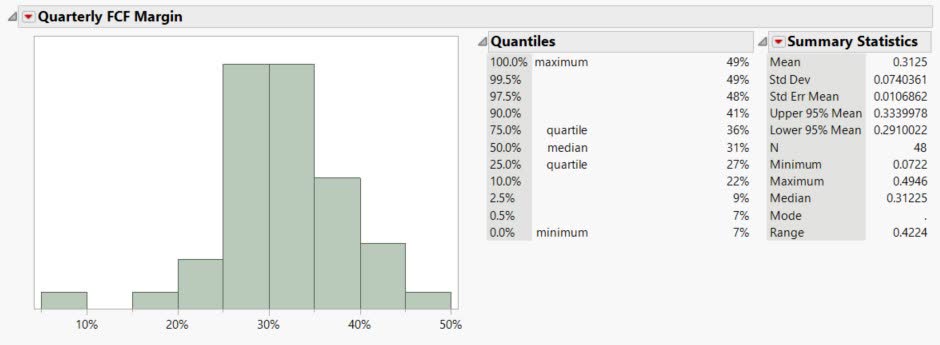
Figure 7. Quarterly FCF margins frequency distribution (Author)
The annualized revenue growth distribution has a left skew due to a negative outlier (Figure 8). The median value of 10.89% shows a consistent revenue growth since 2005 with a 95% confidence interval for the mean between 3.19% and 13.21% representing a much wider range on the historical performance compared to the FCF margins. This upper and lower range signify less confidence in the revenue performance of MCO based on their historical annual trends.
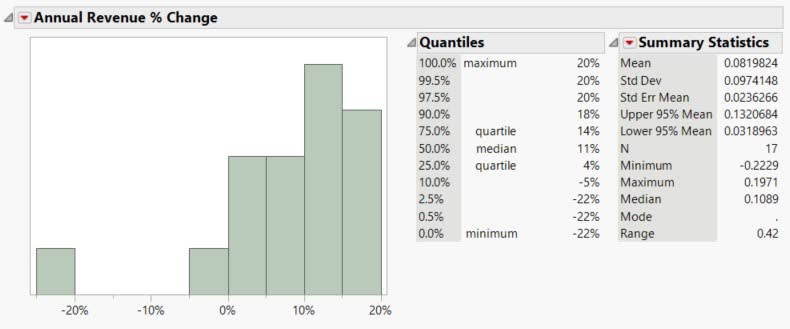
Figure 8. Annual revenue growth (%) (Author)
Valuation
The valuation model uses three DCF models based on the median, the lower 95% confidence interval and the higher 95% confidence interval. This can be interpreted as, if MCO performs in the range of their historical metrics, then their current value can be determined across the ranges depending on investor expectations. The reason I am choosing to calculate a range is to provide perspective for investors to apply their own risk into multiple scenarios, aiding in their purchase price. All scenarios utilize analyst estimates as acquired from TIKR terminal through 2025. All scenarios are discounted at an 8% WACC according to Finbox and factored in a 3% terminal growth rate which is realistically on the conservative side considering the business model. The 8% WACC is utilized as the discount rate because it factors in a premium for the consistency and competitive advantage for MCO. The outstanding shares and net debt were based on the 1Q report and would change if either value changes in the upcoming quarterly report. Analyst expectation changes would also significantly alter the models given that shorter-term inputs are weighed heavier than mid-term inputs.
DCF Scenario 1
Scenario 1 is a more statistical middle ground for analysis and utilizes the median revenue growth of 10.89% from 2026 to 2030 and the median FCF margin of 31.23% throughout (Figure 9). The output result is a scenario value of $305.47.
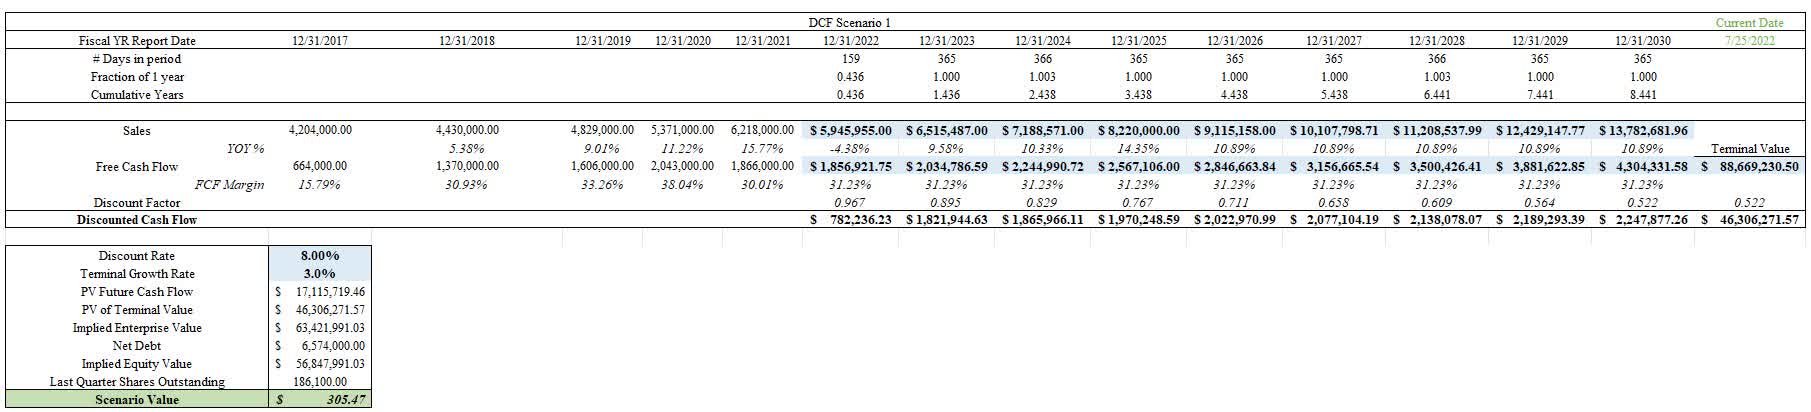
Figure 9. DCF 1 (Author)
DCF Scenario 2
Scenario 2 utilizes the top 95% confidence interval revenue growth of 14.35% from 2026 to 2030 and the top 95% confidence interval FCF margin of 33.4% throughout (Figure 10). The output result is a scenario value of $346.14. What this means is that if MCO performs exceptionally or optimistically, then this value may be more aligned with the firm’s value.
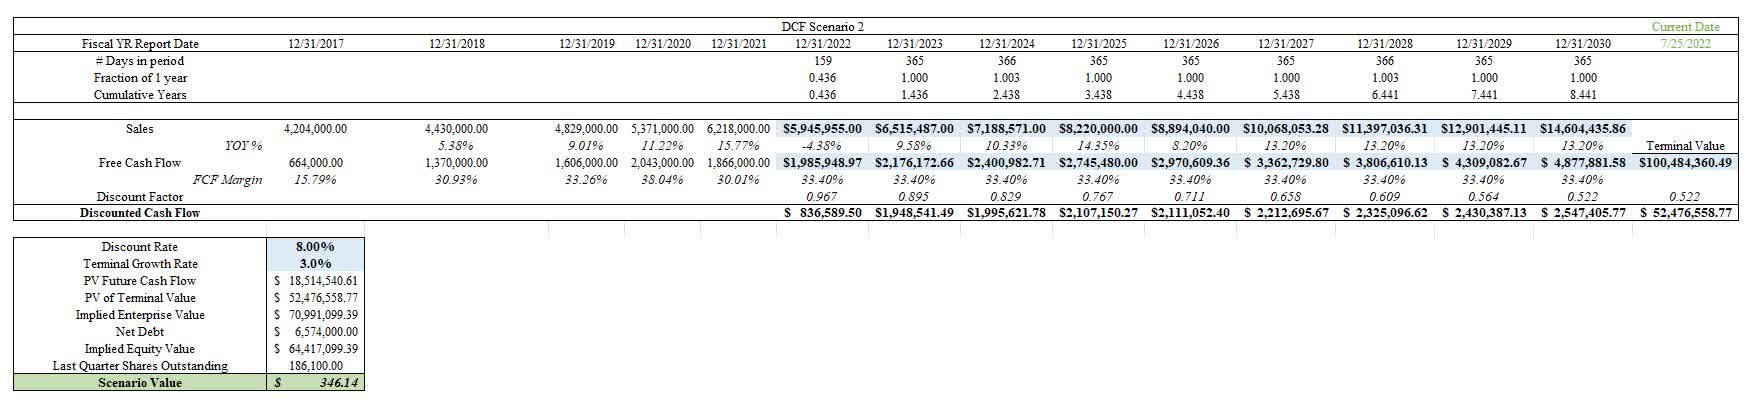
Figure 10. DCF 2 (Author)
DCF Scenario 3
Scenario 3 utilizes the bottom 95% confidence interval revenue growth of 8.2% from 2026 to 2030 and the bottom 95% confidence interval FCF margin of 29.1% throughout (Figure 11). The output result is a scenario value of $211.86. What this means is that if MCO performs poorly due to a variety of issues, then this value may be more aligned with the firm’s value.
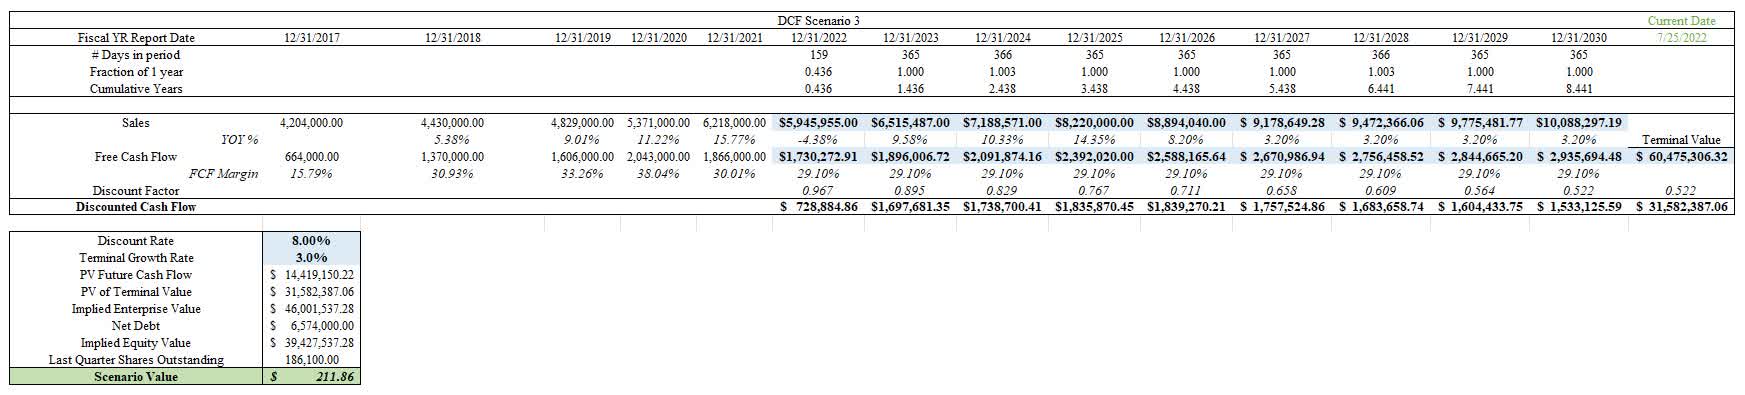
Figure 11. DCF 3 (Author)
The last investor report for Q1 2022 according to MCO shows a medium-term growth outlook that aligns more with scenario 1 though the short term trends would create a desire to consider scenario 3.
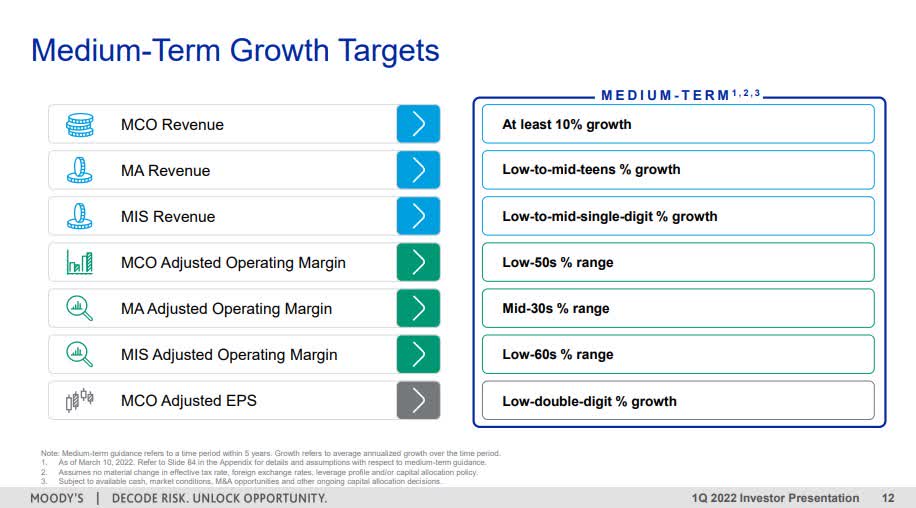
Figure 12. MCO medium-term growth targets (MCO investor relations)
Insider Trading
The insider trading from DATAROMA shows a net outflow of $108,048,827 in MCO stock over the past two years from executives, directors, and upper management. A vast amount of insiders have been selling shares in the price range of $260 – $406 since July of 2020. There has not been a single documented insider “buy” since July of 2020. Investors should factor this into their decision making process since this is a fairly extreme situation and may be construed as a negative aspect for new investors of MCO. The reasoning for the outflow would need to be considered but it doesn’t build confidence for investors when insiders have withdrawn such a large total sum.
Historical Perspectives
Due to the conflict between the valuation and volume of insider trading, I attempt to gain perspective by analyzing “super” investors and their purchases at that snapshot in time specifically in regards to valuation metrics.
Berkshire Hathaway being one of the most renown investors in modern times acquired 48 million MCO shares from the spin-off of Dun & Bradstreet in October of 2000. He maintained his position and sold a significant number of shares in 2009 and 2010. Many articles and news utilize Mr. Buffet as an advocate for buying MCO though they typically fail to mention he acquired his share during a spinoff and has not made purchases (only sells) since 2000 though he may in hindsight consider that a mistake.
Akre Capital Management is one of the largest holders of MCO next to Berkshire Hathaway. Their investment focus is on establishing positions in good businesses that are well managed and have strong reinvestment practices. I personally value their investment approach and after doing some calculations and charting their position establishment, I noticed some interesting observations (Figure 13). The bulk of Akre’s MCO position was established during each prior quarter when P/FCF was around the 15 range. There is also a much greater frequency of selling over the past 5 years probably in relation to balancing their portfolio. They also have a much lower P/B and P/E when purchasing except in 4Q 2016 and 1Q 2017 where the earnings for MCO showed a steep decline.
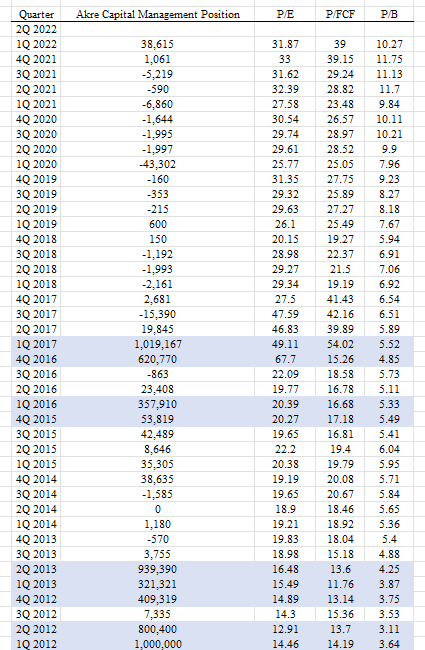
Figure 13. Akre Capital Management position establishment (Dataroma & Macrotrends)
The historical quarterly multiples trends for P/E, P/FCF, and P/B show a general increase over time (Figure 14). This means that investors have been willing to pay a greater premium in price for the denominator of each multiple. It is interesting to observe that a few poor quarterly earnings performances created a spike in the multiples around 2017 and how in 2021 the P/FCF ratio surpassed the P/E ratio. This signifies that “super” investors had taken better advantage of more “fair” pricing opportunity than is currently present and currently maintain their wonderful business with minimal changes accordingly.
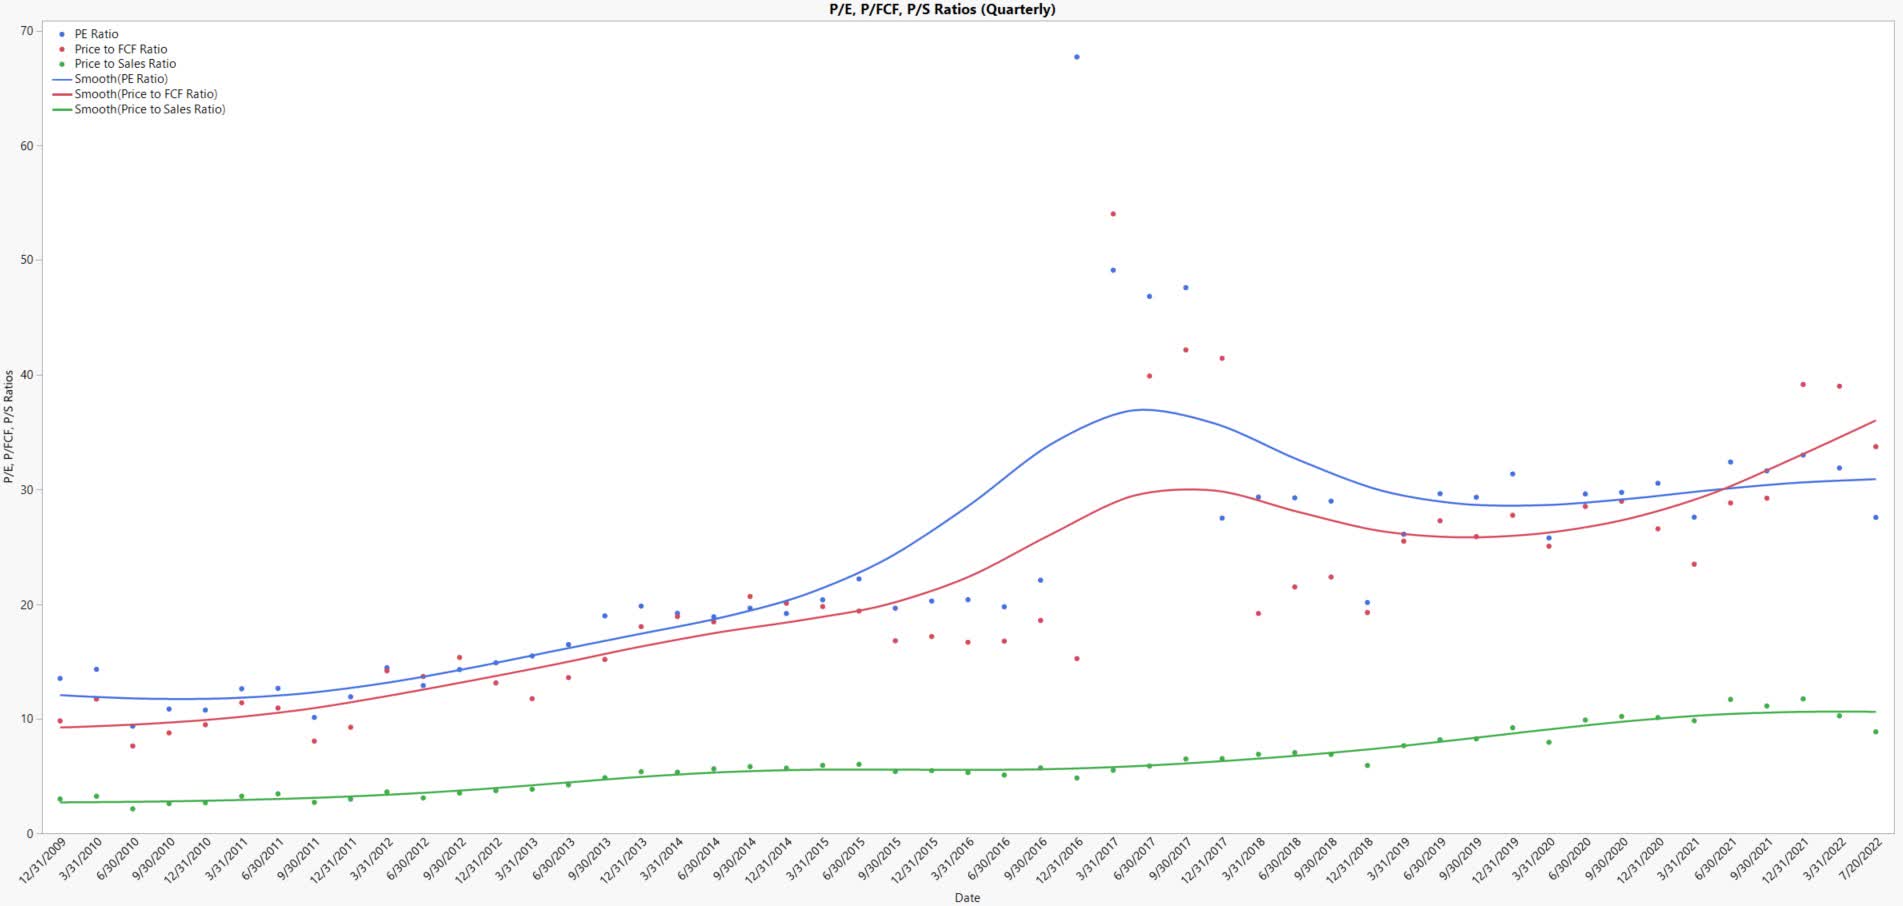
Figure 14. P/E, P/FCF, P/B quarterly ratios (Author)
Risk
I theorize the risks associated with MCO will typically be competitively focused or macro-economic in nature. If the margins and growth are hindered or deteriorated then the stock price may reflect aggressively considering that a premium is built in for the competitive advantage. If the macro-economic continues to trend in a negative way, then the issuance of debt and equity will affect the revenue of MCO. This obviously will drive the earnings and also potentially decrease the price premium that is being paid for the stock price.
The risk for investors is that they establish a position without considering the purchase price and under-perform disproportionately with their exuberance. It is critically important to establish a position at a “fair” value or be patient awaiting opportunistic environments.
Conclusion
I currently rate MCO as a “Hold” due to a mixture of positive and negative aspects as supported and summarized in this article (Figure 15). I think the macro-economic short term trends will place pressure on the fundamentals of the business, ultimately affecting the stock price. The three DCF scenarios given the current assumptions show that two scenarios are trading under-valued and that one scenario is well below the current trading price. There is not a substantial margin of safety for the DCF scenarios leading to a mix of “hold” and “buy” ratings. The insider trading trend of unanimous insider selling does not create comfort for investors looking to establish positions. Observing multiple high performing investors with similar fundamentally oriented investment styles maintaining large positions in MCO creates a psychological assurance for retail investors though their positions have typically been established and reinforced at significantly better trading multiples. Conclusively, my answer for Mr. Buffet’s quote is that while MCO is a wonderful company, they are not trading at a fair value for my personal risk levels and I suggest monitoring their activity for future opportunity.
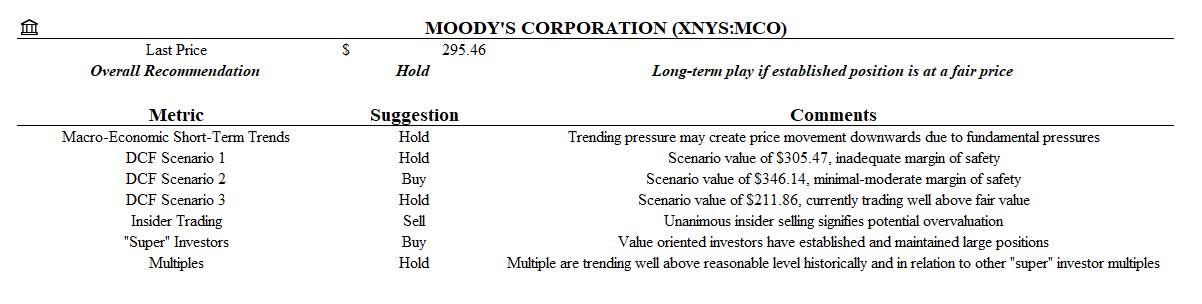
Figure 15. Summary (Author)
Be the first to comment