

Andrii Yalanskyi/iStock via Getty Images
By Dominic Tatakis, Analytics Product Lead, Quantitative Analyst, Yieldbook
With the rise of quantitative credit trading, investors are looking for novel data to better understand their investment risks and drive investment decisions through statistical models.
A sub-market that investors frequently look to in search of yield is the high-yield corporate bond market. In that market, investors fear that the company will default on their debt, and they will lose their money! That is why, the most important risk to consider is the default risk when investing in these bonds.
What if our key analytical measures were able to accurately account for the default risk component? What insights can we get to drive investment decisions?
Let’s look at a Benchmark portfolio of 500 securities in the USD high yield market as an example. We will then construct a portfolio consisting of securities with low probability of default (PD) and a portfolio consisting of securities with high PD values. The portfolios were chosen at the beginning of the period 3 January 2020.
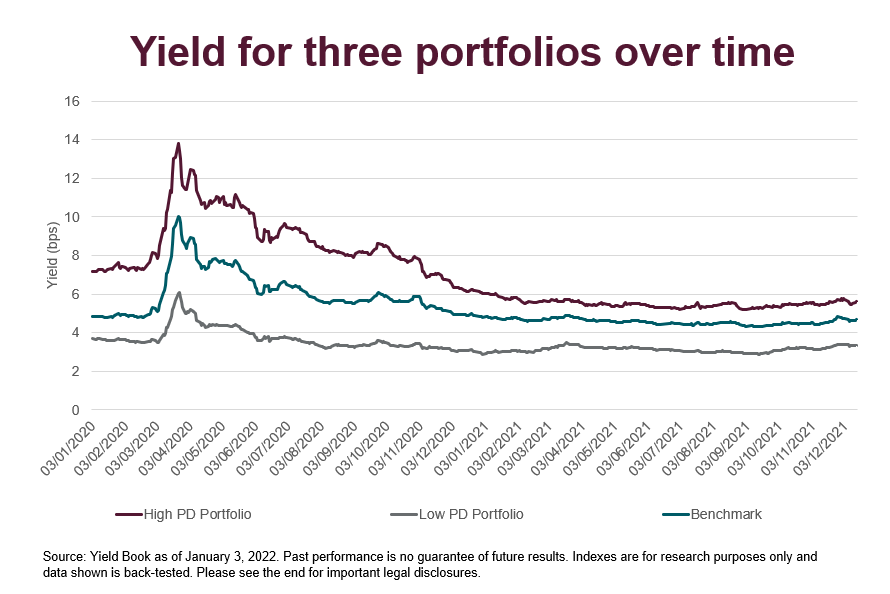
The first two figures should look familiar to most fixed income investors. Companies with a higher PD are likely to carry a higher spread and in case they do not default, are expected to have a higher return. With the same logic, companies with a low probability of defaulting have lower returns and spreads, hence the term: “high risk, high return.
Yield Book | FTSE Russell Yield Book | FTSE Russell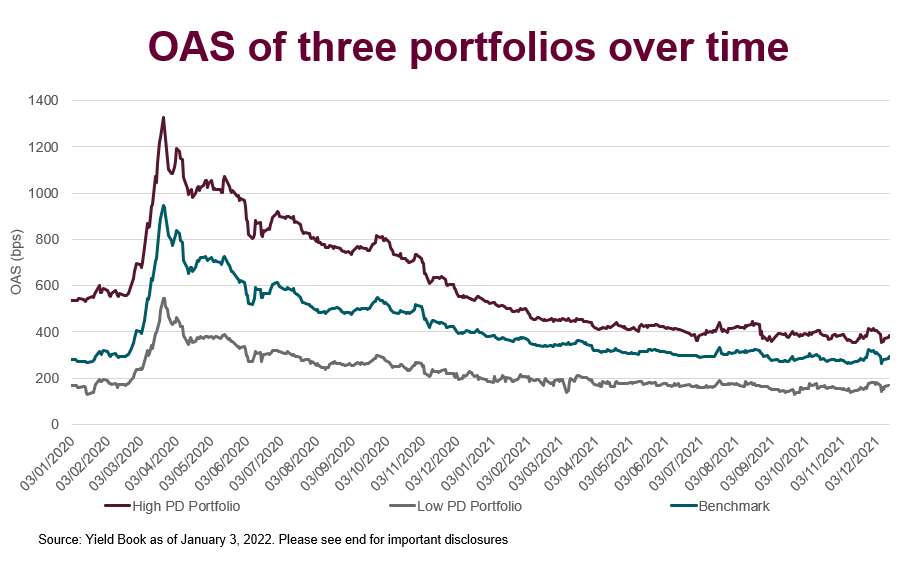
The next two figures are more interesting. Here we construct measures that look at the bonds spread and yield while accounting for the possibility of the bond defaulting and future cashflows remaining unrealized.
Such default-adjusted measures therefore quantify the default and non-default portions of risk. From these measures, an investor would expect that non-default yield and spread to be similar across different probability of default buckets, which is exactly what we observe before the pandemic hit.
More specifically, it can be seen default-adjusted-yield fluctuates around 4% (below graphs) regardless of the PD of the bonds, while nominal yield is between 4%-8% (above graphs), depending on the probability of default of the bond. Similarly, when the market is more comfortable with COVID toward the end of 2021, yields and spreads converge again to a similar level.
Yield Book | FTSE Russell Yield Book | FTSE Russell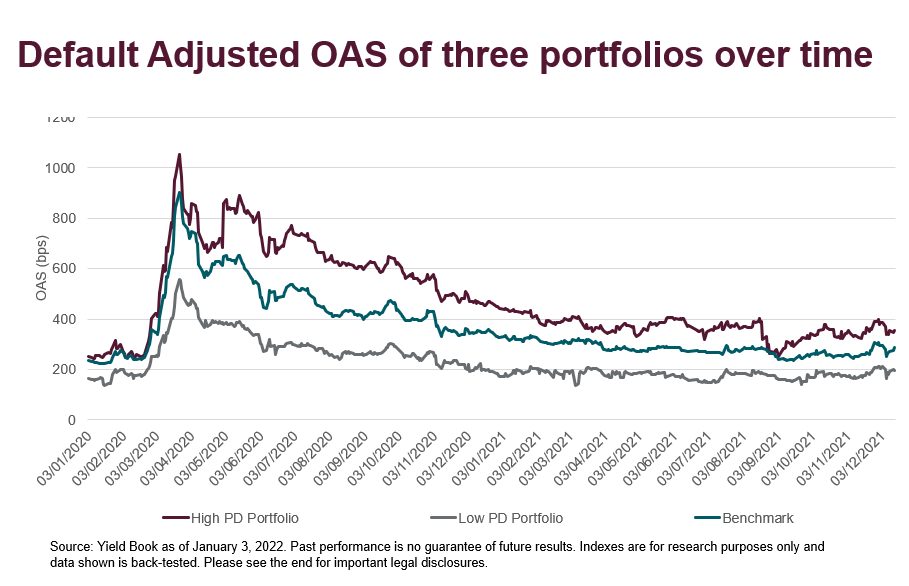
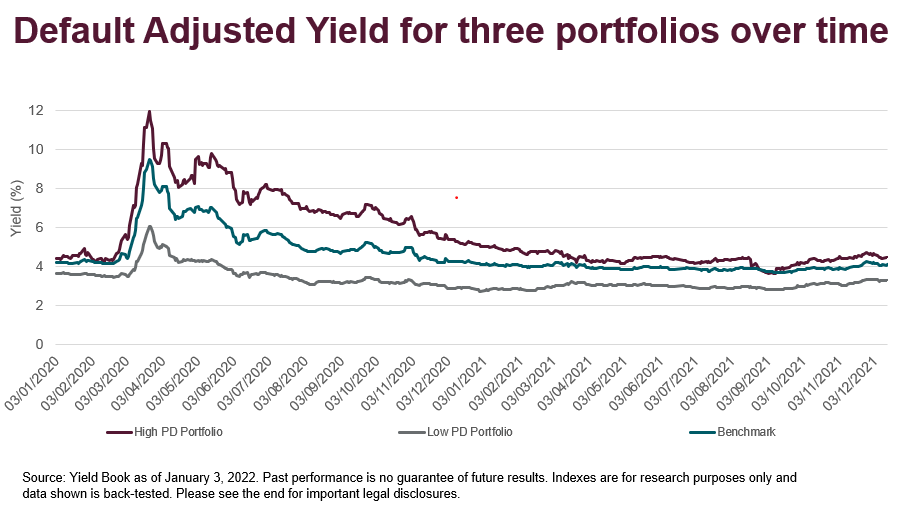
However, this does not seem to hold during the peak of the COVID crisis around March 2020. The yields and spread of the high PD and low PD portfolios diverge significantly, which cannot be easily explained by default risk.
The non-default yields on low PD bonds rise from 4% to 6%, while those of high PD bonds rise from 4% to 12%. This shows that other considerations are also being reflected in market behavior, and the increase in yields and spreads is not solely due to increased risk of default. Investors could further research whether such increases are justified after accounting for the default risk component.
What does this mean for investors?
This means that investors could benefit from tools that investigate and break down the individual components of risks that are involved with corporate bond investing. Quantifying and analyzing these risks could help them understand their portfolios better, especially during uncertain market conditions like the pandemic.
This analysis was done using The Yield Book as of 03/01/2022. The analytics used are Option-Adjusted-Spread, Yield-to-Maturity, Default-Adjusted-Spread, Default-Adjusted-Yield. The PD values for the metrics and the companies are provided by the Credit Research Initiative, part of the National University of Singapore.
© 2021 London Stock Exchange Group plc and its applicable group undertakings (the “LSE Group”). The LSE Group includes (1) FTSE International Limited (“FTSE”), (2) Frank Russell Company (“Russell”), (3) FTSE Global Debt Capital Markets Inc. and FTSE Global Debt Capital Markets Limited (together, “FTSE Canada”), (4) MTSNext Limited (“MTSNext”), (5) Mergent, Inc. (“Mergent”), (6) FTSE Fixed Income LLC (“FTSE FI”), (7) The Yield Book Inc (“YB”) and (8) Beyond Ratings S.A.S. (“BR”). All rights reserved.
FTSE Russell® is a trading name of FTSE, Russell, FTSE Canada, MTSNext, Mergent, FTSE FI, YB and BR. “FTSE®”, “Russell®”, “FTSE Russell®”, “MTS®”, “FTSE4Good®”, “ICB®”, “Mergent®”, “The Yield Book®”, “Beyond Ratings®” and all other trademarks and service marks used herein (whether registered or unregistered) are trademarks and/or service marks owned or licensed by the applicable member of the LSE Group or their respective licensors and are owned, or used under licence, by FTSE, Russell, MTSNext, FTSE Canada, Mergent, FTSE FI, YB or BR. FTSE International Limited is authorised and regulated by the Financial Conduct Authority as a benchmark administrator.
All information is provided for information purposes only. All information and data contained in this publication is obtained by the LSE Group, from sources believed by it to be accurate and reliable. Because of the possibility of human and mechanical error as well as other factors, however, such information and data is provided “as is” without warranty of any kind. No member of the LSE Group nor their respective directors, officers, employees, partners or licensors make any claim, prediction, warranty or representation whatsoever, expressly or impliedly, either as to the accuracy, timeliness, completeness, merchantability of any information or of results to be obtained from the use of FTSE Russell products, including but not limited to indexes, data and analytics, or the fitness or suitability of the FTSE Russell products for any particular purpose to which they might be put. Any representation of historical data accessible through FTSE Russell products is provided for information purposes only and is not a reliable indicator of future performance.
No responsibility or liability can be accepted by any member of the LSE Group nor their respective directors, officers, employees, partners or licensors for (A) any loss or damage in whole or in part caused by, resulting from, or relating to any error (negligent or otherwise) or other circumstance involved in procuring, collecting, compiling, interpreting, analysing, editing, transcribing, transmitting, communicating or delivering any such information or data or from use of this document or links to this document or (B) any direct, indirect, special, consequential or incidental damages whatsoever, even if any member of the LSE Group is advised in advance of the possibility of such damages, resulting from the use of, or inability to use, such information.
No member of the LSE Group nor their respective directors, officers, employees, partners or licensors provide investment advice and nothing contained in this document or accessible through FTSE Russell Indexes, including statistical data and industry reports, should be taken as constituting financial or investment advice or a financial promotion.
Past performance is no guarantee of future results. Charts and graphs are provided for illustrative purposes only. Index returns shown may not represent the results of the actual trading of investable assets. Certain returns shown may reflect back-tested performance. All performance presented prior to the index inception date is back-tested performance. Back-tested performance is not actual performance, but is hypothetical. The back-test calculations are based on the same methodology that was in effect when the index was officially launched. However, back-tested data may reflect the application of the index methodology with the benefit of hindsight, and the historic calculations of an index may change from month to month based on revisions to the underlying economic data used in the calculation of the index.
This publication may contain forward-looking assessments. These are based upon a number of assumptions concerning future conditions that ultimately may prove to be inaccurate. Such forward-looking assessments are subject to risks and uncertainties and may be affected by various factors that may cause actual results to differ materially. No member of the LSE Group nor their licensors assume any duty to and do not undertake to update forward-looking assessments.
No part of this information may be reproduced, stored in a retrieval system or transmitted in any form or by any means, electronic, mechanical, photocopying, recording or otherwise, without prior written permission of the applicable member of the LSE Group. Use and distribution of the LSE Group data requires a licence from FTSE, Russell, FTSE Canada, MTSNext, Mergent, FTSE FI, YB and/or their respective licensors.
Editor’s Note: The summary bullets for this article were chosen by Seeking Alpha editors.
Be the first to comment