

DNY59
Introduction
In this note, I discuss some of the more interesting aspects of the Franklin Resources, Inc.’s (NYSE:BEN) 3Q22 results and provide an update on my fundamental valuation of the stock, full details of which are set out below. I also provide analysis regarding the leverage of BEN’s operating income to movements in assets under management ‘AUM’ in order to give investors a better understanding of the sensitivity of the group’s earnings to negative movements in investment markets.
Note that 3Q22 was the first quarter of contribution from the acquired Lexington Partners business. Consistent with the analysis outlined in my May 2022 BEN Seeking Alpha note, the addition of Lexington Partners AUM pushed the group’s effective fee rate up to 39.5bp (from 38.5bp in 2Q22), however as disclosed on page 11 of the 3Q22 10Q, Lexington Partners did not have a material impact on net income for the quarter.
Net Flows – Disappointments Continue
A backdrop of weak investment markets provides a challenge for most fund managers when it comes to net flows; this is particularly the case for fund managers that are exposed to retail investors. With almost half of BEN’s AUM attributable to the retail channel (see Chart 1 below), the company was bound to struggle on net flows in 3Q22. In the analyst Q&A session, CEO Jenny Johnson highlighted that redemptions in US fixed income had been “much heavier” in the retail channel than in the institutional channel.
Chart 1:
Source: BEN 3Q22 Executive Commentary, page 5.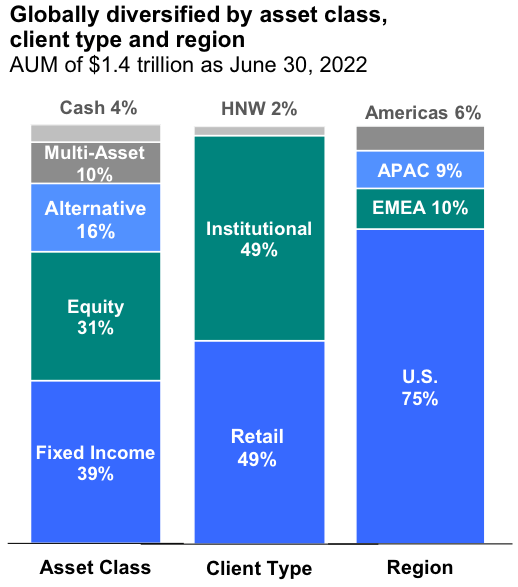
Whilst, given the market conditions, it is not surprising that BEN reported net outflows in 3Q22, it would be naïve for investors to blame external factors alone for the net flow loss in AUM of -$19.8bn (or -$23.5bn if reinvested distributions are excluded). Net outflows have been a consistent negative feature of BEN’s quarterly reports for many years, and an ongoing source of disappointment for this analyst – as part of my investment thesis for the stock has been the eventual return to positive net flows. Net outflows continued in July 2022, as disclosed in BEN’s 09 August 2022 announcement.
Chart 2 plots AUM sales and redemptions (long-term sales and long-term redemptions, to be specific) from 1Q17 through 3Q22. 4Q20 has been excluded, as that quarter was distorted by the Legg Mason acquisition. I have adjusted BEN’s reported long-term sales to remove the effect of reinvested distributions. The percentage shown relates to the impact of each item relative to the opening AUM for that quarter. Note that these percentages are quarterly rates, not annualized rates.
Chart 2:
Source: author’s calculations based on BEN quarterly reports.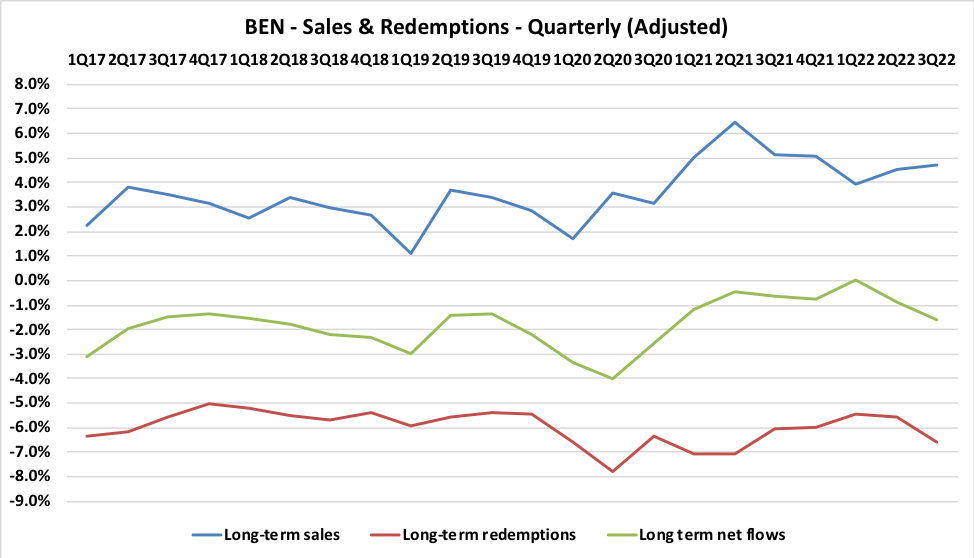
Looking at Chart 2, broadly speaking BEN has slightly improved its performance in long-term sales relative to the pre Legg Mason acquisition era. Unfortunately, there has been no real improvement in long-term redemptions. Management commentary regularly highlights the benefits of BEN today being a more diversified business than in the past (thanks to Legg Mason and multiple subsequent acquisitions, rather than via organic evolution), but this additional diversification has not helped management to achieve what must surely be one of the group’s most pressing goals – to generate consistent positive net flows. Strong product investment performance numbers are vital for driving sales and easing redemption pressures – read on to get an overview of how BEN is looking on that front.
Investment Performance Metrics – Significant Improvement Required
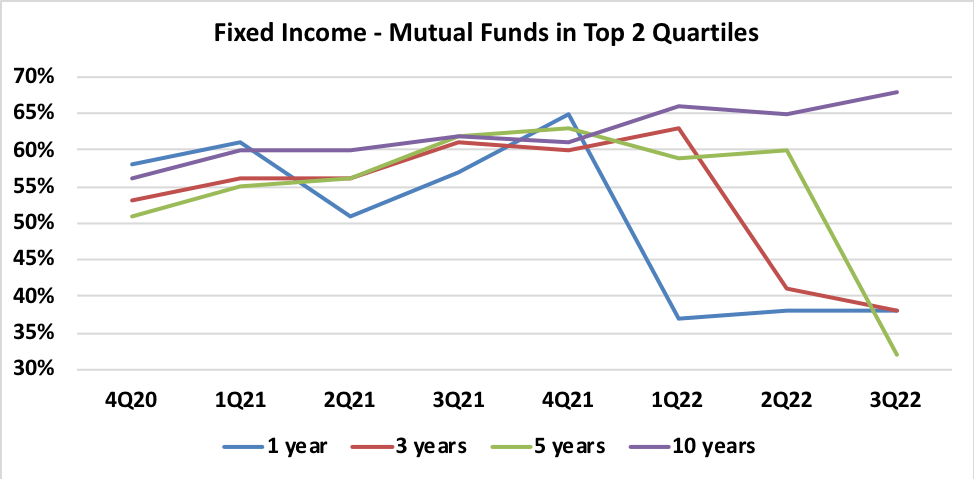
In the charts below I track BEN’s product investment performance relative to peers and benchmarks. The underlying data has been extracted from BEN’s quarterly 10Q reports. The data is split into Equity, Fixed Income and Total AUM. Let’s start with the peer-relative analysis and then look at the benchmark-relative analysis.
Peer-relative analysis:
Source: author’s calculations based on BEN quarterly reports. Source: author’s calculations based on BEN quarterly reports. Source: author’s calculations based on BEN quarterly reports.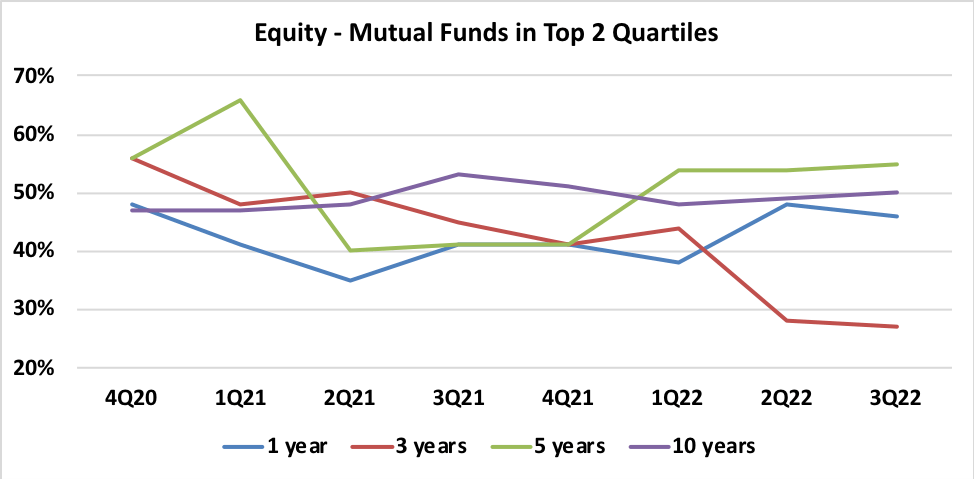
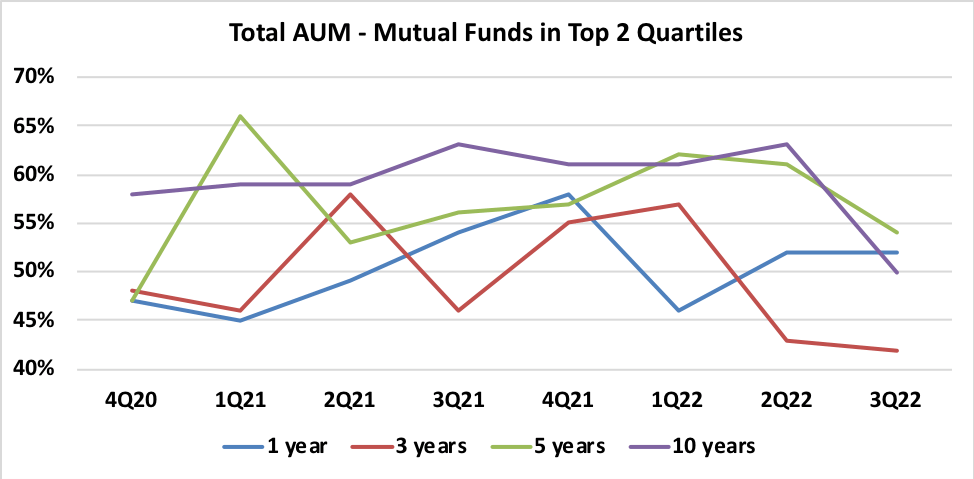
Observations:
- For Equity, generally speaking, peer relative performance hasn’t changed much over time. That said, the recent drop-off in the 3-year metrics is concerning. At 3Q22, the 5-year measure is the only metric that is ranking above 50% versus peers. My conclusion is that on a peer-relative basis, BEN’s Equity franchise is looking rather weak.
- Fixed Income metrics were solid until 4Q21, but have softened very materially over recent quarters. At 3Q22, the 1-,3- and 5-year metrics are all below 40%. I conclude that BEN’s Fixed Interest business is now looking rather weak versus peers.
- On a Total AUM basis, to feel positive about the ability of investment performance to support AUM growth, I like to see peer-relative metrics above 60%. At 3Q22, BEN is below 55% for all timeframes.
Benchmark-relative analysis:
Source: author’s calculations based on BEN quarterly reports. Source: author’s calculations based on BEN quarterly reports. Source: author’s calculations based on BEN quarterly reports.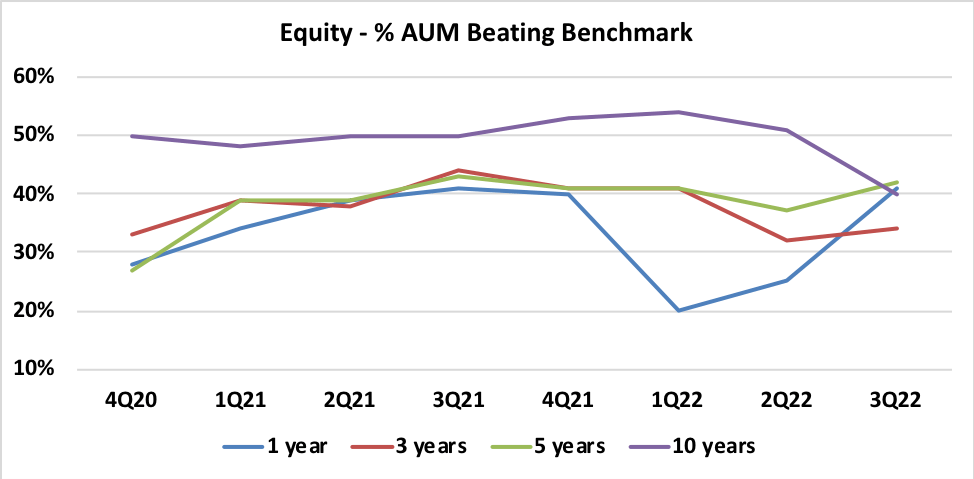
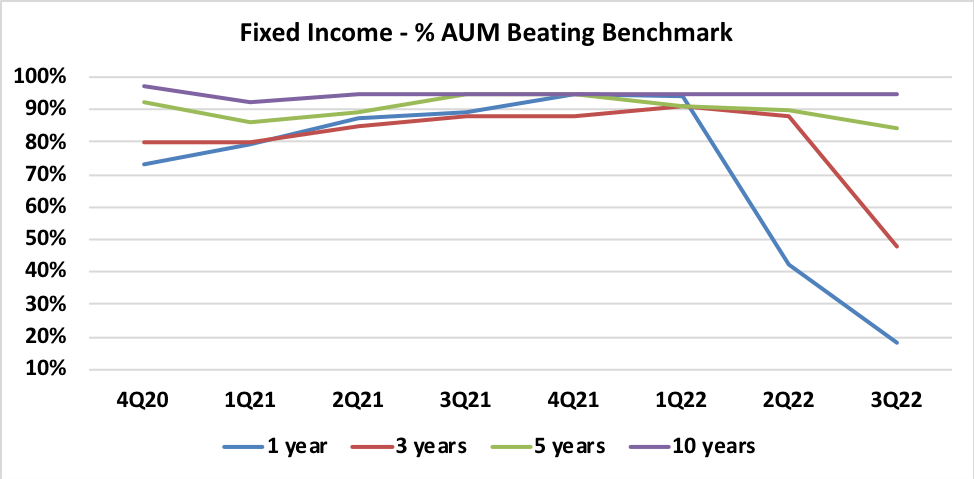
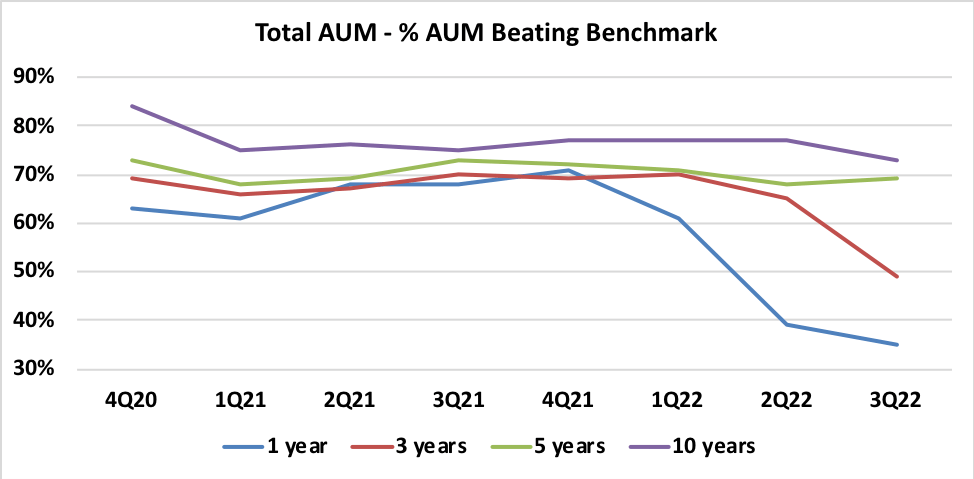
Observations:
- For Equity, other than a poor 1-year metric at 1Q22, generally speaking, benchmark-relative performance has been broadly consistent over the period. However, with all timeframe metrics materially below 50% as at 3Q22, the overall assessment is that BEN’s Equity products are not performing at all well.
- Fixed Income 1-year and 3-year metrics have softened very materially over recent quarters and as at 3Q22 are becoming quite concerning. The longer-term metrics remain healthy.
- On a Total AUM basis, the longer-term metrics have been stable over time and remain strong. The 1-year and 3-year metrics have deteriorated noticeably since 4Q21 and BEN will want to see improvements from here.
It should be noted that the analysis above is based upon the data that BEN publishes. This data allows investors to form an opinion of the average investment performance across BEN’s products. As such, it provides a simplistic, high-level overview. Publication of more comprehensive product performance data by BEN would be helpful for investors and analysts.
Performance Fees – Unsustainably High?
Prior to the Legg Mason acquisition, performance fees were rarely material for BEN’s total investment management fee income line. In 3Q21 we saw a sharp increase in performance fees, and quarterly contributions have remained elevated since that date. The average performance fee income across the five quarterly periods to 3Q22 is $110m per quarter. For 3Q22, performance fees made up 8.2% of total investment management fee income.
BEN does not provide detailed data that allows for a proper analysis of the group’s performance fees. Analysts are therefore heavily reliant on management commentary to form a view regarding the sustainable level of performance fees that the business is expected to generate. In the 3Q22 Q&A session, CFO Matthew Nicholls referred to a reasonable range for quarterly performance fees to be $30m to $40m. The gap between the recent run-rate of ~$110m per quarter and the CFO’s general guidance is huge. Further, the CFO has flagged that performance fees are expected to remain high in the coming quarters, and to peak in 1Q23.
For valuation purposes, I have set my assumption for sustainable performance fees to be at the top end of the CFO’s guidance range, however there is clearly a high degree of uncertainty regarding this component of BEN’s earnings.
Adjusted Operating Earnings – Be Mindful of Large Items Excluded
It is important to be aware of how BEN treats certain expenses relating to acquisitions from an earnings reporting perspective. In addition to US GAAP, BEN, consistent with many other companies, also presents ‘Adjusted’ results to the market, and BEN’s management commentary generally focuses on the Adjusted numbers. The following expense items are not included within BEN’s Adjusted Operating Income:
- Acquisition-related retention compensation.
- Other acquisition-related expenses including professional fees, technology costs and fair value adjustments related to contingent consideration liabilities.
Source: BEN 3Q22 Earnings Release, page 7.
BEN has been very active on the acquisition front over recent years, and consequently the earnings adjustments relating to acquisition matters have grown substantially. Some investors may debate whether or not these adjustments are valid and reasonable, however the underlying costs incurred certainly do have an impact on actual value, and hence should not be totally ignored. To provide some context – 3Q22 adjusted operating income of $566.9m includes positive adjustments of +$44.2m for acquisition-related retention and +$31.5m for other acquisition-related expenses. Put another way, 13.4% of BEN’s 3Q22 adjusted operating income relates to the adding-back of acquisition-related costs.
BEN provides the market with information on future acquisition-related retention expenses in published 10Qs and annual reports. An extract from the 3Q22 10Q is shown below. Note that we can expect acquisition-related retention expenses to increase further following the completion of the Alcentra acquisition (announced 31 May 2022).
We expect to incur additional acquisition-related retention expenses of approximately $60 million during the remainder of the current fiscal year, and annual amounts beginning at approximately $230 million in the fiscal year ending September 30, 2023 and decreasing over the following two fiscal years by approximately $30 million and $70 million.
Source: BEN 3Q22 10Q, page 34.
As at 3Q22, BEN’s total future acquisition-related retention payments (which are excluded from management’s adjusted earnings) sum to $650m. In the context of BEN’s market cap of ~$14.4bn, the total future acquisition-related retention payments are equal to about 4.5% of the group’s market value.
Valuation Assessment
In the calculations below, I present an updated simple P&L model for BEN that can be flexed to consider a number of scenarios. My calculations are in line with the Adjusted results that BEN’s management presentations refer to. I direct readers to my previous Seeking Alpha BEN notes for detailed discussion of my normalized earnings valuation methodology.
The Base Case valuation builds up from BEN’s most recently published AUM (as at 31 July 2022). The Bear Case then assumes a 5% fall in AUM. The Bull Case assumes a 5% increase in AUM. The valuation summary is shown in Table 1.
Table 1:
Source: author’s calculations based on BEN quarterly reports.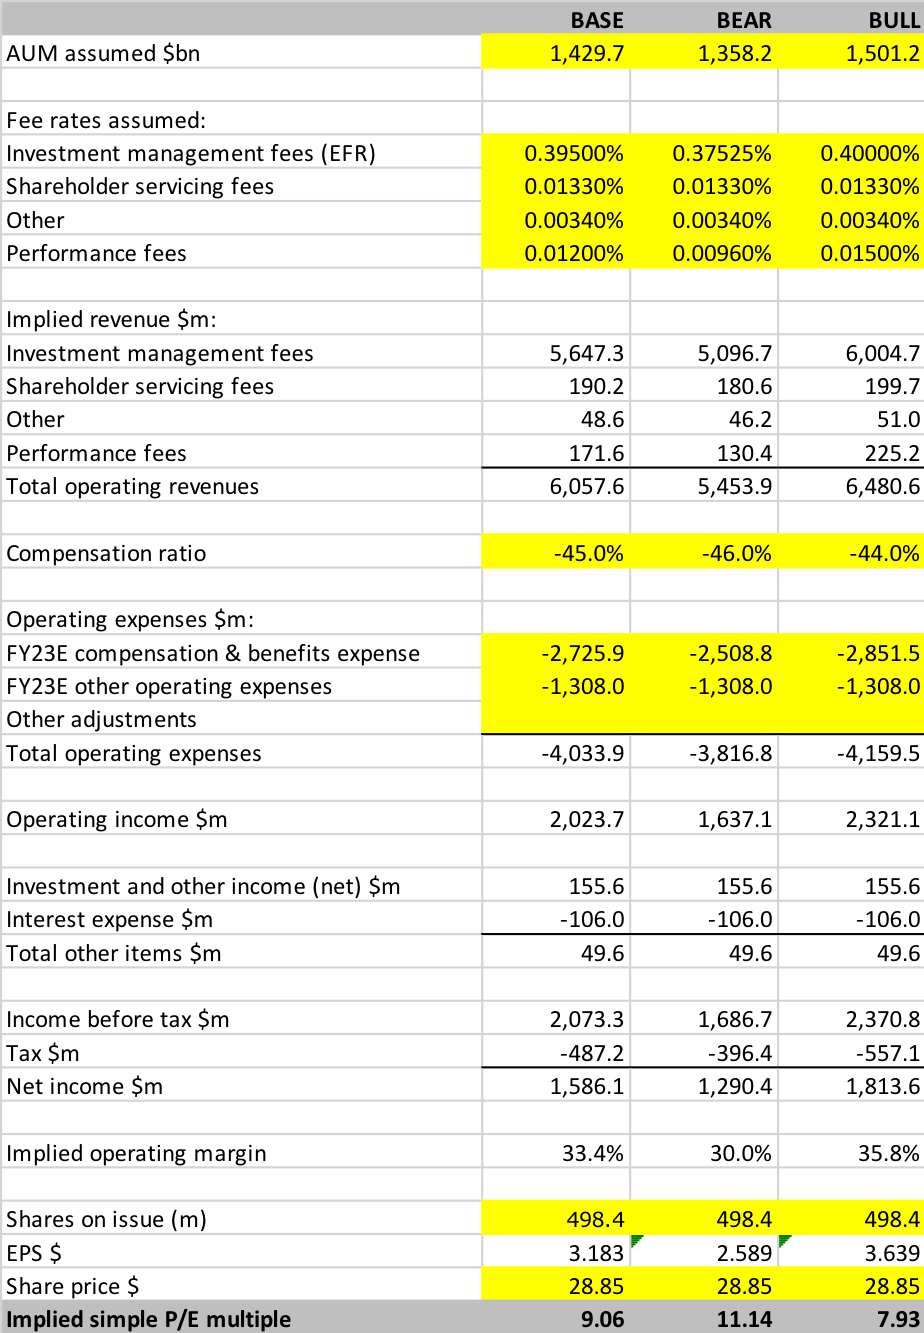
Based on the 15 August 2022 market close of $28.85 per share, the implied P/E for BEN is currently: Base Case 9.1x, Bear Case 11.1x, Bull Case 7.9x.
Operating Income – AUM Sensitivity
During periods in which investment markets are weak and volatile, investors must be mindful of the sensitivity of fund manager earnings to AUM levels. In Table 2, I provide a summary of a simple analysis of the sensitivity of BEN’s operating income to different levels of AUM, using the Base Case AUM of $1,429.7bn as a starting point. Given the current gloomy economic outlook, I have focused on downside scenarios, but a similar approach can be used to model upside scenarios.
Note that as AUM falls, I have allowed for an increase in the compensation ratio. This is due to the impact of fixed remuneration, which cannot realistically be flexed downwards as AUM declines. Although the compensation ratio increases in the model, the overall level of compensation expense actually reduces (due to the link between compensation and declining AUM).
Table 2:
Source: author’s calculations based on BEN quarterly reports.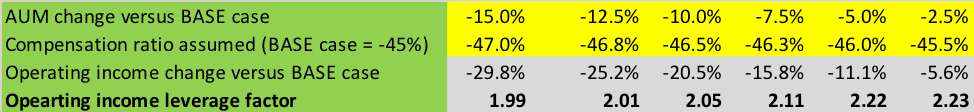
The key takeaway from this analysis is that BEN’s operating income is roughly 2x leveraged to movements in the group’s AUM. Investors concerned about the potential for broad investment market declines should therefore keep this factor front of mind.
Conclusion – Downgrade to HOLD
As outlined in my prior Seeking Alpha research notes, after consideration of the various operational challenges faced by the company, I have adopted an adjusted fair-value P/E benchmark for BEN of 11x.
BEN’s current P/E of 9.1x points to significant upside relative to this fair-value benchmark of 11x. An AUM fall of around -10% would take BEN’s valuation back to fair-value, at which point a BUY rating could not be supported. As things stand today, I believe that investment market movements could quite conceivably deliver a fall in BEN’s AUM of around -5% to -10%, so on that basis, the valuation upside signal is somewhat shaky.
In addition to concerns regarding downside sensitivity to negative investment markets, I am increasingly worried about BEN’s operational trends, particularly in regard to investment product performance metrics. The near-term prospects of BEN reporting positive net inflows (which I believe would deliver a material upward re-rating of the stock’s P/E multiple) now appear to be very low.
BEN’s strategy to expand aggressively in the Alternatives space, driven by large acquisitions, comes with both upside and downside risk. From my perspective, I see more downside risk to the strategy than upside potential. I fear that BEN’s timing in regard to the Alternatives acquisitions may be unfortunate, with genuine prospects of material asset price corrections in the Alternatives space as interest rates increase and excess liquidity dries up.
On balance, whilst my valuation work still points to BEN warranting a BUY rating, my confidence in the company’s operational performance outlook and strategic direction has reduced materially. I therefore downgrade BEN to HOLD.
Be the first to comment