

HJBC/iStock Editorial via Getty Images
As Intro
This article provides a comprehensive look at Microsoft’s (MSFT) current price in light of the latest quarterly report. The analysis includes the DCF model, as well as an overview of the technical picture.
Quantitative and Qualitative growth
Nothing affects the price of a company as much as its growth dynamics. And here we must admit that Microsoft managed to surprise…
According to FY22 Q2 Microsoft’s revenue TTM grew by 20.6% YoY to $184.9 billion, which exceeded analysts’ expectations. But the most important thing is that in the structure of the company’s revenue, each segment showed an acceleration. And in the case of the “Intelligent Cloud”, the annual growth was a record for the last 7 years at the level of 27.3%:
Author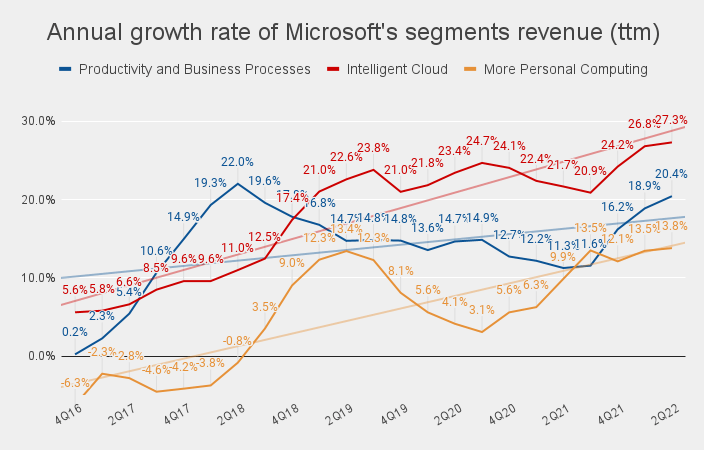
The growth rate of the “More Personal Computing” segment in the last quarter was 13.8% YoY, which also turned out to be a record value. It is worth recalling here that Microsoft is buying Activision Blizzard (ATVI), which will allow the company to become the third largest gaming company in the world in terms of revenue after Tencent (OTCPK:TCEHY) and Sony (NYSE:SONY). I think this will support the growth rate of this segment in the future.
The very fact that the phase of accelerating revenue growth continues is critical for the valuation. This follows from the objective direct relationship between the P/S multiple and the revenue growth rate:
VisualizedAnalytics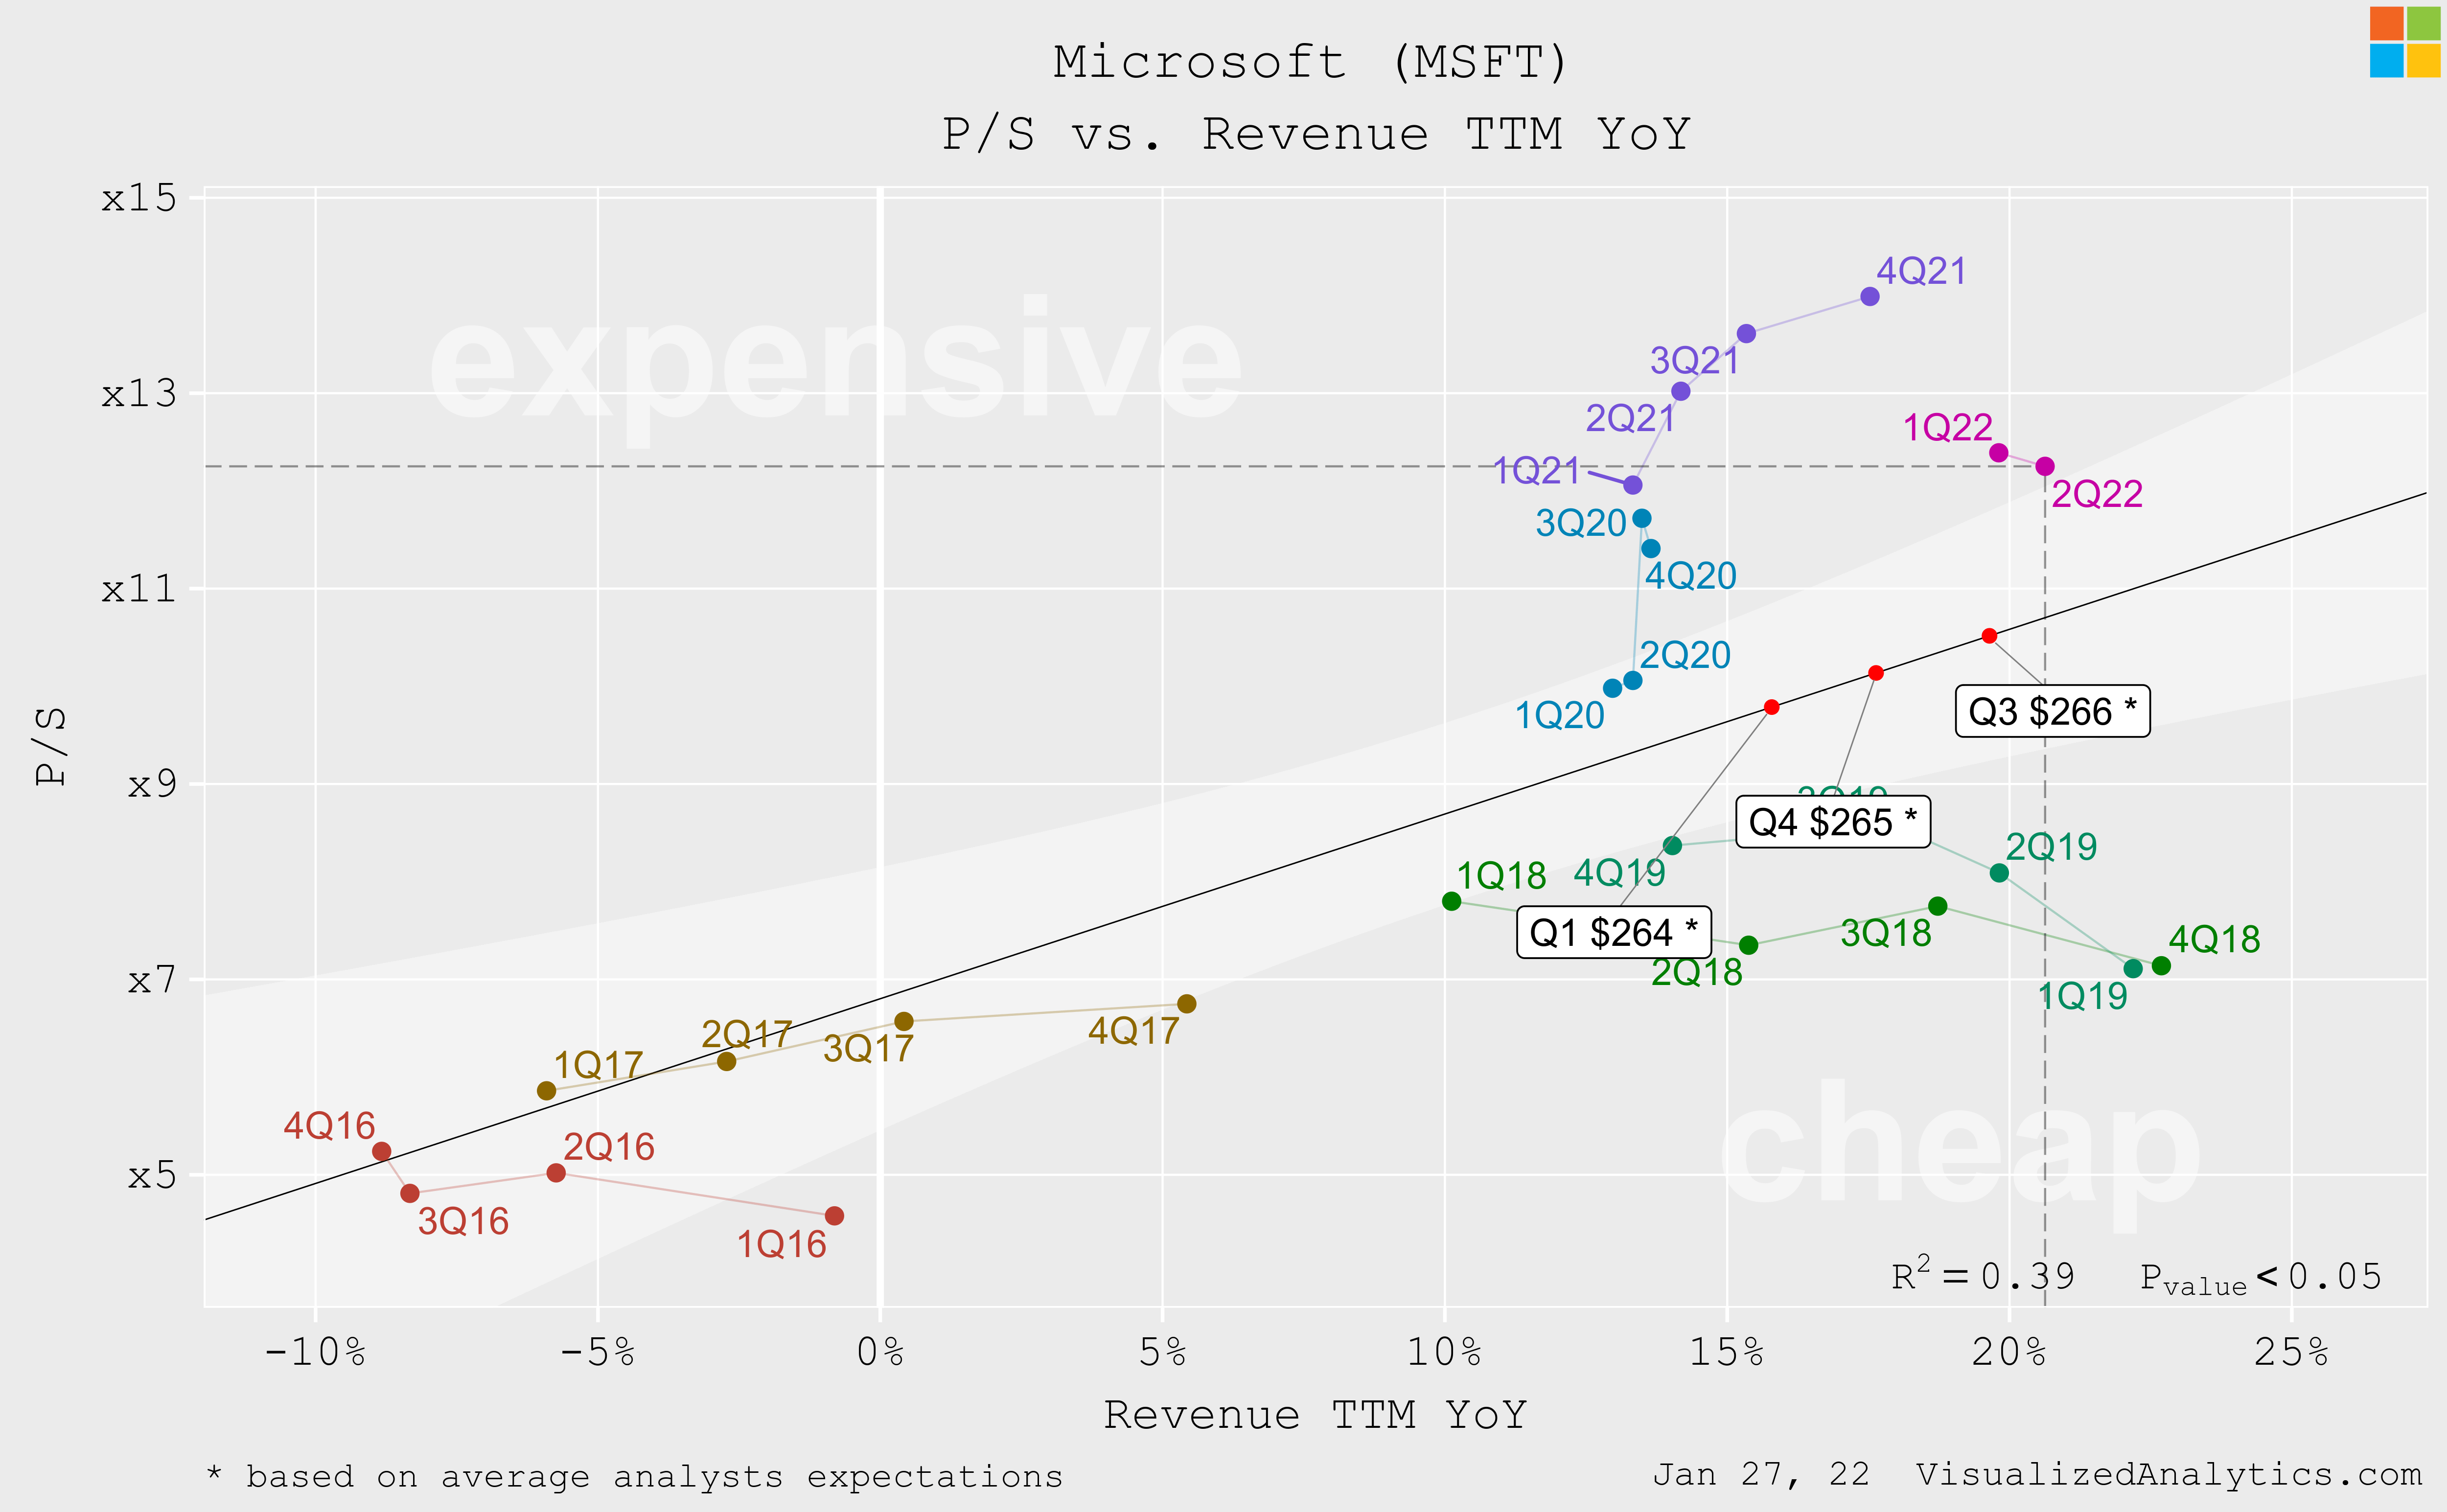
Within this relationship, judging by the current level of the P/S multiple, the market believes that the acceleration of revenue growth will continue. And judging by the general trend, this is the most likely scenario.
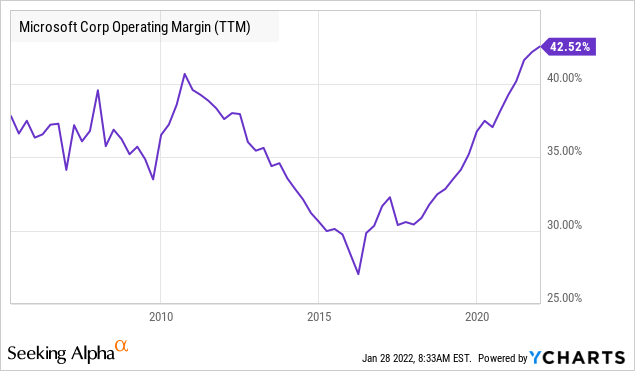
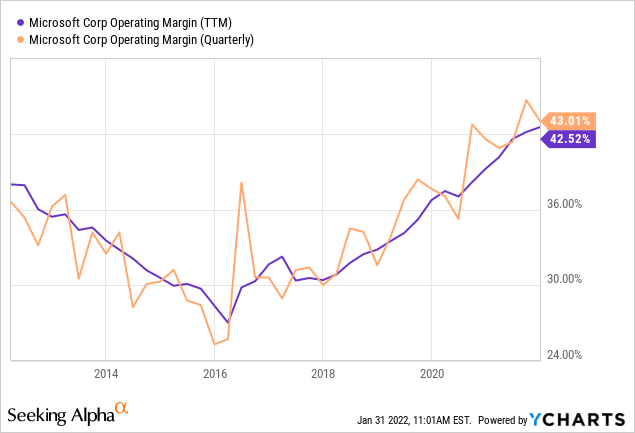
Now about the margin. Microsoft’s operating margin exceeded 42% last quarter, reaching its highest level since the 2000s:
Considering the dynamics of margin changes in the context of key segments, following an uptrend is also noted:
Author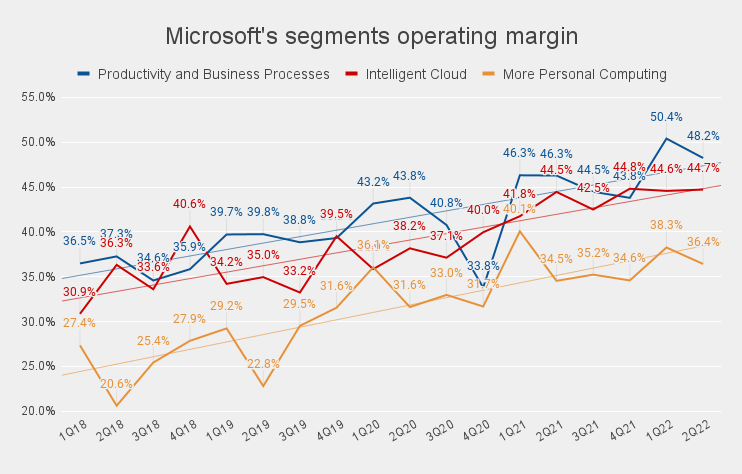
There is some risk that the end of the pandemic will have a negative impact on margins. But personally, I am of the opinion that the pandemic has already caused structural changes in the economy that are irreversible. Therefore, it is likely that Microsoft’s highly differentiated business may be able to avoid a strong pullback.
So, at the moment, there is every reason to believe that Microsoft’s quantitative and qualitative growth has accelerated over the past quarter. Given that any process has inertia, this increases the long-term potential of the company.
What about valuation?
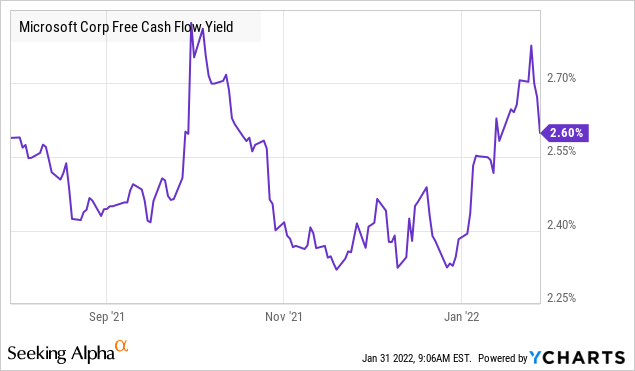
At the end of last year, I wrote a bearish article about Microsoft in which I drew attention to the fact that the company’s price may have slightly outperformed its value, with an eye to such an indicator as Free Cash Flow Yield (Free Cash Flow TTM / Market Capitalization).
In November, this figure reached a ten-year low (2.32%) and was the lowest among large technology companies. This meant that for every dollar of capitalization, Microsoft generated a relatively low amount of free cash flow. And that was not a good sign.
As a result of the subsequent price correction and the publication of the next quarterly reports, the Free Cash Flow Yield rose above 2.7%. At least we are no longer at a historical low:
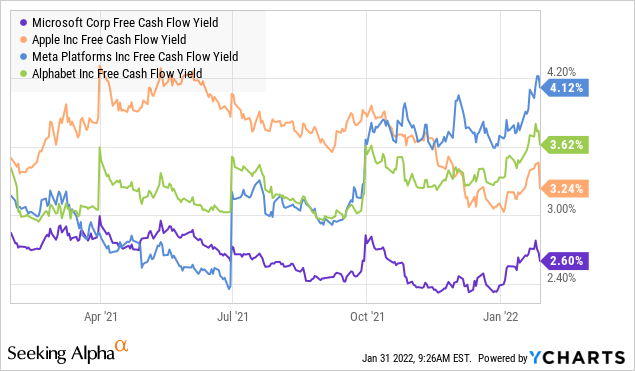
But still compared to other large technology companies, this figure is low:
OK, probably this indicator should be analyzed comprehensively. And probably the rate of free cash flow growth should also be taken into account here…
In the case of Microsoft, there is a very strong relationship between the long-term free cash flow growth rate and the level of the EV/FCF multiple. And within the framework of this dependence, the current price of the company is almost perfectly balanced:
VisualizedAnalytics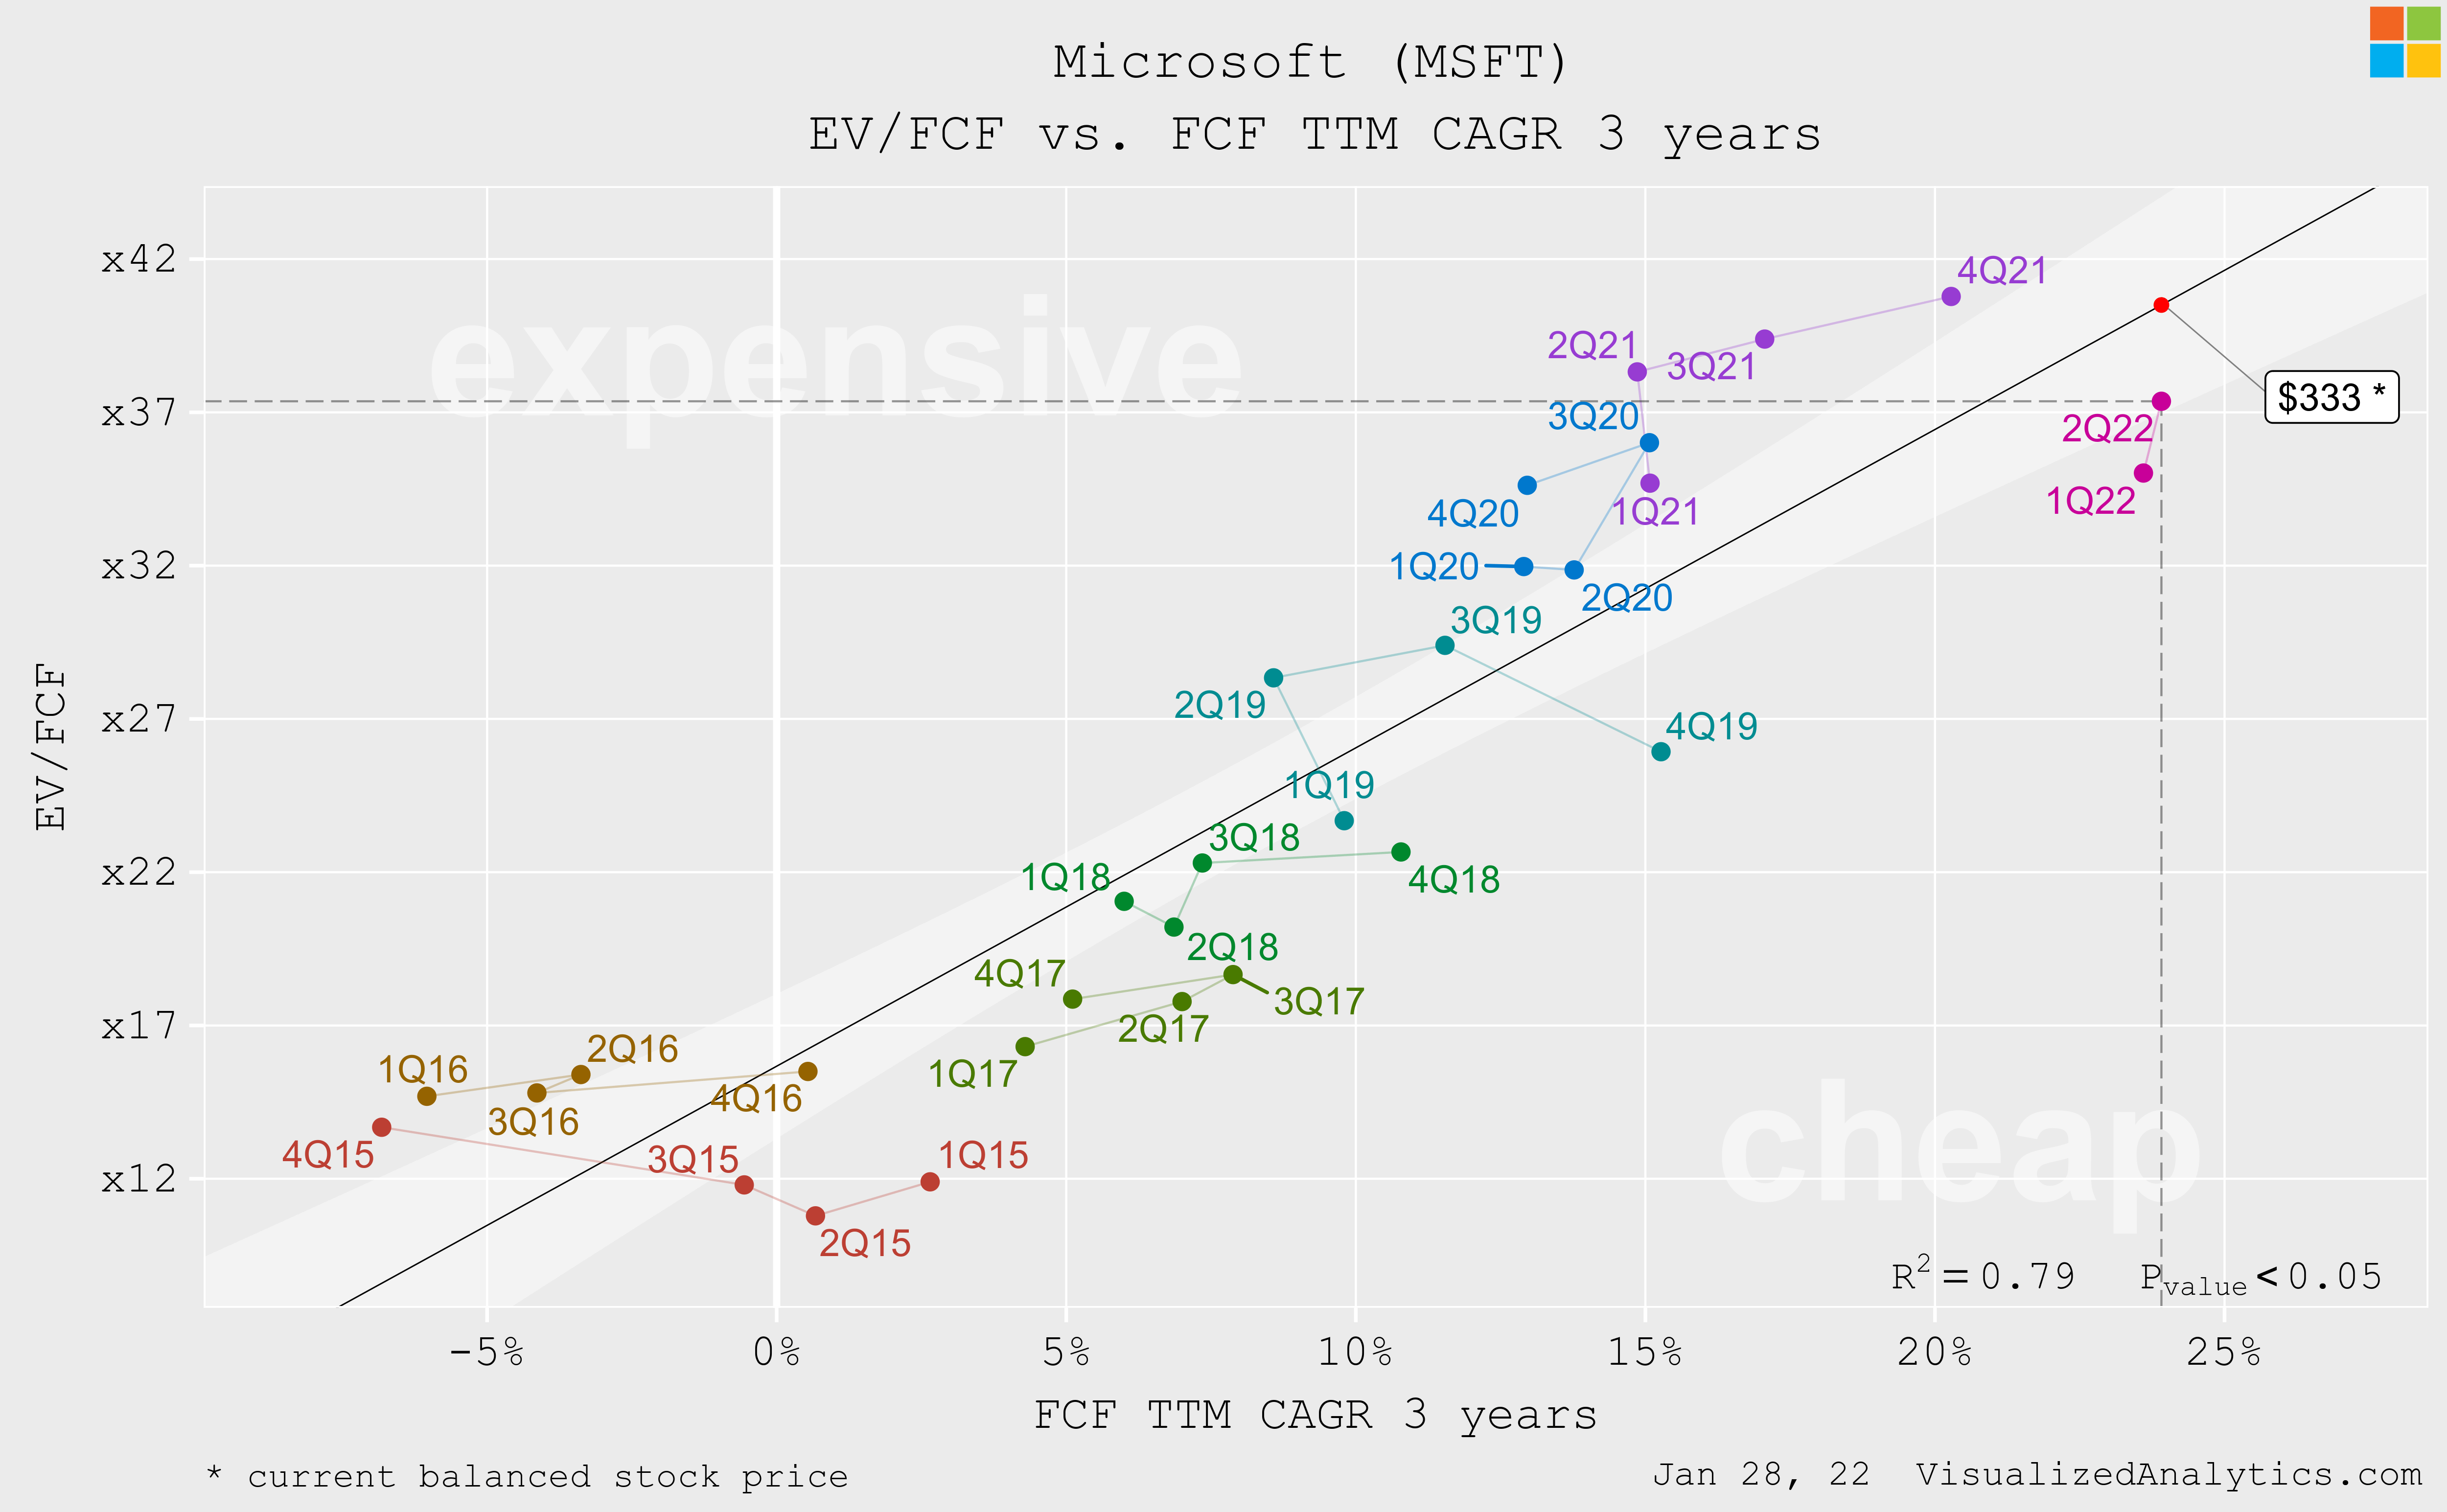
In turn, if we compare the growth rate of free cash flow, then the Microsoft indicator is in the approximate middle of the range:
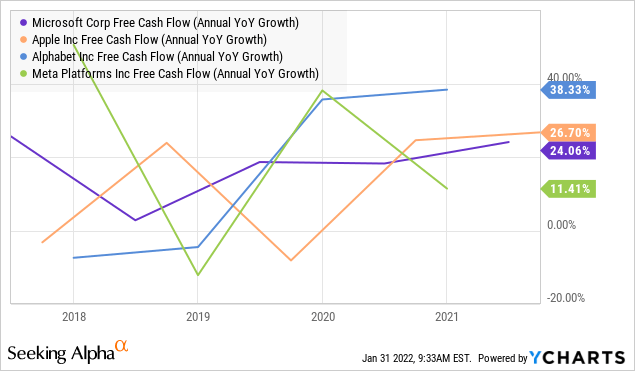
And if we compare average analyst expectations for the future growth of EPS (the basis of free cash flow), it turns out that Microsoft is the favorite among peers:
Author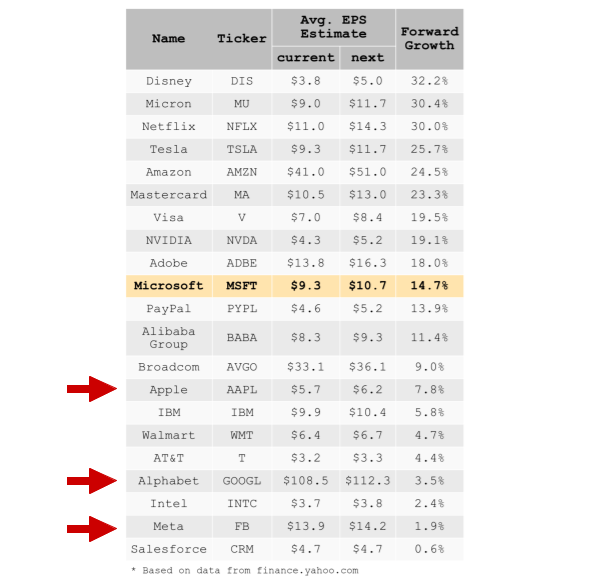
The company’s Free Cash Flow Yield is still relatively low, but I think investors are willing to put up with it, realizing that free cash flow growth is actually accelerating.
DCF modeling
This analysis would be incomplete without DCF modeling.
When predicting Microsoft’s revenue for the next decade, I proceeded from the average expectations of analysts. But, even in the historical context, I consider it adequate to expect that the average annual growth rate of the company’s revenue in the next ten years will be about 10%.
As I mentioned, the operating margin of MSFT is relatively very high now:
But when it comes to a long-term forecast, I prefer to be conservative in terms of margins. First, because the dynamics of this indicator is cyclical in nature. Secondly, where there is a high margin, competition inevitably grows. Therefore, the model includes a forecast of a gradual decrease in the operating margin to a more adequate 36%.
Here is the calculation of the Weighted Average Cost of Capital:
VisualizedAnalytics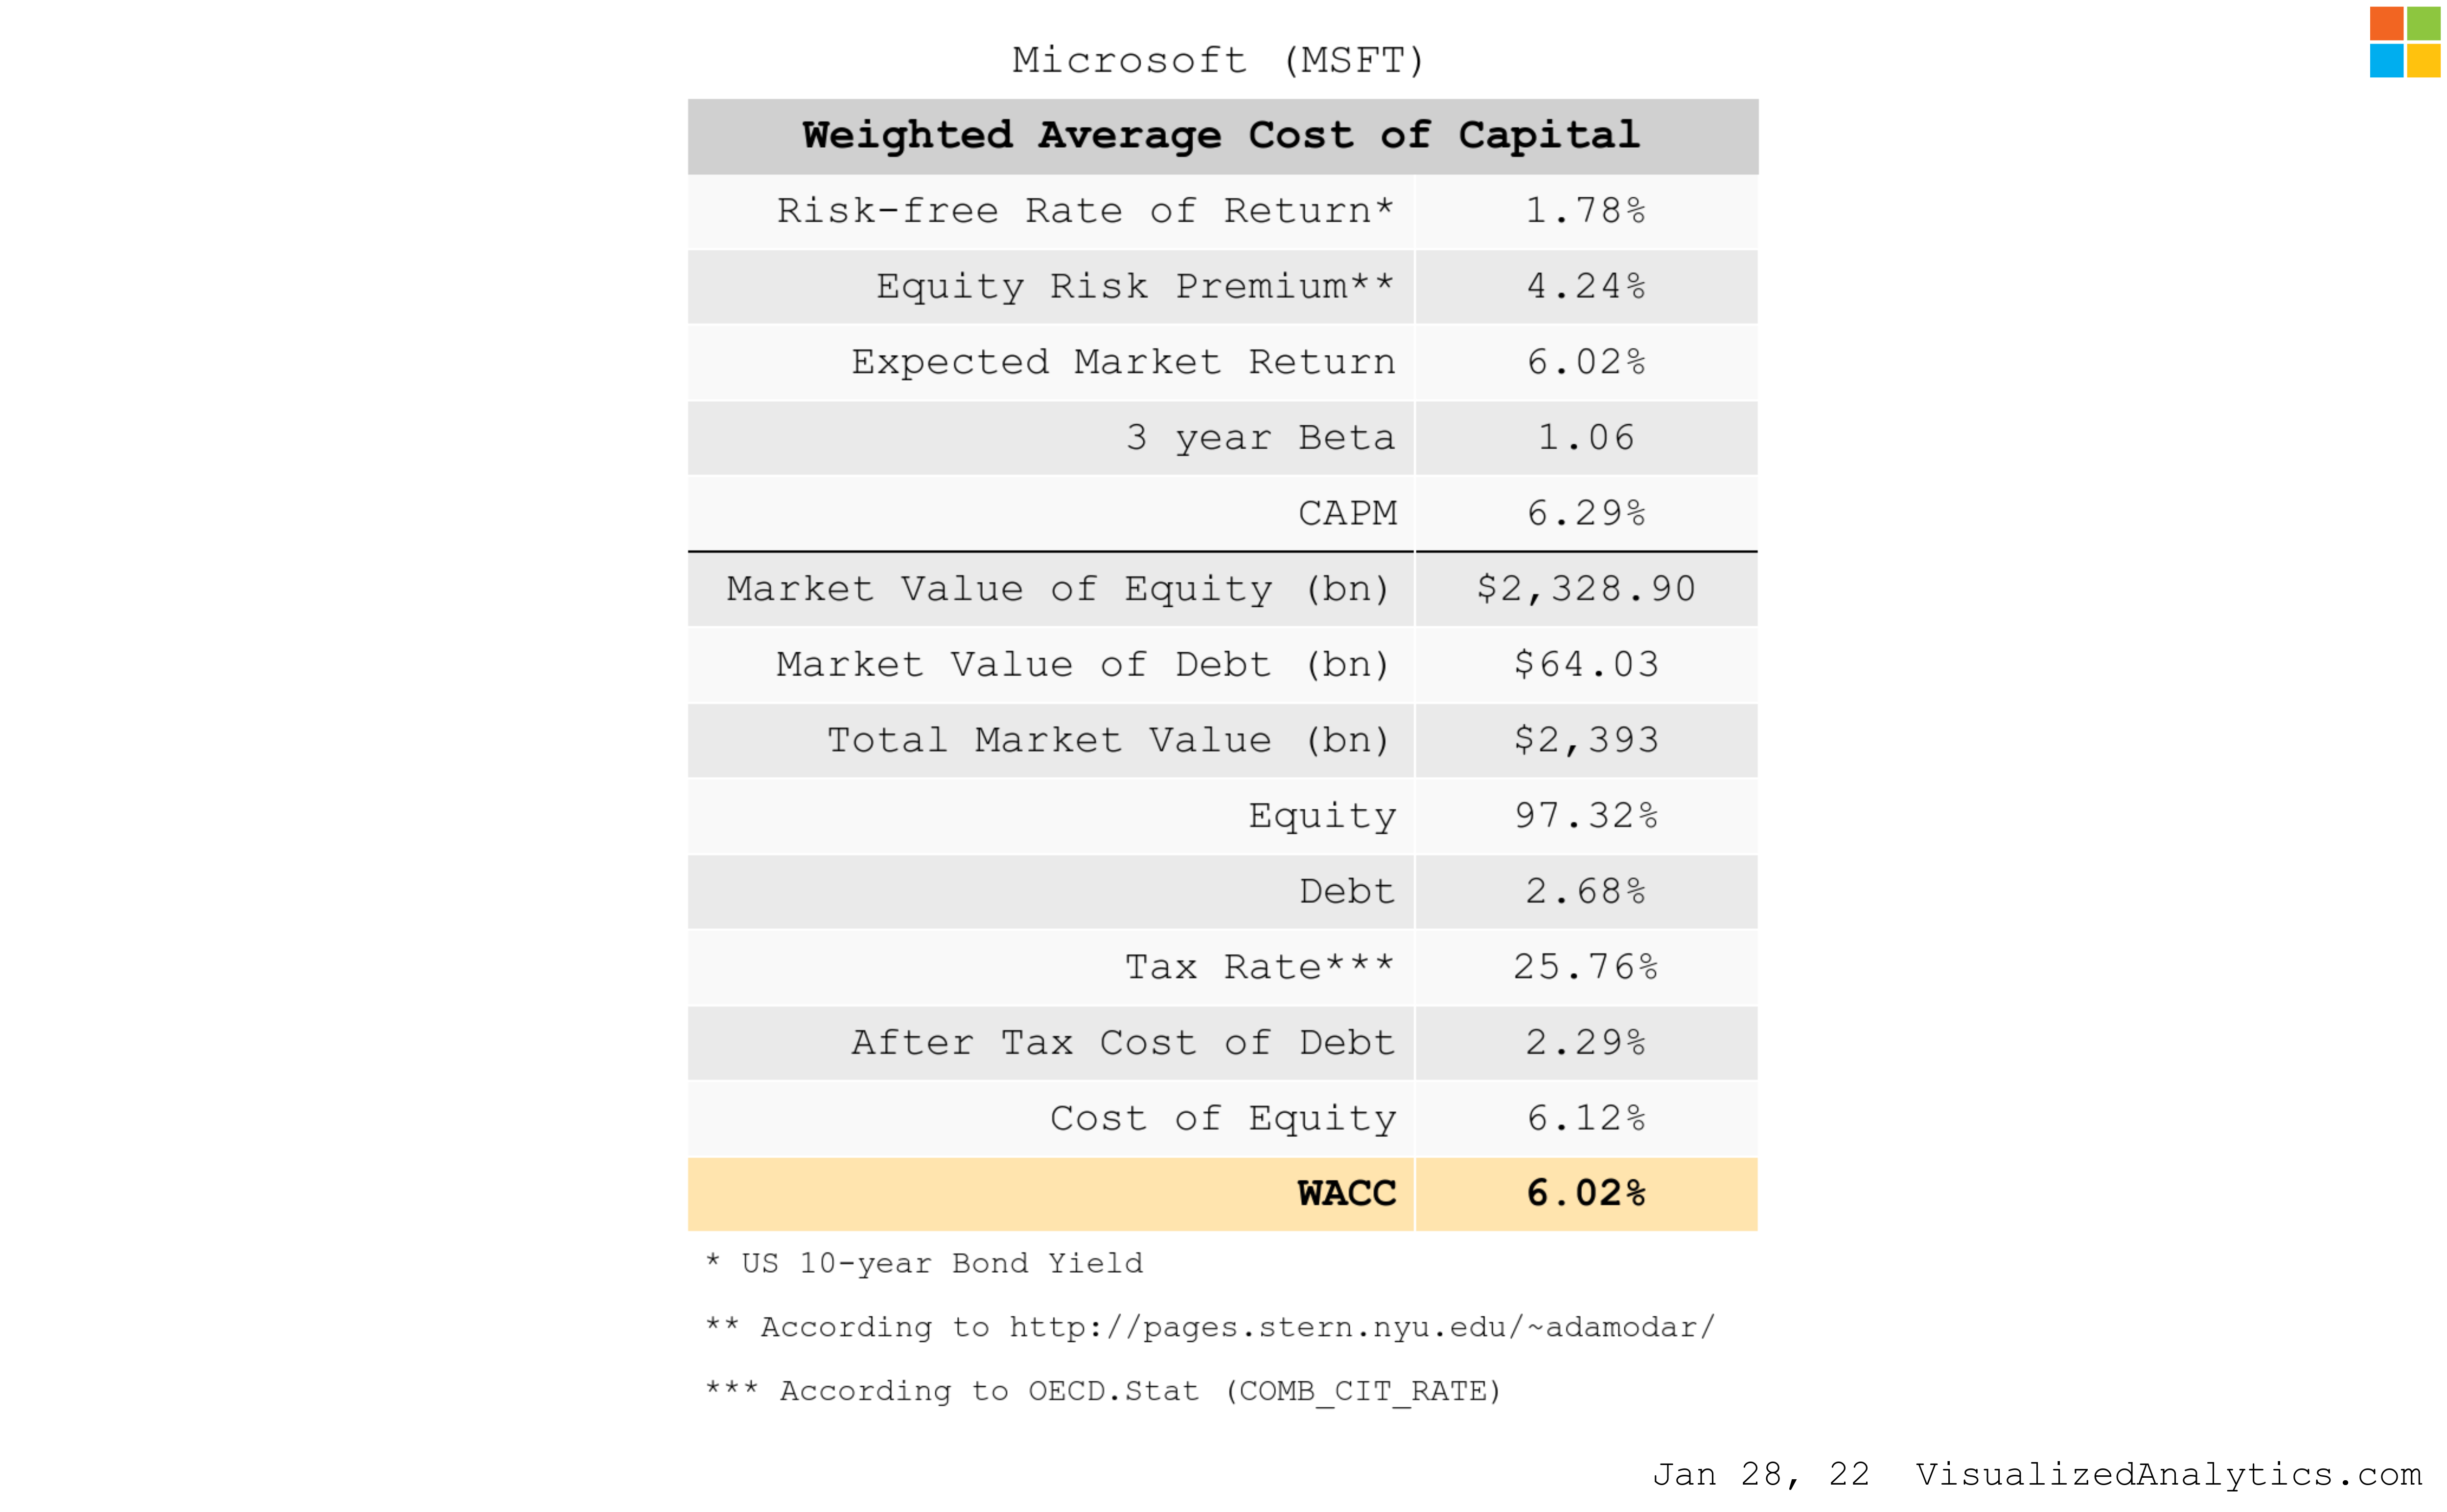
And, here is the model itself:
VisualizedAnalytics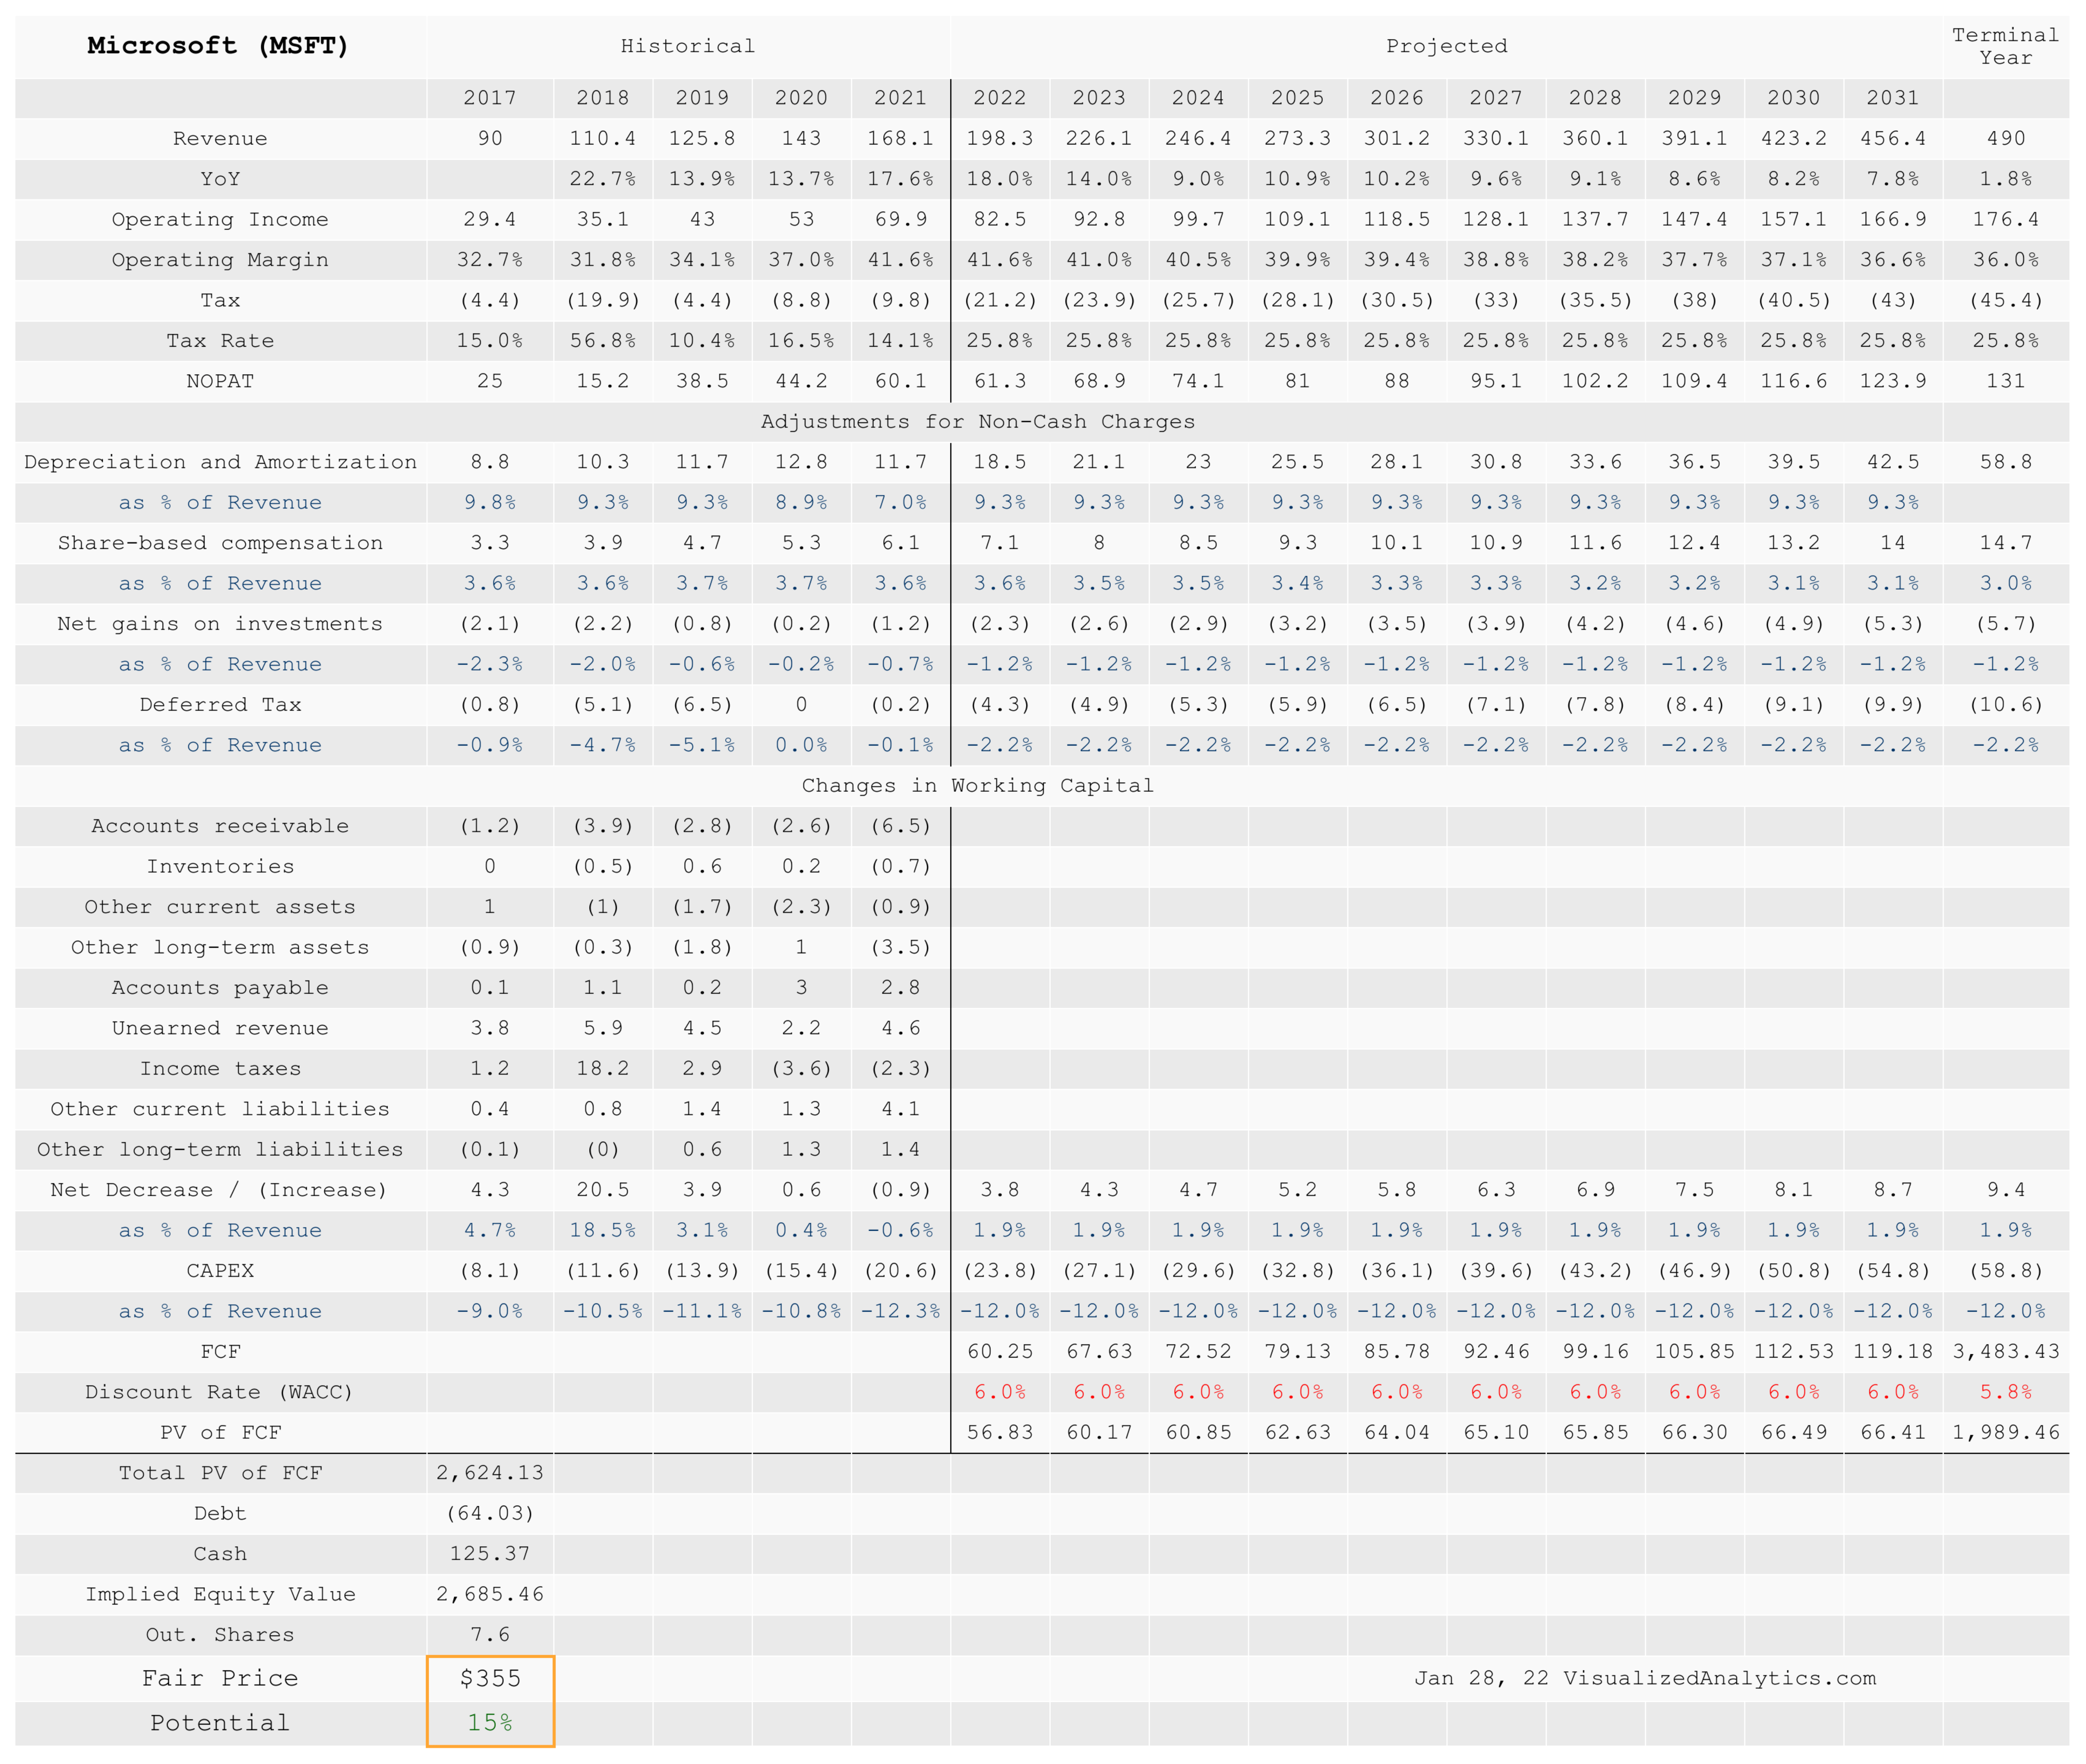
The model shows Microsoft is undervalued by 15%. This seems quite convincing.
Technical picture
I prefer to give a Buy recommendation only when both technical and fundamental analysis allow such a recommendation to be made. And in this case, personally, the technical picture still worries me.
A distinct rally in technology stocks began in late November. Specifically, in the case of Microsoft, the start of the jump was the gap that happened on November 26th. This gap determined the level of strong resistance, which the price has not been able to break through so far:
TradingView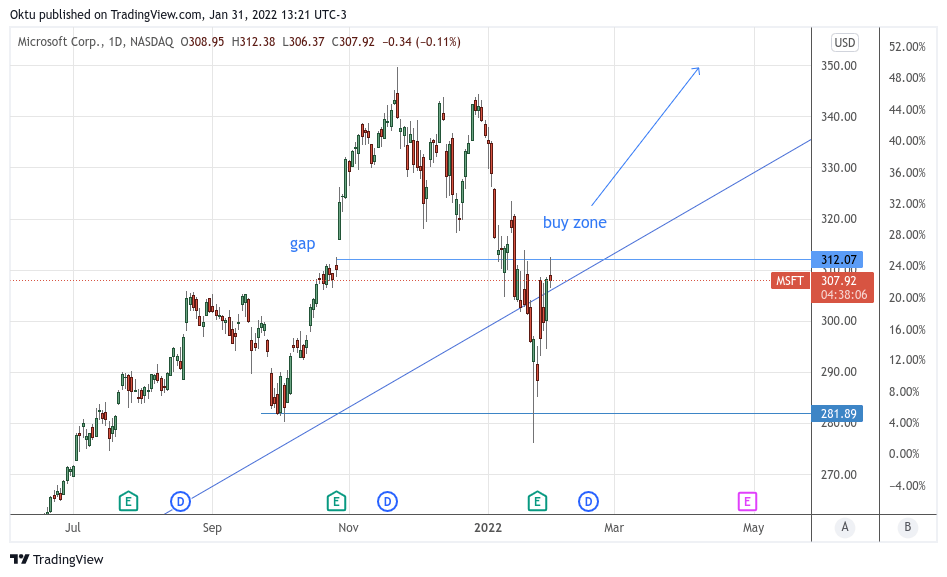
Until the price of Microsoft closes above the gap level ($312) at least twice in a row, I personally will not have strong confidence that the correction is completed. Most likely, it will happen soon, but personally I prefer to wait to be sure.
Bottom line
A nearly 20% correction and a strong quarterly report balanced Microsoft’s price and value. I think, before the next financial report is published, the price has a high chance of rising to the level of $350.
Be the first to comment