

jetcityimage/iStock Editorial via Getty Images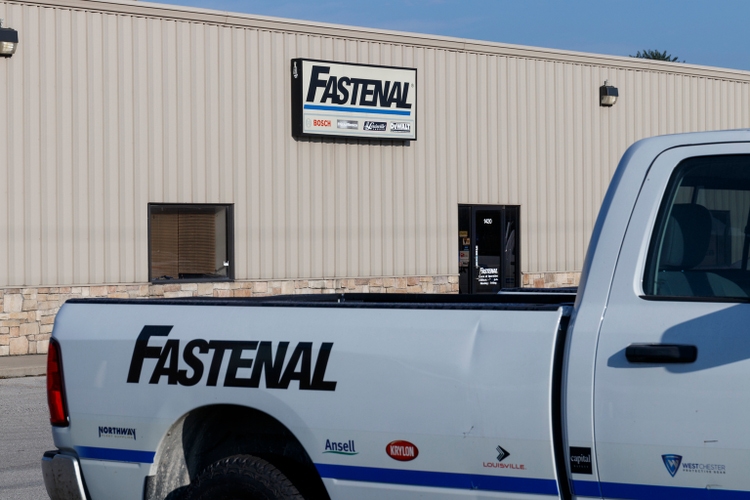
Fastenal (NASDAQ:FAST) is integral to enabling manufacturing and construction with their wide array of industrial and construction supplies. Fastenal’s operations are primarily tied to the United States although Fastenal does sell and operate in Canada, Mexico as well as other international spots.
Fastenal provides things like screws, nuts, bolts, various plumbing fittings, and electrical supplies. Additionally Fastenal provides safety items such as fall protection supplies, safety glasses, safety signage, and specialty gloves.
In addition to supplying the literal nuts and bolts of manufacturing and construction, Fastenal offers inventory management solutions for their clients. As just about any company has dealt with over the last 2.5 years, their supply chain is extremely critical to their operations and better inventory management allow for Fastenal to keep the items they need in stock when they need them.
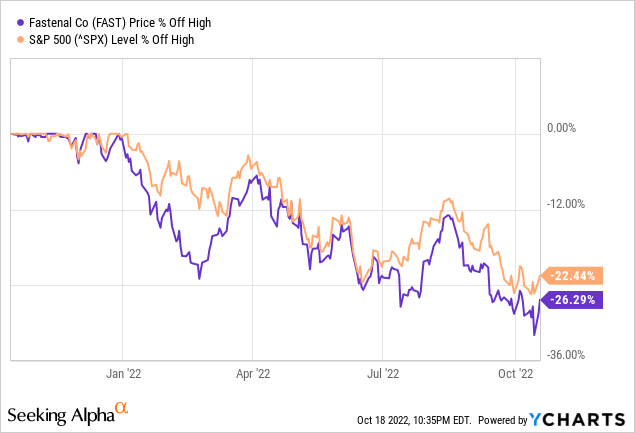
Fastenal’s share price has retreated by 22% compared to the S&P 500’s 26% pullback. I believe that Fastenal is a quality business and seeing a share price decline greater than 20% inspired me to take a further look at this business and see if now could be the time to buy.
Dividend History
The dividend growth investing strategy is what most appealed to me when I began investing my capital into individual companies. The strategy is simple, although not easy, and centers around finding quality businesses that have a history of paying and growing their dividend and don’t pay too much for the shares.
Fastenal Dividend History (FAST Investor Relations)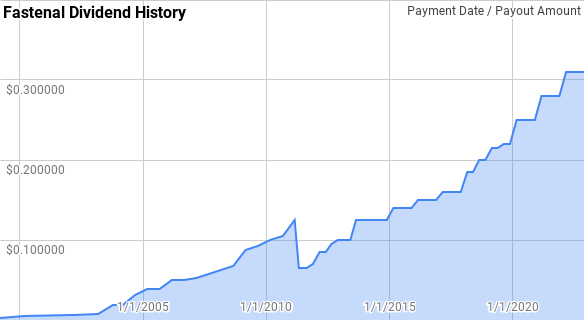
While it appears that Fastenal’s dividend growth streak ended in 2011 their streak continued on as the apparent drop was just due to a swap from paying semi-annual payments to quarterly payments. Fastenal’s dividend growth streak is now 23 years old as they approach Aristocrat status.
Since their dividend was initiated in 1999, Fastenal has given year over year dividend growth spanning from 6.7% to 320.0% with an average of 39.2% and a median of 13.9%.
There’s been 19 rolling 5-year periods during their dividend growth streak with annualized dividend growth coming in between 11.6% to 77.8% with an average of 31.0% and a median of 22.7%.
Additionally there’s been 14 rolling 10-year periods with Fastenal’s annualized dividend growth streak ranging from 12.9% to 53.4% with an average of 28.3% and a median of 20.7%.
The rolling 1-, 3-, 5-, and 10-year annualized dividend growth rates from Fastenal since 1999 can be found in the following table.
| Year | Annual Dividend | 1 Year DGR | 3 Year DGR | 5 Year DGR | 10 Year DGR |
| 1999 | $0.003 | ||||
| 2000 | $0.005 | 100.0% | |||
| 2001 | $0.006 | 12.5% | |||
| 2002 | $0.006 | 11.1% | 35.7% | ||
| 2003 | $0.026 | 320.0% | 73.8% | ||
| 2004 | $0.050 | 90.5% | 107.1% | 58.5% | |
| 2005 | $0.078 | 55.0% | 131.5% | 73.0% | |
| 2006 | $0.100 | 29.0% | 56.2% | 77.8% | |
| 2007 | $0.110 | 10.0% | 30.1% | 77.5% | |
| 2008 | $0.130 | 18.2% | 18.8% | 37.7% | |
| 2009 | $0.180 | 38.5% | 21.6% | 29.2% | 53.4% |
| 2010 | $0.205 | 13.9% | 23.1% | 21.5% | 45.0% |
| 2011 | $0.325 | 58.5% | 35.7% | 26.6% | 50.0% |
| 2012 | $0.370 | 13.8% | 27.1% | 27.5% | 50.4% |
| 2013 | $0.400 | 8.1% | 25.0% | 25.2% | 31.3% |
| 2014 | $0.500 | 25.0% | 15.4% | 22.7% | 25.9% |
| 2015 | $0.560 | 12.0% | 14.8% | 22.3% | 21.9% |
| 2016 | $0.600 | 7.1% | 14.5% | 13.0% | 19.6% |
| 2017 | $0.640 | 6.7% | 8.6% | 11.6% | 19.3% |
| 2018 | $0.770 | 20.3% | 11.2% | 14.0% | 19.5% |
| 2019 | $0.870 | 13.0% | 13.2% | 11.7% | 17.1% |
| 2020 | $1.000 | 14.9% | 16.0% | 12.3% | 17.2% |
| 2021 | $1.120 | 12.0% | 13.3% | 13.3% | 13.2% |
| 2022 | $1.240 | 10.7% | 12.5% | 14.1% | 12.9% |
Source: Author; Data Source: Fastenal Investor Relations
The dividend payout ratio is one of the simplest and quickest ways to gauge the safety and potential growth of a dividend. Comparing the dividend to either profits or cash flow allows you to see how much buffer there is for the inevitable business specific or economy-wide issue to weigh on the business before jeopardizing the dividend.
FAST Dividend Payout Ratios (FAST SEC filings)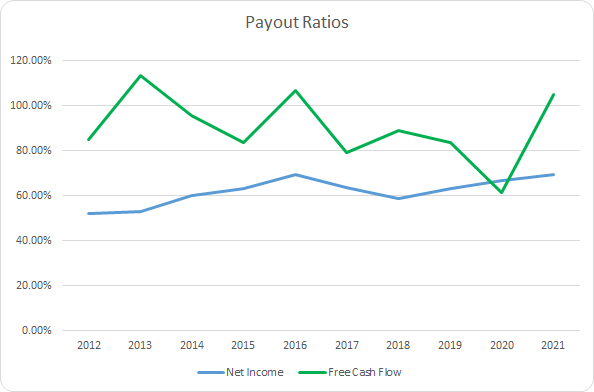
Fastenal’s net income payout ratio has averaged 62.0% for the last 10 years and 64.4% for the last 5 years. Meanwhile, the average free cash flow payout ratios are 90.2% and 83.6%, respectively.
Fastenal’s earnings-based payout ratio suggests that dividends are well covered; however, the free cash flow-based payout ratio suggests that dividends are quite stretched here.
Quantitative Quality
Finding and investing in high quality businesses makes market volatility much easier to stomach. Knowing that the business is sound allows me to sleep well at night.
FAST Revenue Profits and Cash Flows (FAST SEC filings)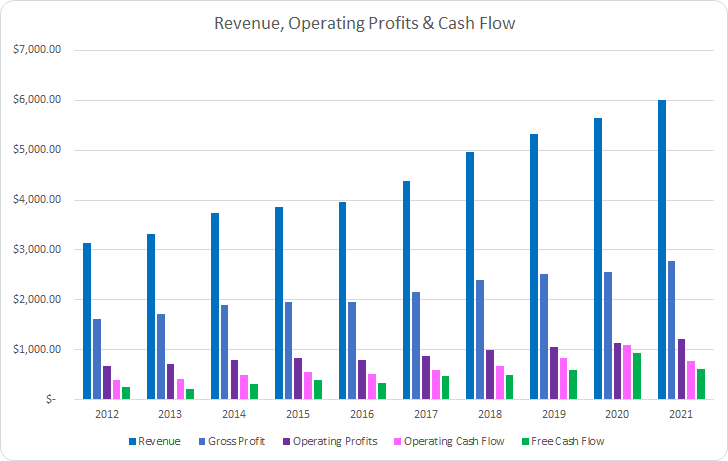
Fastenal’s financials look strong as it’s been a steady march higher over the last decade. Revenues grew by 91.8% in total between FY 2012 and FY 2021 or 7.5% annualized. Gross profits lagged behind climbing just 72.0% or 6.2% annualized.
Operating profits also lagged revenue growth, although they fared better than gross profits, improving by 80.8% in total or 6.8% annualized. However, operating cash flow rose by 94.3% or 7.7% annualized. Most importantly Fastenal’s free cash flow increased by 137.9% or 10.1% annualized.
My expectation is that a business will be able to defend its margins over time as competitors try to encroach on them. I prefer to see a free cash flow margin greater than 10%; however, the trajectory of those margins is equally important.
FAST Margins (FAST SEC filings)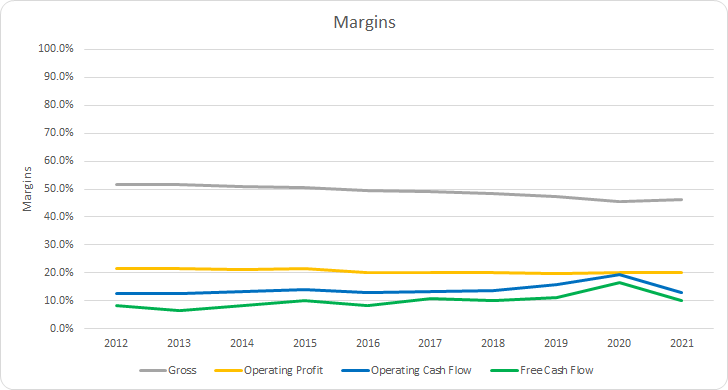
Fastenal’s gross margins have been under pressure falling from 51.5% in FY 2012 to 46.2% for FY 2021. The 10-year average gross margin for Fastenal is 49.0% with the 5-year average at 47.3%.
Despite gross margins falling Fastenal has been able to improve their free cash flow margins over that same period. Fastenal has also been able to surpass the 10% free cash flow margin level in 6 of the last 10 years and for each of the last 5. The 10-year average free cash flow margin is right at 10.0% with the 5-year average at 11.7%.
An alternative method of profitability is the return on some measure of assets of capital. These allow you to see how efficient a business is able to use its capital base to generate free cash flow. Similar to the margins, I want to see improving free cash flow returns over time and preferably greater than 10%.
FAST Free Cash Flow Returns (FAST SEC filings)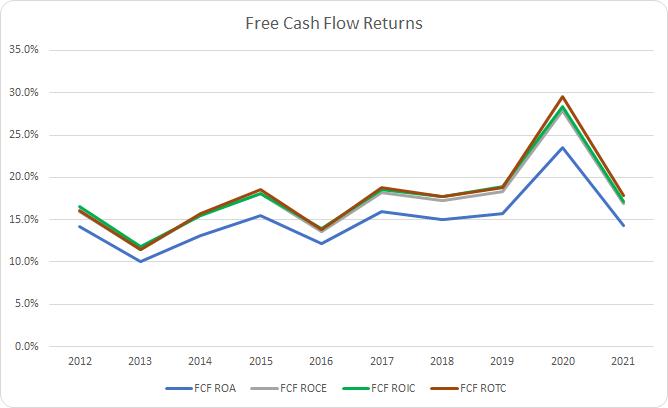
Fastenal’s free cash flow returns have been on the rise although there is year to year variability. The 10-year average free cash flow ROA is an impressive 15.0% with the 5-year average at 16.9%. Fastenal’s free cash flow return on invested capital has similarly been improving with a 10-year average of 17.7% and a 5-year average of 20.1%.
To understand how Fastenal uses its free cash flow I calculate three variations of the metric, defined below:
- Free Cash Flow, FCF: Operating cash flow less capital expenditures
- Free Cash Flow after Dividend, FCFaD: FCF less total cash dividend payments
- Free Cash Flow after Dividend and Buybacks, FCFaDB: FCFaD less net cash used on share repurchases
FAST Free Cash Flows (FAST SEC filings)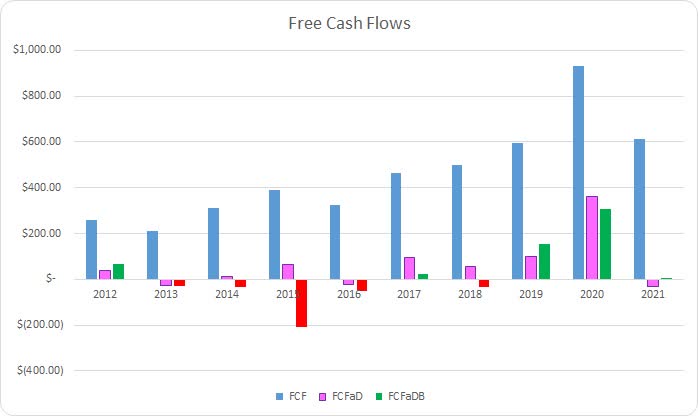
Between FY 2012 and FY 2021 Fastenal generated a cumulative total of $4.6 B in FCF. They have also sent back $4.0 B to shareholders in dividends over that time, which puts the total FCFaD for that period at $0.6 B. Additionally Fastenal has used a net total of $0.4 B repurchasing shares. That brings the cumulative FCFaDB to $0.2 B for the last decade.
Fastenal has heavily favored dividends to share repurchases spending roughly 8.9x on dividends compared to net repurchase activity. Between FY 2012 and the FY 2021 the share count declined by just 2.9% in total or ~0.3% annualized. Excluding FY 2015 and FY 2016 the average annual reduction is just 0.02% across the remaining 8 years.
FAST Shares Outstanding (FAST SEC filings)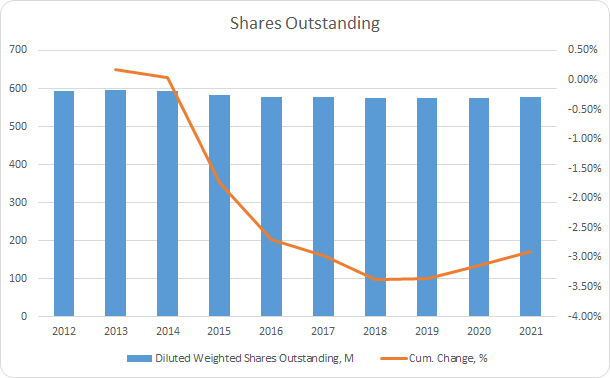
When I choose to make an investment in a business my target holding period is measured in years and preferably forever as long as the business continues to perform to my expectations. As such I want to see that the balance sheet does not appear excessively leveraged.
FAST Debt to Capitalization (FAST SEC filings)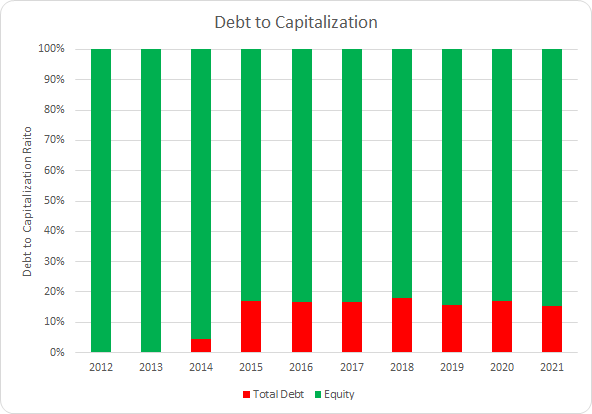
From a capital structure standpoint Fastenal has a very conservative balance sheet. While debt has increased over the last decade, it’s been a relatively modest increase. The 10-year average debt-to-capitalization ratio for Fastenal is just 12% with the 5-year average coming to 16%.
Additionally I examine the net debt ratios which I believe give a better idea of the leverage placed upon the underlying business. The net debt ratios compare the level of net debt compared to some measure of profits or cash flow. In essence the net debt ratios let you know how quickly the business could de-lever its balance sheet assuming no material changes to the underlying business.
FAST Debt Ratios (FAST SEC filings)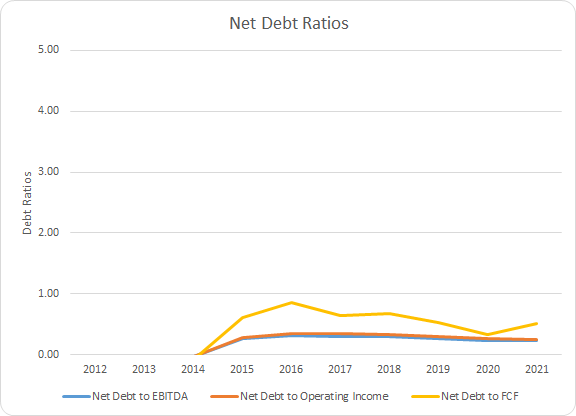
With a relatively little debt on the books it shouldn’t come as a surprise that Fastenal’s net debt ratios look quite strong. The 10-year average net debt-to-EBITDA, net debt-to-operating income, and net debt-to-FCF ratios are 0.2x, 0.2x, and 0.3x, respectively. Accordingly, the 5-year averages are 0.3x, 0.3x, and 0.5x. From a balance sheet perspective Fastenal appears to not be at risk of rising interest rates that are bound to hurt other companies and is built to weather any upcoming recession.
How Did We Get Here?
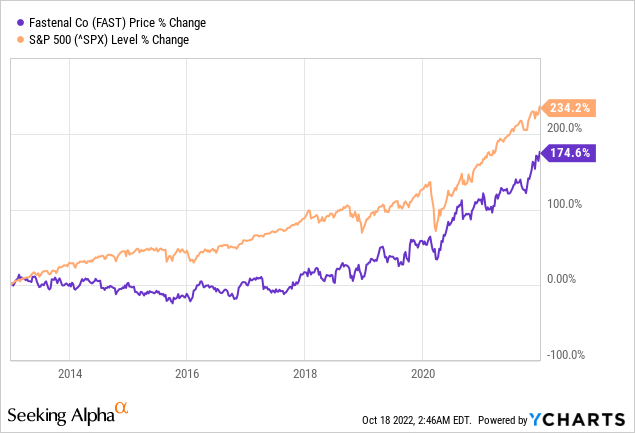
Between December 31, 2012 and December 31, 2021 Fastenal’s share rose 174.6% in total which works out to a solid 10.6% annualized rate over that time. Unfortunately, that has trailed behind the S&P 500 which delivered a 234.2% increase. Adding in the dividend yield of 1.6% at the start of the period and Fastenal’s CAGR for that stretch is a solid 12.2%.
Over time it’s the performance of the business that should be the biggest factor in the returns that investors earn. I’ve broken down the 12.2% CAGR for Fastenal over the above period into business returns, capital allocation returns, and sentiment change.
- Business Returns: Measured as annualized revenue growth rate plus annualized change in net profit margin
- Capital Allocation Returns: Measured by dividend yield plus annualized change in share count
- Sentiment Change: Measured by annualized change between starting and ending P/E multiple
This analysis is not perfect as you’re examining two seemingly arbitrary points in time. Additionally, the returns could be distilled down into even smaller components; although, I believe this exercise gives insight into what kind of returns the underlying business justified and gets us roughly right.
As we saw earlier Fastenal managed to grow revenues at a 7.5% annualized rate. The net profit margin rose from 13.4% to 15.4% during that time which works out to a 1.5% annualized rate. That brings the business return attribution to +8.5% annualized.
The share count fell by 0.3% annualized during that time due to modest share repurchases. Adding that to the initial dividend yield of 1.6% and the capital allocation return justification comes to +1.9% annualized.
For the sentiment change I used the share price as of the closing date of the respective fiscal year with the EPS for that full year. Surprisingly, Fastenal’s P/E multiple rose from an already lofty 33.0x to 40.0x over that time which works out to a +1.8% contribution for sentiment change.
| Annualized Returns | % of Returns | |
| Business Returns | 8.5% | 70% |
| Capital Allocation Returns | 1.9% | 15% |
| Sentiment Change | 1.8% | 15% |
| Total Annualized Returns | 12.2% |
Source: Author
The bulk of returns over that time came from business performance which accounted for ~70% of the CAGR. Adding in the capital allocation returns brought the justified returns up to 10.4% annualized and ~85% of the returns. Sentiment change accounted for the remaining 15% despite an already lofty multiple at the beginning of the period.
FAST Return Breakdown (FAST SEC filings)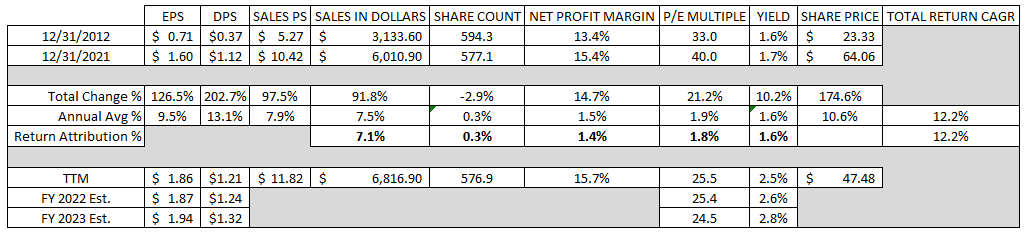
Valuation
As your investment horizon extends business quality should be the larger determinant of your investment returns. However, I still want to avoid the situation of overpaying even for a quality business. I utilize 3 valuation methods to try and home in on valuation range for the businesses I examine.
Dividend yield theory is a simple valuation method that operates under the assumption that investors will value a business, over time, such that it offers a dividend yield around a certain level. For Fastenal I’ll use the 3-year average forward dividend yield as a proxy for fair value.
Fastenal Dividend Yield Theory (FAST Investor Relations and Google Finance)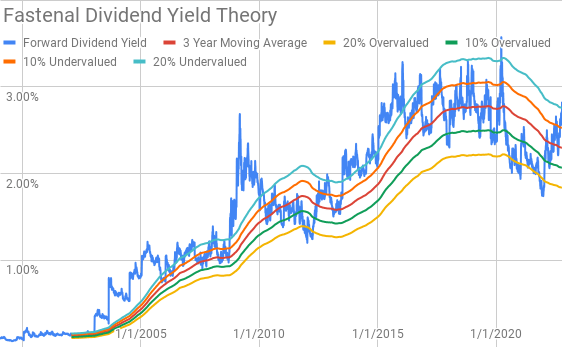
While volatile, Fastenal has seen its dividend yield trend back to between around 2.5% to 3.0% since around 2015. The 20% undervalued yield band has also typically been an area that has represented potentially undervalued levels and offered an increase in price over the short- to intermediate-term back to the 3-year average or below.
Fastenal shares currently offer dividend yield of 2.61% compared to the 3-year average forward dividend yield of 2.30%.
A reverse discounted cash flow analysis is a method of valuing a business to find what kind of expectations are built into the current market valuation. By starting with the current valuation, you can figure out what kind of growth and margins the business must have in order to generate the cash flows that support that valuation.
I used a simplified DCF model based on revenue growth, an initial free cash flow margin of 9.1% that improves to 13.0% during the forecast period. The terminal growth rate is estimated at 4.0%.
For the discount rate I’ve used an estimated after-tax cost of 1.6% with a cost of equity of 10% and 8%. That yields a discount rate of 9.8% and 7.9%, respectively.
In the 10% cost of equity / 9.8% discount rate scenario Fastenal needs to grow revenues 13.5% annualized through FY 2031 to generate the cash flows that justify the current market valuation. Even lowering the cost of equity assumption to 8.0% and the discount rate to 7.9% requires Fastenal to grow revenues 7.2% annualized during the forecast period.
The MARR analysis involves estimating the future earnings and dividends that a business will generate. You then apply a reasonable, and hopefully conservative, multiple on those future earnings such that you can determine what the future share price might be. If the expected return is greater than your threshold for investment then you can feel free to invest in the business.
Analysts expect Fastenal to report FY 2022 EPS of $1.87 and FY 2023 EPS of $1.94. They also expect Fastenal to be able to grow EPS at a 7.0% annualized rate over the next 5 years. I then assumed that Fastenal’s earnings growth would slow to just 5.0% annually for the following 5 years. Dividends are assumed to target a 65% payout ratio.
Fastenal has traded at a premium TTM multiple during the last decade. Over that time the TTM multiple has ranged from roughly 20.0x to 35.0x. For the MARR analysis I’ll examine terminal multiples that span that range.
The following table shows the internal rates of return that Fastenal might produce if they are able to grow at the assumed rates from above. Dividends are assumed to be paid and increased along the timeline that Fastenal has typically followed. Returns assume that shares are purchased at $47.48, Tuesday’s closing price.
| IRR | ||
| P/E Level | 5 Year | 10 Year |
| 30 | 12.3% | 10.0% |
| 25 | 8.7% | 8.3% |
| 22.5 | 6.6% | 7.3% |
| 20 | 4.4% | 6.2% |
| 17.5 | 2.0% | 5.1% |
| 15 | -0.7% | 3.8% |
Source: Author
Alternatively, I use the MARR analysis framework to work backwards and determine the maximum price I could pay for shares today in order to generate the returns that I seek from my investment. My base hurdle rate is a 10% IRR and for Fastenal I’ll also examine 12% and 8% return thresholds.
| Purchase Price Targets | ||||||
| 10% Return Target | 12% Return Target | 8% Return Target | ||||
| P/E Level | 5 Year | 10 Year | 5 Year | 10 Year | 5 Year | 10 Year |
| 30 | $53 | $47 | $48 | $40 | $58 | $56 |
| 25 | $45 | $41 | $41 | $35 | $49 | $49 |
| 22.5 | $41 | $38 | $38 | $33 | $45 | $45 |
| 20 | $37 | $35 | $34 | $30 | $40 | $41 |
| 17.5 | $33 | $32 | $31 | $28 | $36 | $38 |
| 15 | $29 | $29 | $27 | $25 | $32 | $34 |
Source: Author
Conclusion
Fastenal is a great and high-quality business and one that I’m glad I own because my confidence in the underlying business is strong. Fastenal has shown strong revenue growth during the last decade that has traditionally come with relatively higher margins that have been improving over that time.
Additionally, Fastenal’s free cash flow return metrics have generally been rising, which is what I would expect from a quality business. During the last decade Fastenal has not typically utilized share repurchases; however, given the high level of dividends with respect to free cash flow there has not been much capacity to do so without leveraging the balance sheet.
Dividend yield theory suggests a fair value range for Fastenal between $49 and $60. At a current share price of $47.48 that means shares are trading on the lower end of fair value.
Meanwhile the reverse DCF implies that 10% returns are not likely unless you expect very strong growth or margin improvement in the future. While I believe margins should improve over time, I’m skeptical that Fastenal can grow rapidly enough to justify the current market valuation. The reverse DCF seems to show that even 8% returns are likely a best-case scenario from current prices which offers no margin of safety considering the potential macro headwinds.
The MARR analysis isn’t quite as dire; however, it’s not that rosy either. Based on a 10% IRR target 5 years out and a terminal P/E ratio between 17.5x and 22.5x, Fastenal’s fair value range comes to $33 to $41. At an 8% return target the range rises to $36 to $45.
Regarding share repurchases, Fastenal has not typically reduced their share count in significant size. However, during Q3 FY 2022 they did repurchase 2MM shares at an average price of $47.68 during July, although no additional buybacks were made throughout the remainder of the quarter.
There’s currently 200k shares left on that authorization and Fastenal recently added an additional 8 MM share authorization. Given the lack of repurchases during August and September, it would appear that management thinks the $47.68 level was attractive. Fastenal’s share price has been around that level or lower since roughly mid-September so it will be interesting to see future repurchase activity once it’s reported.
As industrial, construction, and manufacturing activity goes so goes Fastenal. During the Q3 earnings release management is beginning to express caution about the short- to intermediate-term.
I’m quite confident in the longevity of Fastenal’s business and cash flows because there’s little that can be done to disrupt things like screws, nuts, bolts, washers and the like, which make up a large percentage of their sales.
Fastenal does have a very strong balance sheet that should allow them to weather just about any economic storm thrown at them. That balance sheet also allows for plenty of flexibility for Fastenal should a recession come to pass to be able to come out stronger on the other side with potentially new products lines or market share via acquisitions.
However, the stock is a different matter. Between the three valuation methods we get very mixed results. Dividend yield theory says that shares are on the lower bound of fair value. Meanwhile the reverse DCF and MARR analysis shows that shares are likely on the upper end of fair value if not overvalued depending on how aggressive you want to get with your requirements.
I’m glad that I own a stake in Fastenal, although admittedly I jumped the gun a bit on my initial purchase. Given the rising risks of a recession and what I believe is a rich valuation, I would refrain from adding more to my Fastenal position until we see a share price in the low-$40s, preferably lower.
Be the first to comment