

Diego Thomazini
Volatility is perking back up, but only modestly so. With the VIX hovering near 20, it’s simply near its long-run average. Moreover, big tech earnings are now in the rear-view mirror, so vol on the Nasdaq 100 would be expected to be somewhat tame. One popular ETF aims to capitalize on elevated near-term implied volatility on the Nasdaq 100 and/or just a sideways to even slightly downward price action on the QQQ.
According to the issuer, the Global X Nasdaq 100 Covered Call ETF (NASDAQ:QYLD) follows a “covered call” or “buy-write” strategy, in which the Fund buys the stocks in the Nasdaq 100 Index and “writes” or “sells” corresponding call options on the same index.
QYLD had a banner 2022, outpacing the QQQ by 20 percentage points. In a year where moves were big and higher interest rates creamed long-duration megacap tech names, QYLD shined. Of course, that followed 2021 which saw QQQ beat QYLD by more than 15 percentage points (total return data used in both comparisons). So does a flip of the calendar really make a difference? Of course not, but trends matter. So far in 2023, QQQ is up 13% versus an 8% holding period return on QYLD.
On the 2-year zoom, we find that QYLD is fractionally better than QQQ, but overall volatility—at least in terms of drawdowns—is far tamer with the buy-write play on the Nasdaq 100. So, risk-averse investors might be well served being long QYLD rather than QQQ.
QYLD: Better Risk-Adjusted Returns Last 2 Years vs QQQ
Stockcharts.com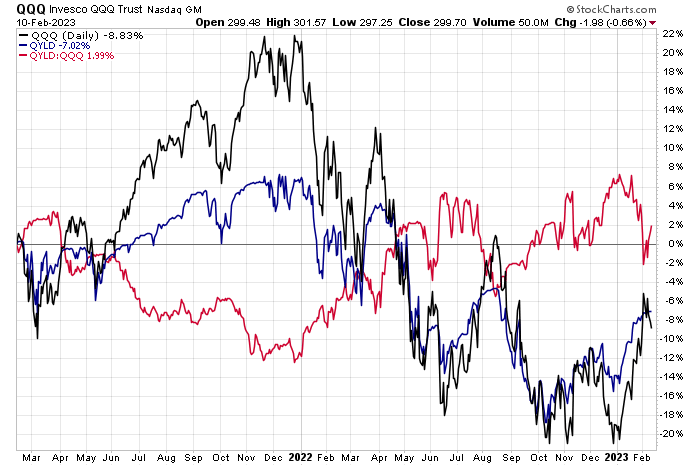
But is now a good time for investors writ large to get on board the covered call ETF? Let’s attempt to spot some clues.
For one thing, volatility often jumps about right now through mid-March according to 20-year seasonality trends put together by Equity Clock. In that analysis, 2003, 2008, 2009, and 2020 all contribute in a big way to the average, but the data is the data. The implication here is that volatility could spike up. That means two things for QYLD: options premium could turn more expensive (which would be bad in isolation for a buy-write play), but higher overall volatility usually accompanies lower stock prices – bullish for QYLD on a relative basis to QQQ. In my book, seasonal trends suggest going for QYLD here rather than the more aggressive QQQ.
Volatility Tends to Rise Now Through Mid-March
Equity Clock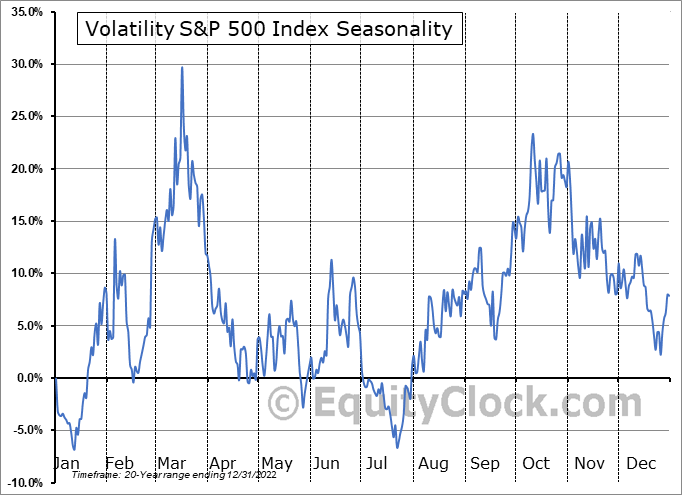
What’s more, I noticed that the market’s SKEW is high right now. That means the price of put protection is much higher than on call speculation. So, selling calls does not generate as much income as, say, writing puts. Perhaps being long QYLD while selling downside puts on QQQ is a savvy move – effectively a collar trade.
An Elevated S&P 500 SKEW
Bloomberg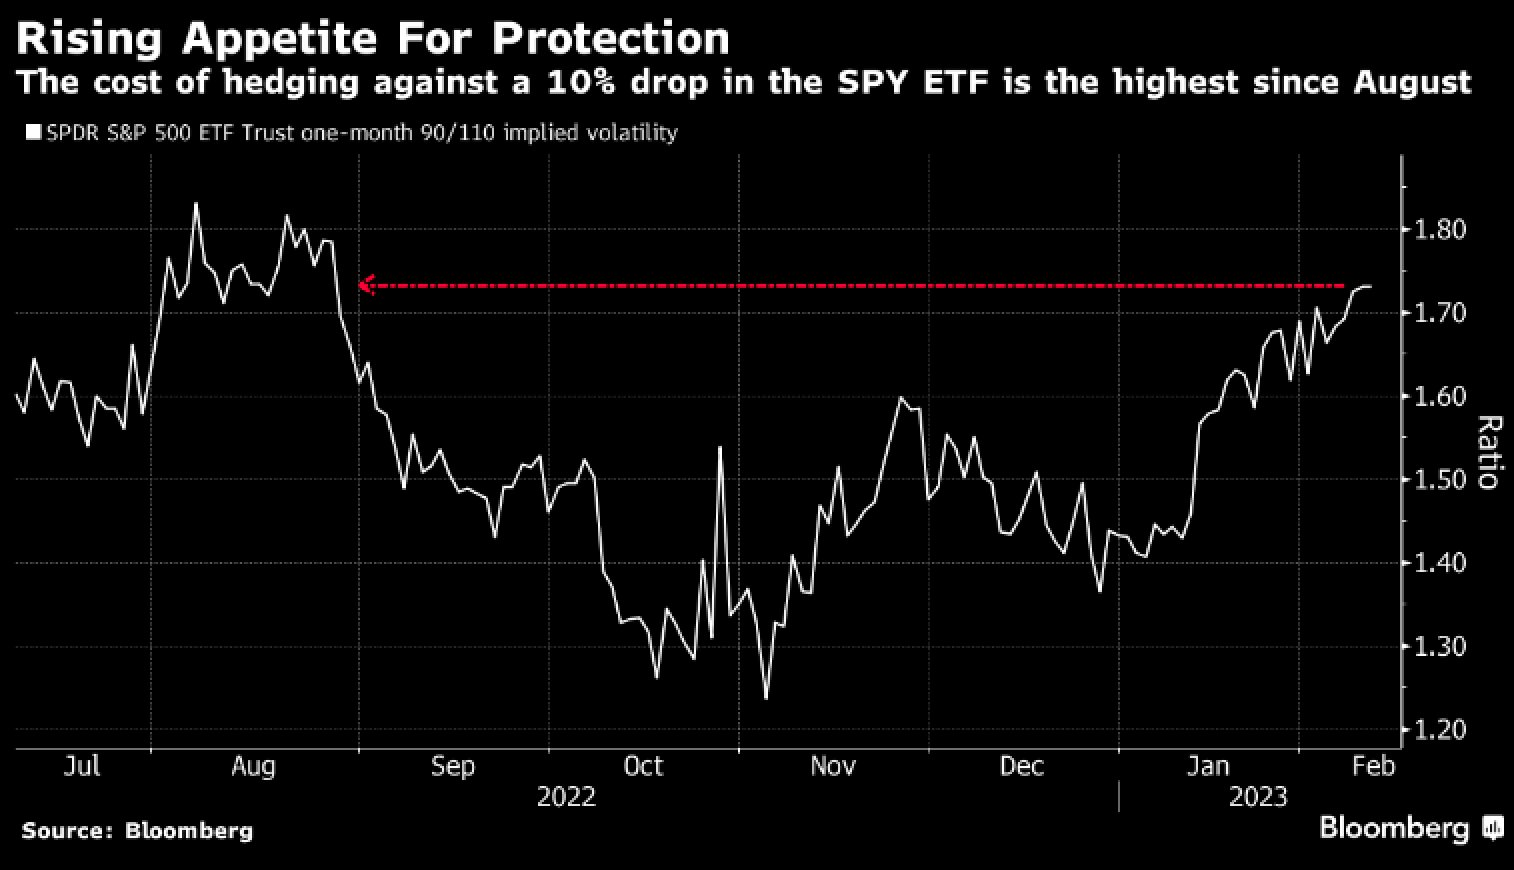
But let’s look at IV on QQQ specifically. Notice in the chart below that volatility looking out 30 days is relatively muted at just 26%. Over the last year, it has ranged from 22% to above 40%. So, options are cheap today, but historical volatility has simply matched where expected volatility is priced, so that appears to be fair value to me. It may sound like I am wishy-washy here, but I’m simply weighing all the evidence at hand.
QYLD Analysis: Interpreting IV on QQQ
Fidelity Investments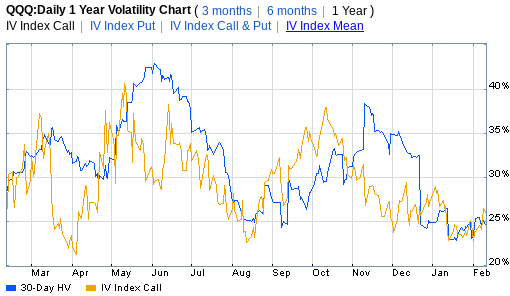
One more chart: a 1-year graph of QQQ. The Nasdaq 100 ETF has busted its downtrend after holding the October low on two occasions. Additionally, the 200-day moving average is beneath the current price, and it is beginning to flatten. A bullish golden cross of the 50-day moving average over the 200-day may come later this month, too. $297 is support while $334 is resistance.
QQQ Technicals: Broken Downtrend, Testing Support
Stockcharts.com
The Bottom Line
I am a hold on QYLD. On an absolute basis, you’re not generating a ton of income now compared to the average of the past year. Relative to QQQ, we sometimes see volatility strike during the back half of February into mid-March, so that would favor a defensive play like QYLD over QQQ. Beyond the next 6 weeks, however, QQQ appears poised to continue its breakout and beat QYLD.
Be the first to comment