

orpheus26/iStock via Getty Images
Investment thesis
In my previous article in April, on BlackRock’s iShares MSCI Singapore ETF (NYSEARCA:EWS) titled “Solid As A Rock” I continued to give it a Hold stance as I thought it was valued too high.
At that time, it had a P/E of 20.35 and a Price to book value of 1.47.
A catalyst would be a more attractive entry level in the future.
It has not gone down much since April this year when my last assessment of EWS came out. At that time, the share price was USD 20.14 and it is now USD 18.65, a reduction of 7.4%.
However, it is a good time to look at how the main components of EWS’s portfolio are performing.
Here is a review of the performance of the 10 largest holdings in EWS and a peek at how the economy in Singapore is doing.
Mid-year review of EWS main components
1. DBS (OTCPK:DBSDY)
DBS logo (DBS)
The bank’s net profit for FH 2022 was SGD 3.6 billion, which was 3% lower compared to what it was in FH 2021.
I regularly write articles on Southeast Asia’s largest bank. You can check out their latest performance here.
12 months trailing P/E is 12.5 and P/NTBV is 1.49
I am long DBS.
2. Sea Limited ADS (SE)
SEA logo (SEA)
Last year their share price went up 38% with the share price reaching its peak at USD 365 in October. Investors finally decided that they wanted companies that make money, not burn it.
The company lost USD 1 billion in this quarter, down from USD 1.4 billion the previous quarter and another USD 1.6 billion in Q4 of last year. At least the huge losses are shrinking, quarter by quarter. In September last year, they sold 11 million shares at USD $318 per share. I bet those who bought them now have “buyer’s remorse”, as it is presently worth only USD 64.75
Their cash and cash equivalent were reduced by USD 2.76 billion over the last six months. As of the 30th of June, it stood at USD 6.49 billion.
The price of SEA is down 79% over the last year.
12 months trailing P/E is N/M as it lost USD 1.03 per share just in Q2 and P/Book is 7.6
3. Oversea-Chinese Banking Corporation (OTCPK:OVCHF)
OCBC logo (OCBC)
Their FH 2022 net profit rose by 7% to SGD 2.84 billion. Their ROE was 11% and their NPL ratio is 1.3%.
The bank is well funded with a CET1 capital ratio of 14.9%. The board decided to increase the interim dividend from SGD 0.25 to SGD 0.28 which leaves shareholders with a yield of 4.6%. This is in line with its Singapore peers.
12 months trailing P/E is 10.91 and P/NTBV is 1.07
4. United Overseas Bank (OTCPK:UOVEF)
UOB logo (UOB)
UOB Group delivered a net profit of SGD 2.01 billion for FH 2022 which was unchanged from what they delivered in 2021. As with all other banks, interest income increased. For UOB this added SGD 442 million to the net profit. However, it was partly offset by lower fees and other income of SGD 283 million.
12 months trailing P/E is 11.21 and P/NTBV is 1.12
5. Ascendas REIT (OTCPK:ACDSF)
Ascendas REIT logo (Ascendas)
Ascendas REIT is a part of Capitaland Investment. You can find my recent coverage of Capitaland Investment here.
It is Singapore’s first and largest industrial real estate investment trust with a portfolio of SGD 16 billion worth of properties. You might think that industrial real estate is just warehouse properties but, in fact, the bulk of what Ascendas owns are business spaces like offices and life science spaces.
The portfolio is globally spread out with 95 located in Singapore, 48 in the U.S., 36 in Australia, and 49 in the U.K. and Europe. The total occupancy is 92.6% with a WALE of 3.7 years.
It has a healthy balance sheet with a gearing ratio of 36.8% with a weighted average cost of debt of 2.1%.
They managed to increase DPU to Singapore cents 7.873 for FH 2022 from 7.660 the year before.
As with all other REITs in Singapore, there is a dilution of shareholders’ shares taking place each year as they all issue millions of shares to pay a large part of the distribution and all of their management fees. This occurs regardless of the price of the units. The lower the price, obviously the more units they all have to issue.
12 months trailing P/E is 13.21 and P/NTBV is 1.25
6. Keppel Corporation (OTCPK:KPELF)
Keppel Corp. logo (Keppel Corporation)
Keppel Corporation started out as a shipyard in Singapore to cater to repair and some shipbuilding. Thanks to Singapore’s extremely attractive geographical position with more than 70,000 ships passing by every year to repair ships.
Over the years they have diversified their businesses. Apart from now having a global network of yards, it is also involved in owning and operating energy and infrastructure solutions and services. That includes data centers.
Their division “Offshore and Marine” faced headwinds over the past few years. In 2020 the Group had to make an impairment of SGD 952 million. In that year they decided to exit the offshore rig building business, after completing existing uncompleted rigs. They also started to exit progressively low value-adding repairs and other activities. China has taken over the bulk of this market.
These changes are starting to bear fruits as their latest financial results showed that in the FH of 2022 their net profit improved by 66% to SGD 498 million.
12 months trailing P/E is 10.19 and P/NTBV is 1.05
7. Singtel (OTCPK:SGAPY)
Singtel logo (Singtel)
2021 started with the changing of their CEO, as Ms. Chua Sock Koong, who had held the position for 13 years, retired, and the board decided on Mr. Yuen Kuan Moon to succeed her. He had earlier been their Singapore consumer business CEO and chief digital officer.
Under his leadership, the company has done quite well. In their last FY, which is based on accounts ending 31st of March 2022, the company delivered an underlying net profit of SGD 1.92 billion, which was an improvement of 11% from the year before,
Their ROE improved from just 2.1% to 7.3% year on year.
Singtel has always been generous with its dividend payout. This led to some analysts questioning the sustainability of such high payout ratios. Their current dividend policy is to distribute 60-80% of underlying net profits.
12 months trailing P/E is 22.46 and P/NTBV is 1.62
I am long Singtel.
8. Singapore Exchange (OTCPK:SPXCF)
Singapore Exchange logo (Singapore Exchange)
The net profit attributable to shareholders for the 12 months ended June 30 rose to SGD 456 million, up from S$447 million last year. Their final dividend of 8.0 Singapore cents per share was in-line with a year ago.
12 months trailing P/E is 23.68 and P/NTBV is 6.92
9. Wilmar International (OTCPK:WLMIF)
Wilmar logo (WIlmar)
Wilmar is a global leader in the processing and merchandising of edible oils, oilseed crushing, sugar merchandising, milling and refining, production of oleochemicals, specialty fats, palm biodiesel, flour milling, rice milling, and consumer packed oil.
It has over 500 manufacturing plants with more than 100,000 people employed. It is one of the world’s largest oil palm plantation owners with a total planted area of more than 573,000 acres.
The net profit for FH 2022 was USD 1.17 billion. That was an improvement of 55% year on year. EPS was USD 0.185. Their dividend from this was USD 0.043
The company is controlled by the Malaysian tycoon Robert Kwok. They generally have low payout ratios.
12 months trailing P/E is 8.26 and P/NTBV is 0.95
10. Singapore Airlines (OTCPK:SINGY)
Singapore Airline logo (Singapore Airline)
The airline has bled money over the last two years. After several rounds of injecting capital, it finally rose like a phoenix in Q2 of this year with traveling to and from Singapore resuming.
After coming off a net loss of SGD 210 million in the quarter ending 31st March 2022, SINGY managed to turn it around to a net profit of SGD 370 million for the quarter ending 30th June 2022.
It is one of the few international airlines that has been able to deliver profits year in and year out, but I believe its margins have been severely squeezed by the multitude of budget airlines and many other “premium” product offerings from competitors.
12 months trailing P/E is N/M as EPS is SGD – 0.34 and P/NTBV is 1.26
Singapore’s economy
On the 11th of August, Singapore’s Ministry of Trade and Industry (‘MTI’) narrowed Singapore’s GDP growth forecast for 2022 to 3.0 to 4.0%, from the earlier stated 3 to 5%.
The performance for Q2 was a growth of 4.4% year-on-year, with the food & beverage sector accelerated to 28% growth year on year and the retail trade sector showing strong growth expanding by 11.5% year-on-year. Opening up the borders with quarantine-free arrivals and a general reduction in Covid-19 restrictions on people’s movements contributed to these improvements.
Singapore is faced with high inflation, like most other countries, with their core inflation of 3.4% year-on-year in April and May, up from 2.5% in Q1 of 2022. The CPI- All items inflation is expected to come in at 5 to 6% for the full year.
Since October last year, the Monetary Authority of Singapore progressively tightened its monetary policy by slightly increasing the rate of appreciation of the Singapore dollar nominal effective exchange rate policy bank. This is to reduce the cost of imported goods, such as fuel for energy and food.
SNEER from MAS (Singapore Monetary Authority)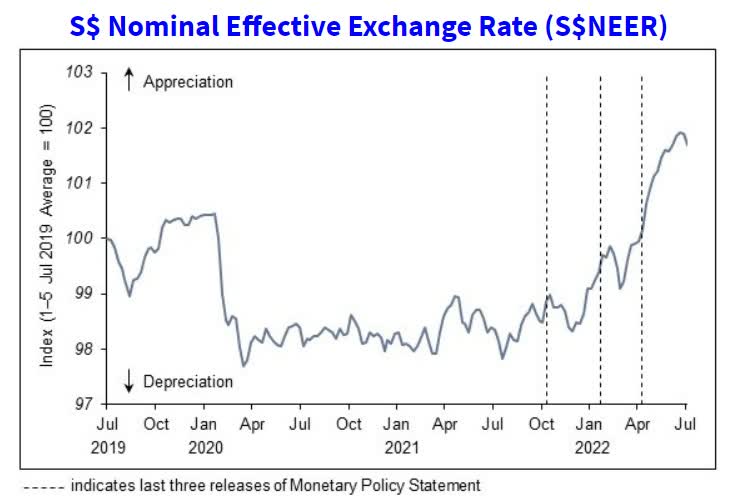
The resident unemployment rate remained low and resident wage growth rose to 7.8% year-on-year in Q1.
A good indicator of where the economy might be going is to look at the private business PMI.
Singapore’s PMI (Trading Economics)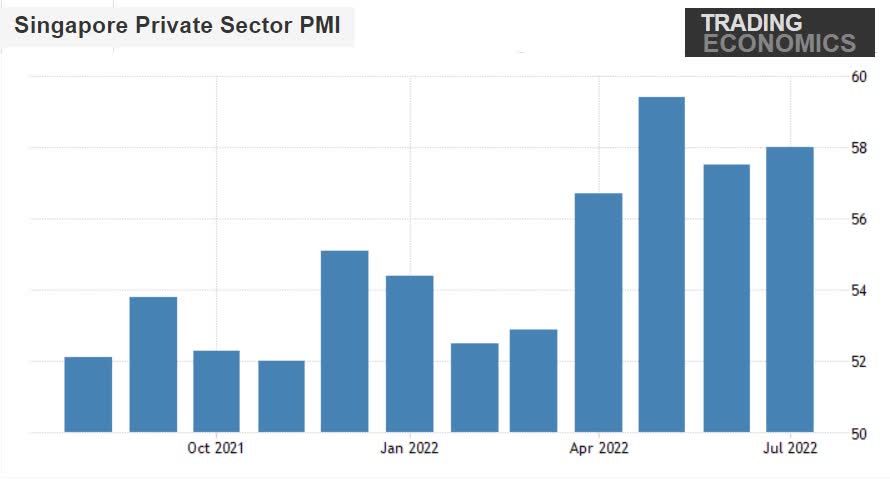
The PMI is still at quite high levels when we compare it with what it was last year and at the beginning of this year.
Is EWS’s dividend yield sustainable?
I asked myself the question of why BlackRock (BLK) presently has a dividend yield on EWS of 6.86% while the dividends of the top ten components, which account for 70% of their portfolio are only around 4%.
EWS top ten holdings (BlackRock and yields compiled by author)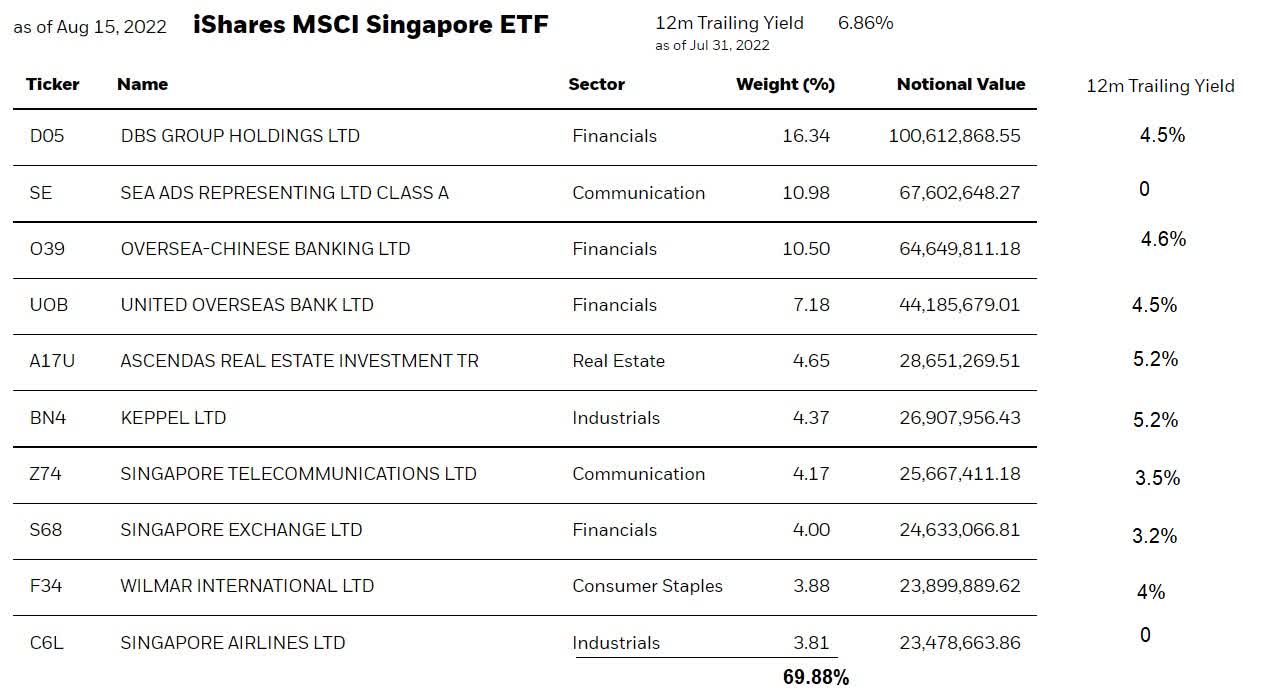
The only explanation I can think of is that the stock market in Singapore has held up better than the one in the U.S.
EWS versus S&P500 versus STI (Yahoo Finance)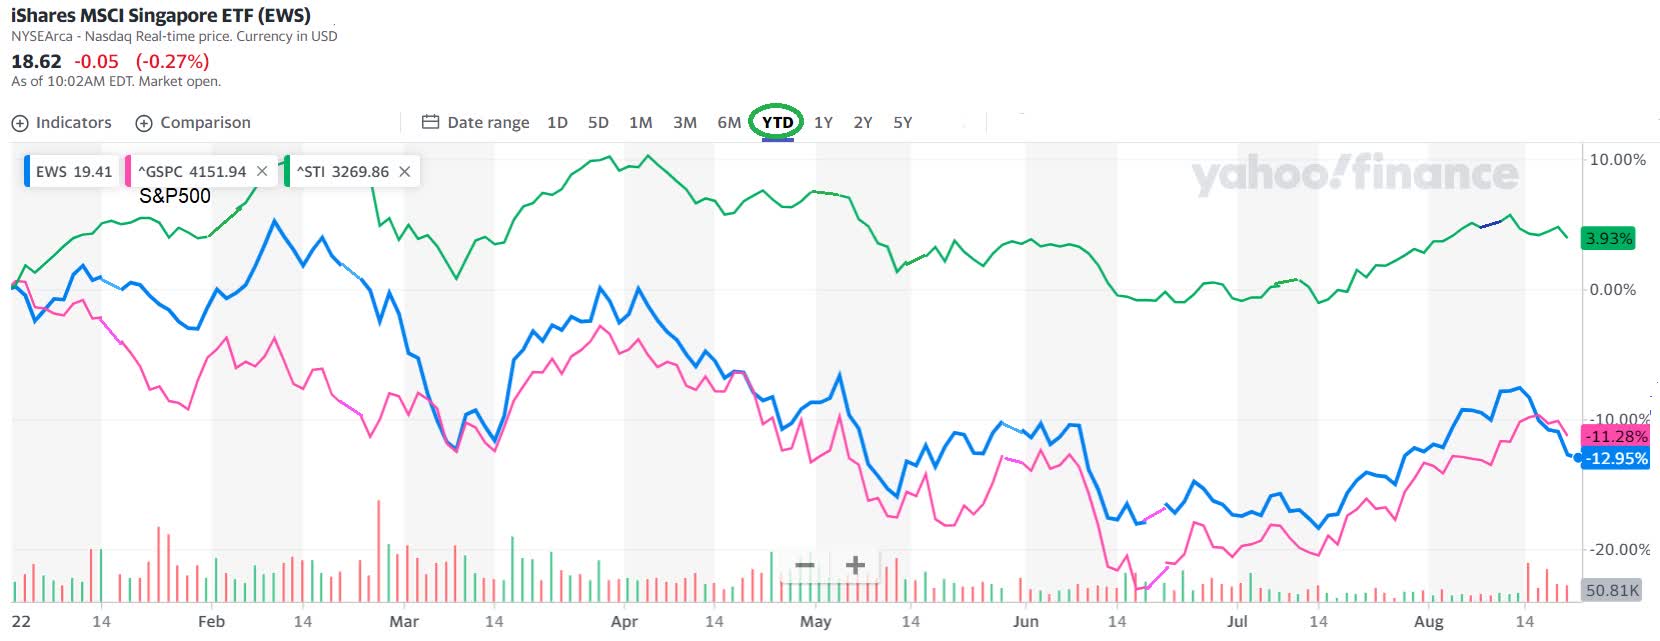
With the share price holding up in Singapore, the yield is obviously lower there than what you get when you can buy the same assets in the U.S. at a discounted price.
Conclusion
The lower price of assets of EWS could make it interesting as an entry point if you have an interest in Singapore and the large-cap companies it has to offer.
As I concluded in April, I think EWS is a good proxy for investing in Asia. That has certainly not changed. Here is what I said:
You get exposure to a vibrant and still growing region through companies that are based in Singapore where corporate governance and international law apply. English is the Government’s official language.
I have shown you in this article that the performance of the top 70% of EWS is solid, except for one company, which I am sure you have figured out already.
It is not possible to predict if the stock market is going down further from here or if this is a bottom. Typically, when people start talking about whether we are in a recession we are already in one. How long it may last, and how deep it gets is anybody’s guess too.
If you look at the P/E of some of the top 10 companies, they are fair and below their average over a 20-year period.
If you have a long-term investment horizon, you could start to accumulate at the present level, and average down should it continue to go down. At least you get paid to wait for the market to improve.
My stance changes to that of a Buy
Be the first to comment