

Leamus/iStock via Getty Images
SQM 2Q22 Results Update
Sociedad Química y Minera de Chile S.A. (NYSE:SQM) reported stellar 2Q22 results on over US$54k/ton LCE realized prices that drove consolidated EBITDA up 530% to US$1.3 billion. While gross margin dipped to 51% vs. 67% in 1Q22 on seemingly higher input costs. However, this is largely explained by royalty over payment, an adjusted gross margin is closer to 65%. This would push EBITDA and Net Income well over consensus, by more than US$366m. The sharp stock price correction post results may have been overdone.
SQM 2Q22 Results Comp (Created by author with data from SQM and Capital IQ)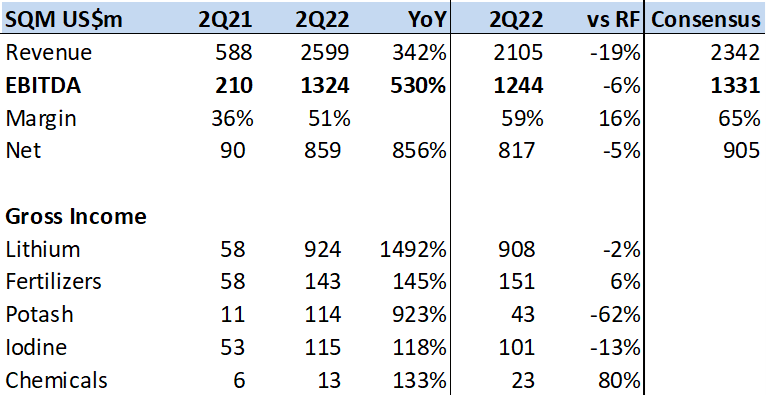
After updating the model for 2Q22 results I adjusted LCE realized price curve as well as margins for over payment of royalties and arrive at a US$186 price target to YE23. Above the previous PT of US$143.
Key Drivers for 2H22 and Forward
LCE prices: SQM now has 70% of volumes contracted at spot prices. This is indicative of LCE supply shortfall and willingness of Battery OEM and automakers to lock in supply vs price sensitivity. It’s likely the company continues to move to 100% spot price sales.
LCE volumes: The company is now targeting 145k/ton of LCE volume in YE22, which means the 2H22 should see volume growth of 37% vs 2H21. YE22 capacity of 180k/ton is on schedule and YE23 210k/ton also.
US EV incentives: The recently passed bill provides consumers with subsidies on the purchase of EVs that have a minimum of 40% national content or sourced from a free trade partner. This places Chile and Australia in an enviable position vs China and Argentina as the US ramps up EV production.
EBITDA margins over 50%: As export volumes and sales volume align EBITDA should be better reflected in accounting statements and valuation.
Royalty Overpayments Distorted EBITDA
As I updated the SQM model post 2Q22 results I was perplexed by the sharp drop in gross margins in the lithium segment and began to research the causes. Two items popped up, one was the CEO’s comment on the results call regarding the lower margins, that according to him was due to higher royalty payments on 53k/ton of LCE exports vs the 34k/ton sold. The second item was the US$1.1bn in royalty taxes (page 177) booked in the quarter that would drive payment equal to 60% of sales, when 40% is the limit.
I estimate that in 2Q22 SQM had US$366m in royalty overpayments that explains the bulk of EBITDA margin contraction and the relative earnings miss by some analyst expectations. The dilemma is due to accounting standards vs fiscal tax collection regulations. SQM pays as much as 40% of LCE sales in royalties if prices are over US$10k/ton. However, the timing of these payments does not always line up with revenue and distorts costs, margins and earnings.
Corfo royalty payments are booked when LCE production is shipped from Chile while SQM books sales when a shipment reaches a third party. In 2Q22, according to the CEO, SQM had about 19k tons of LCE in inventory at its warehouses in China, USA and Europe (plus some in transit). IFRS accounting does not allow for revenue to be booked until the product is effectively delivered to a third party. Thus, SQM reported volume sales of 34k/ton but shipped 53k/ton in 2Q222. This 19k/ton difference paid royalties but did not generate revenue yet.
Adjusted EBITDA for royalty overpayment
Adjusted EBITDA for Overpayment of Royalties (Created by author with data from SQM)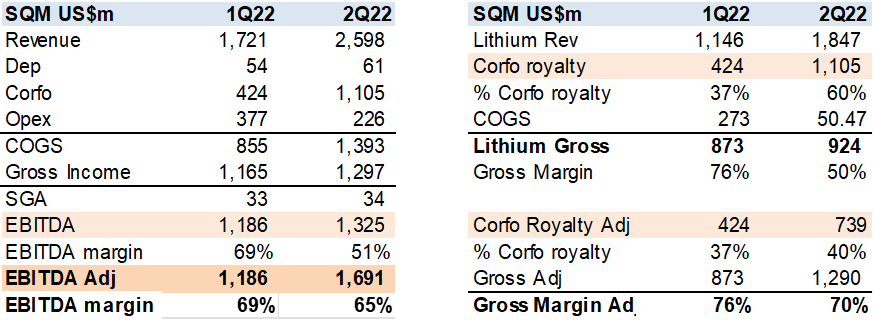
Corfo and SQM royalty payment schedule.
Corfo LCE Royalty Payment table (Created by Corfo)
LCE Price Curve & Volumes
At present spot prices for LCE are around US$60k/ton and SQM has realized prices of US$54k/ton. This is due to the fact that SQM has about 30% of volume (was 50% in 1Q22) into fixed price contracts. As these contracts mature the company should move to 100% spot LCE pricing and thus realized prices should continue to move higher in 2H22.
In the medium term, as LCE demand/supply begins to balance, prices should decline to around US$30k/ton in YE23 and US$20k/ton going forward. The Battery OEM and auto assemblers are scrambling to lock in volume placing the Lithium sector in the driver’s seat. This LCE price curve, in my view, is a conservative estimate and still provides SQM with 50% gross margins long term.
SQM LCE price and Gross Margin Estimates (Created by author with data from SQM)
The company is executing capacity expansion on time or ahead of schedule and should reach LCE capacity of 180k ton by YE22 and 210k/ton by YE23. Providing for 30% volume growth.
SQM LCE Volume and Gross Income Estimates (Created by author with data from SQM)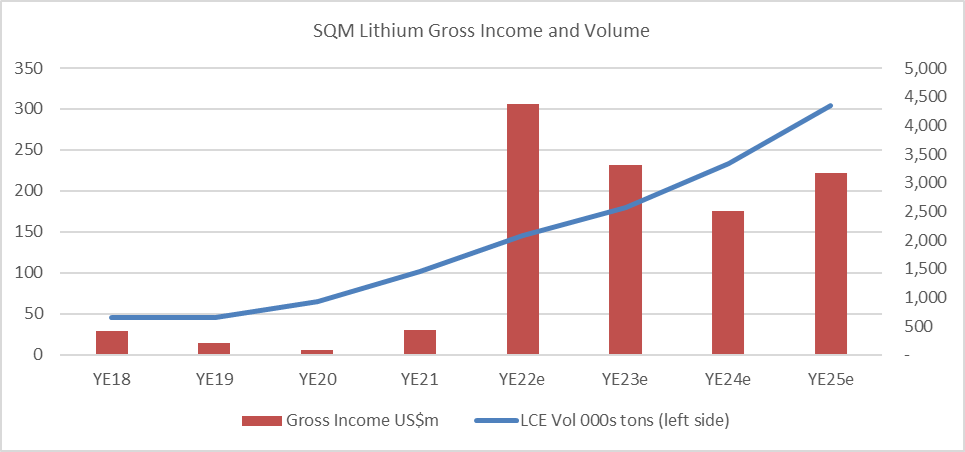
Summary Financial Estimates and Valuation
I value SQM at 12x EV/EBITDA, in line with 10yr average.
SQM Financial Estimates and Valuation (Created by author with data from SQM)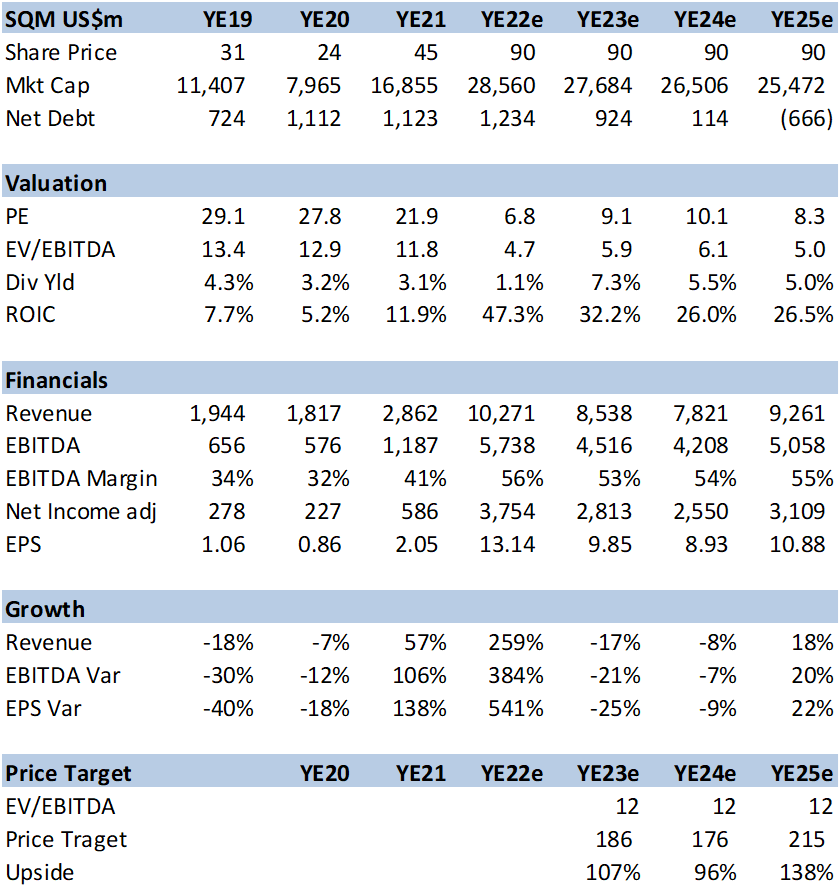
Conclusion
SQM is the lowest cost producer of LCE that should grow volume by 30% a year on EV adoption. The stock’s valuation has not kept up with EBITDA growth or LCE prices due in part to Chile’s political risk perception as well as expectations of a decline in LCE prices. I believe the shares should recover to 12x EV/EBITDA multiple as this political risk wanes and LCE prices stay higher for longer.
Be the first to comment