

naphtalina/iStock via Getty Images
Chart created by writer from C Trader
In this article we will examine how Microsoft’s (NASDAQ:MSFT) macro bearish third wave is fairing and see if investors have been nerved by a slight earnings miss and look to any signals of a bullish turnaround for this equity.
This year’s Q2 earnings report saw Microsoft’s revenue and income fall short, as did the company’s revenue from Azure and other cloud services.
Exchange rates and challenges in advertising and the PC markets saw revenue fall in the quarter. However, this has clearly not deterred investors as Microsoft’s macro bearish third wave is in jeopardy of failing to hit target with potential bullish upside on the way.
October 2021 saw a bullish topping out for Microsoft with a heavy decline from $350 to $270. This fall can be perceived as a bearish wave one, with the wave two $270-$320 confirming the wave three that broke through support at $270 with the Fibonacci 161 lying at $220, and a completion third wave target of $190. Some major equities entering bearish third waves this year have hit Fibonacci 161 so far, but not Microsoft.
Turning around at the $240 region with enough bottom wick action on macro candles to validate a potential bottom, Microsoft is potentially forming a bullish wave structure that can challenge for the previous high of $350 to totally render the bearish third wave a fail.
Microsoft Monthly (C Trader )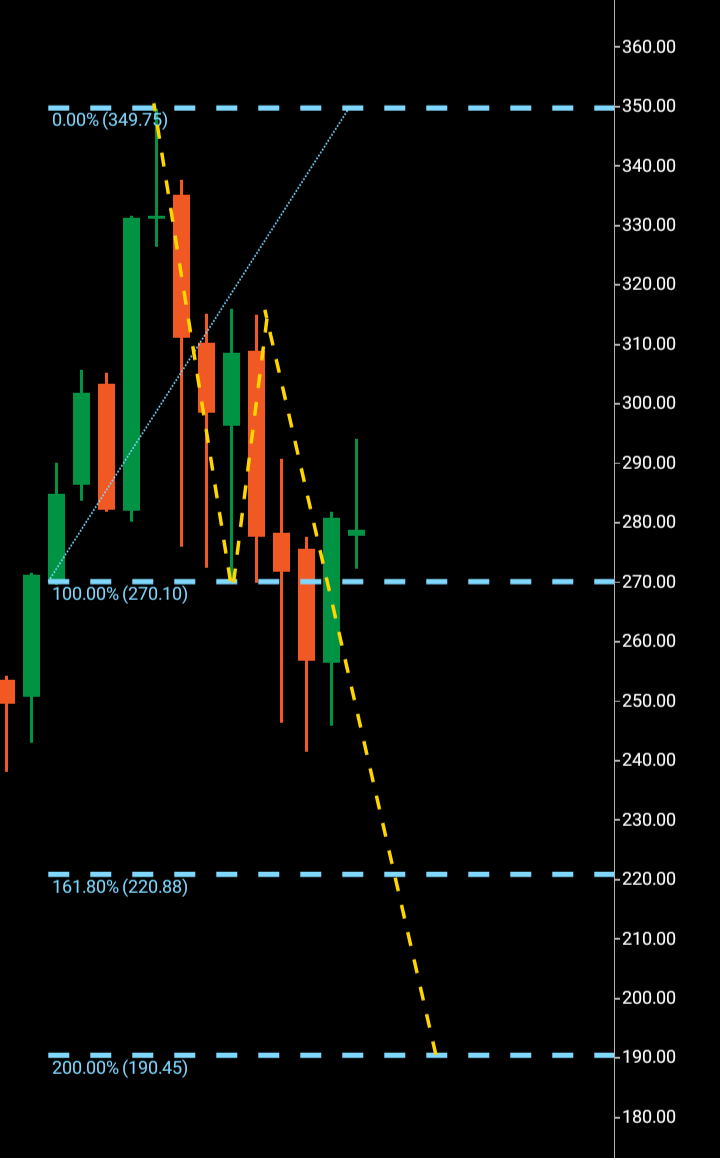
If we look at the monthly structure, we can see the waves one, two, and three downwards with a turnaround at $240; confirming any miss on earnings is of no concern to investors. So let’s get to the meaty part and examine the technicals for a bullish case here.
We can see there is significant bottom wick action signaling there are enough orders to form a bottoming foundation with a large bullish candle at $245-$280. It is the following candle at $272-$295 that will signal the technical intent.
Microsoft Monthly (C Trader )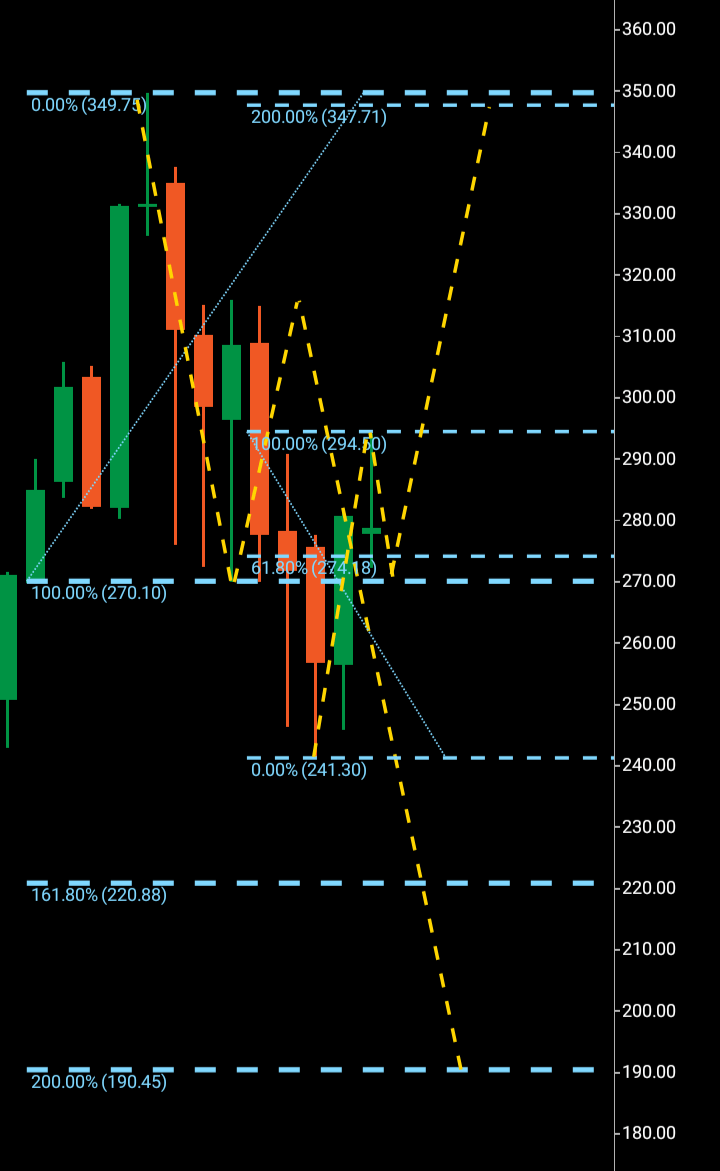
In reality there are three possibilities of what this candle can signal. If it closes this month “as is” or in slight bearish formation this can be considered as bullish, as technically we would have a wave one $240-$295 with a short retrace printed that could also see a further retrace before breaking out above the $295 rejection upwards forming the bullish third wave that has a target circa the $350 region.
The next possibility is even more bullish as this candle may close to finish in full bodied fashion which in turn would signal an even more bullish wave one as the next month or months would then have to form the bearish wave two which would look to be beaten by the third wave upwards. Chances of this candle finishing in extreme bearish fashion are low and overall this Microsoft set up is in bullish mode.
I expect Microsoft to form a bullish third wave pattern with this month’s candle settling “as is” or similar priming the third wave to $347 which I would expect to complete in the next 90-120 days.
About the Three Wave Theory
The three wave theory was designed to be able to identify exact probable price action of a financial instrument. A financial market cannot navigate its way significantly higher or lower without making waves. Waves are essentially a mismatch between buyers and sellers and print a picture of a probable direction and target for a financial instrument. When waves one and two have been formed, it is the point of higher high/lower low that gives the technical indication of the future direction. A wave one will continue from a low to a high point before it finds significant enough rejection to then form the wave two. When a third wave breaks into a higher high/lower low the only probable numerical target bearing available on a financial chart is the equivalent of the wave one low to high point. It is highly probable that the wave three will look to numerically replicate wave one before it makes its future directional decision. It may continue past its third wave target but it is only the wave one evidence that a price was able to continue before rejection that is available to look to as a probable target for a third wave.
Be the first to comment