

skynesher/E+ via Getty Images
Last December, I named Essential Properties Realty Trust, Inc. (NYSE:EPRT) as one of 16 REITs likely to outperform the real estate investment trust (“REIT”) average in 2022. That prediction has not panned out so far. While the average REIT, as represented by the Vanguard Real Estate ETF (VNQ), has returned (-19.11)% thus far this year, EPRT has lagged even that low standard, at (-21.63)%.
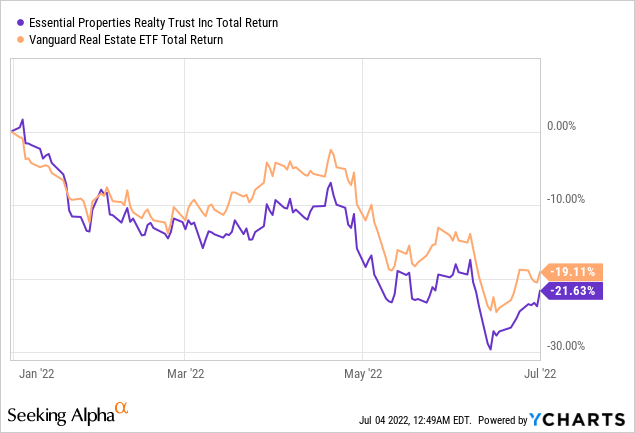
While Net Lease REITs have been the third-best performing REIT sector this year, Essential Properties has badly lagged the sector average. According to Hoya Capital Income Builder, the average return for Net Lease REITs thus far this year is (-5.90)%.
Hoya Capital Income Builder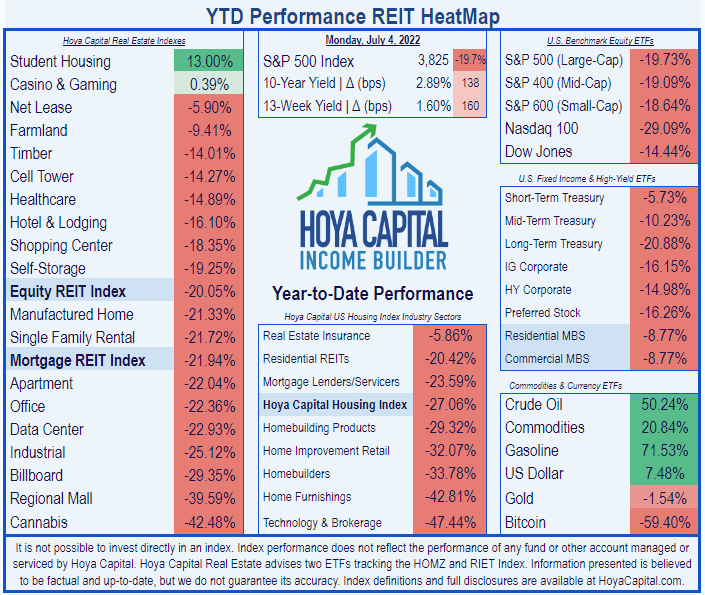
Let’s check under the hood, to see what is going on with this young Net-Lease REIT.
Meet the company
Essential Properties Realty Trust
Founded in 2016 and headquartered in Princeton, New Jersey, Essential Properties Realty Trust went public in June, 2018. The company currently owns 1,545 properties in 46 U.S. states, totaling 14.3 million square feet, boasting 100% occupancy, leased to 323 tenants in 16 industries, with a weighted average remaining lease term of 13.9 years and average unit-level rent coverage of 3.8x. Weighted average annual rent escalators come in at just 1.5%. Total enterprise value is approximately $4.5 billion, according to the company’s website.
What sets EPRT apart is the company’s focus on service-oriented and experienced-based tenants, who are relatively invulnerable to e-commerce competition since customers must visit in person to receive the product or service. 93% of the company’s ABR (annual base rent) comes from service-oriented and experience-based tenants.
For acquisitions, EPRT targets about $200 million per quarter, focusing on sale-leaseback deals with middle market companies. Currently, they are enjoying acquisition cap rates around 7%. The focus on smaller scale net-leased properties makes them easier to divest or re-let. Finally, EPRT focuses on profit centers that are essential to the tenant’s operations, hence the name Essential Properties. They also avoid tenants in industries that are subject to long-term obsolescence. Dispositions average about $17.5 million per quarter.
The largest tenant industry concentrations are in early childhood education, quick service restaurants, car washes, and medical/dental offices, which combine to account for just over 50% of ABR. Auto service and casual dining restaurants make up the next 15%.
Company investor presentation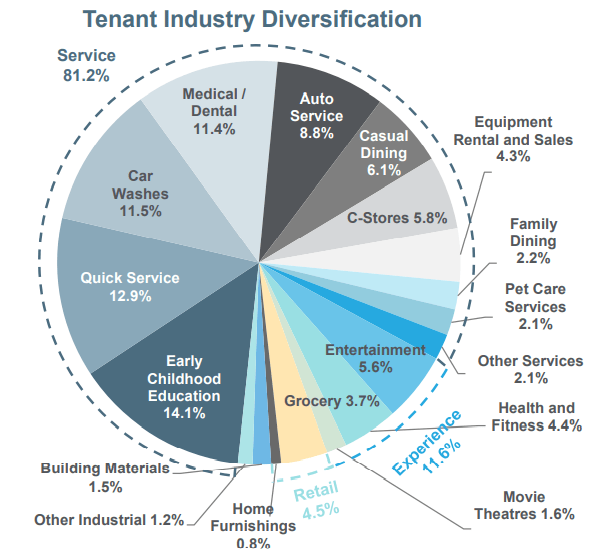
The tenant base is appropriately diversified, with the top 10 tenants combining to account for only 19.2% of ABR, and the top tenant only 3.3%
Company investor presentation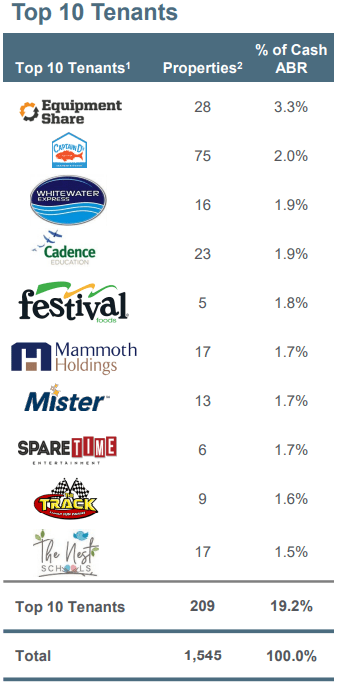
The company provides a helpful picture of the credit-worthiness of their tenant roster, as shown below. Nearly 50% of ABR comes from tenants rated BBB- or better, and the vast majority have rent coverage of 2.00 or better.
Company investor presentation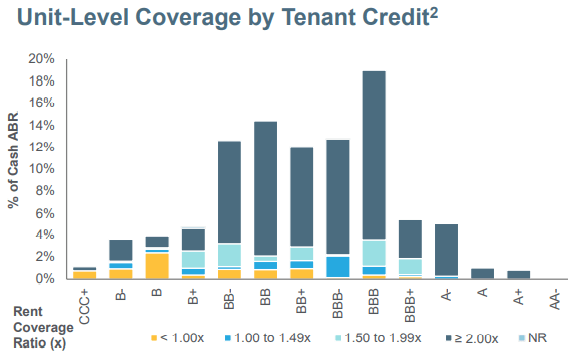
Between now and 2027, fewer than 4% of leases expire annually.
Company investor presentation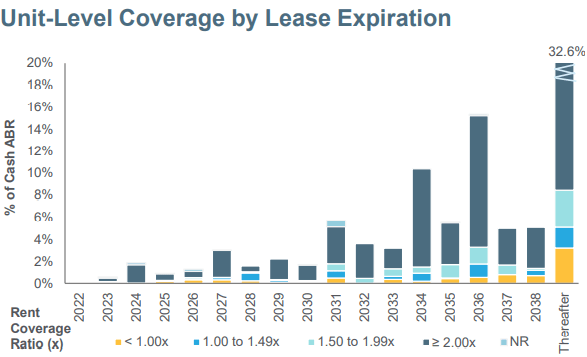
First Quarter results were very healthy
The highlights of EPRTs Q1 2022 results are as follows:
- Revenues of $70.1 million, up 44% YoY (year-over-year)
- Income from operations of $38.4 million, up 66% YoY
- Net income $26.7 million, up 75% YoY
- Diluted net income per share of $0.21, up 50% YoY
- FFO (Funds from operations) $51.5 million, up 56% YoY
- FFO per share $0.39, up 26% YoY
- Acquired 105 properties for $238 million, at a weighted average cash yield of 7%, spanning 12 industries with 83% containing master lease provisions, and 83% sourced from prior relationships.
- Sold 6 properties for $18.4 million, realizing 7.1% weighted average cash yield.
President Peter Mavoides announced on the Q1 earnings call that CEO Gregg Seibert would retire near the end of June of this year, but will consult for the company at least through the end of 2022. The management team has a great deal of experience, and this transition should not be problematic.
Growth metrics
Here are the 3-year growth figures for FFO (funds from operations), TCFO (total cash from operations), and market cap.
| Metric | 2018 | 2019 | 2020 | 2021 | 3-year CAGR |
| FFO (millions) | $51.0 | $82.7 | $104.4 | $162.0 | — |
| FFO Growth % | — | 62.2 | 26.2 | 55.2 | 47.0% |
| FFO per share | $0.84 | $1.20 | $1.10 | $1.41 | — |
| FFO per share growth % | — | 42.9 | (-8.3) | 28.2 | 18.8% |
| TCFO (millions) | $46 | $89 | $99 | $167 | — |
| TCFO Growth % | — | 93.5 | 11.2 | 68.7 | 53.7% |
| Market Cap (billions) | $0.60 | $2.01 | $2.21 | $3.50 | — |
| Market Cap Growth % | — | 235.0 | 10.0 | 58.4 | 80.0% |
Source: TD Ameritrade, CompaniesMarketCap.com, and author calculations
These growth numbers are nothing short of spectacular, qualifying EPRT as a potential FROG (Fast Rate of Growth REIT).
At the end of last year, EPRT had nearly made it into the market cap sweet spot of $4 – $10 billion. However, thanks to this year’s sell-off, EPRT’s market cap is down to $2.90 billion, so it remains a lower mid-cap for the present.
Meanwhile, here is how the EPRT stock price has done over the past 3 twelve-month periods, compared to the REIT average as represented by the Vanguard Real Estate ETF (VNQ).
| Metric | 2019 | 2020 | 2021 | 2022 | 3-yr CAGR |
| EPRT share price July 1 | $19.48 | $15.61 | $27.39 | $22.09 | — |
| EPRT share price Gain % | — | (-19.9) | 75.5 | (-19.4) | 4.28% |
| VNQ share price July 1 | $87.36 | $80.34 | $102.23 | $92.75 | — |
| VNQ share price Gain % | — | (-8.1) | 27.2 | (-9.3) | 2.02% |
Source: MarketWatch.com and author calculations
The company’s price performance has been peculiarly muted, given the fundamentals. Like all REITs, EPRT sold off sharply in the summer of 2020, but came roaring back with a 75% gain in the next 12 months, before selling off along with most REITs in 2022. Its 3-year average price gain of 4.28% is double the VNQ, but not FROG-worthy.
Balance sheet metrics
Essential Properties’ balance sheet is nothing short of spectacular. Debt ratio and Debt/EBITDA are only about half the REIT average, and much lower than Net Lease sector peers, and the liquidity ratio of 2.79 is steely.
| Company | Liquidity Ratio | Debt Ratio | Debt/EBITDA | Bond Rating |
| EPRT | 2.79 | 13% | 2.4 | BBB- |
Source: Hoya Capital Income Builder, TD Ameritrade, and author calculations
EPRT’s debt maturity schedule is enviable, with no maturities this year or next, only $200 million due in 2024, and $147 million due in 2026. The revolving credit facility has $453 million in unused capacity.
Company investor presentation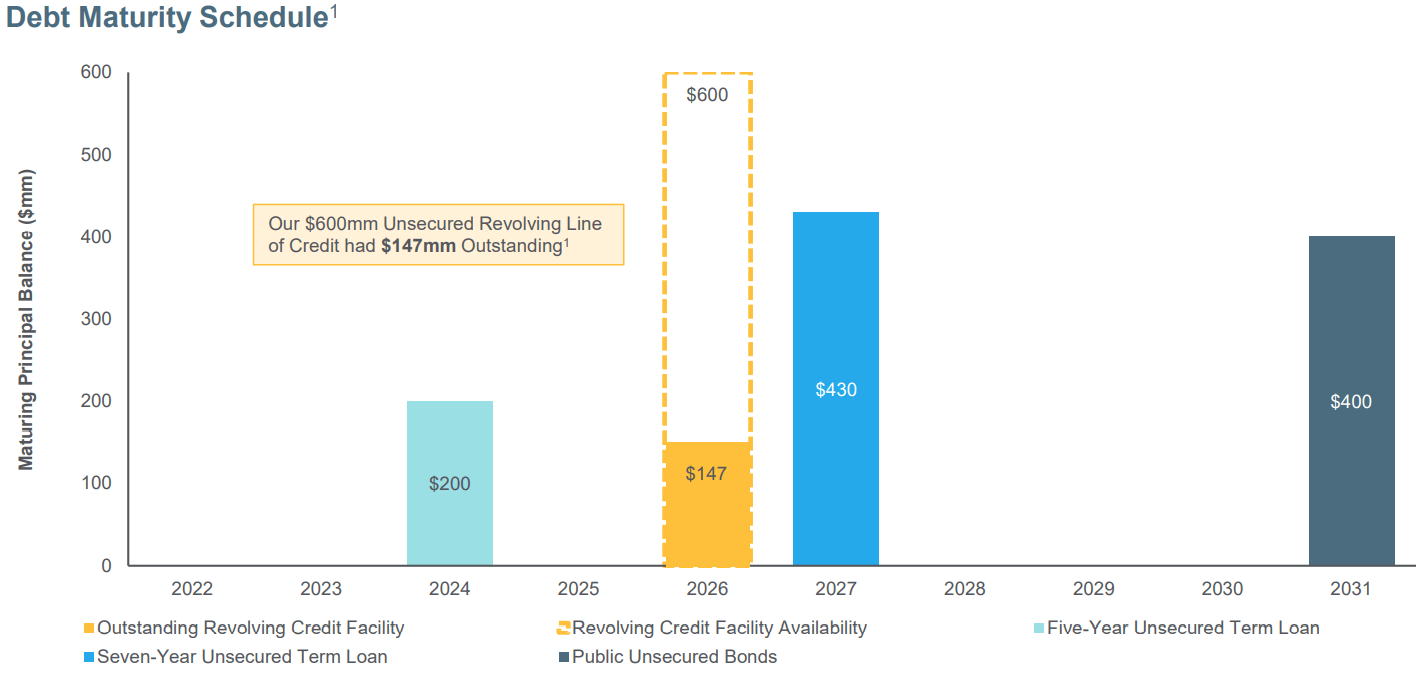
Dividend metrics
EPRT’s dividend growth rate is second to none among Net Lease REITs. Coupled with its near-5% current Yield, the Dividend Score of 6.01 is truly outstanding, even in a high-yielding sector. In June, the company announced another 3.8% raise in the dividend, to $0.27 per share. This company is an excellent payer, and with growth like they have shown, the dividend payout should be very safe.
| Company | Div. Yield | Div. Growth | Div. Score | Payout Ratio | Div. Safety |
| EPRT | 4.89% | 7.1% | 6.01 | 67% | B+ |
Source: Hoya Capital Income Builder, TD Ameritrade, Seeking Alpha Premium
Dividend Score projects the Yield three years from now, on shares bought today, assuming the Dividend Growth rate remains unchanged.
Valuation metrics
Spectacular growth usually comes with a high price tag. Not in this case. Strangely enough, this fast-growing company is on sale at just 13.8x FFO.
| Company | Div. Score | Price/FFO | Premium to NAV |
| EPRT | 6.01 | 13.8 | 5.2% |
Source: Hoya Capital Income Builder, TD Ameritrade, and author calculations
What could go wrong?
Because this company invests strategically in high-touch businesses, the pandemic hit it harder than most. Another pandemic or flare-up of the current one could still slow this REIT down.
Most of EPRT’s tenants are in industries that are strongly affected by increases or decreases in discretionary income. Continued inflation could suppress demand for the tenants’ products and services. In addition, the long lease terms and small automatic rent escalators work against the company during times of high inflation, and like most Net Lease REITs, the company is a little more sensitive than most to increases in interest rates.
Investor’s bottom line
Double-digit growth with 100% occupancy, enviable balance sheet, paying exceptional and fast-growing dividends, and selling for a below-market price/FFO. What’s not to like about EPRT? I rate this company an unequivocal buy.
The Seeking Alpha Authors and Quant Ratings unanimously rate EPRT a Strong Buy, and Wall Street analysts tend to concur, though 5 of those 13 analysts caution Hold.
Seeking Alpha Premium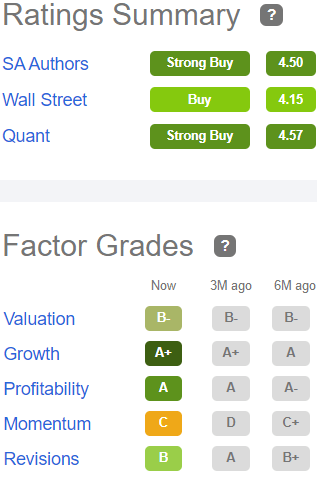
The average analyst price target is $26.50, implying 22.8% upside. Insiders have bought $434,000 worth of shares in the past 90 days, while hedge funds have divested $927,000, according to TipRanks.
Be the first to comment