

kodda
Introduction
Energy Transfer LP (NYSE:ET) is a publicly-traded limited partnership classified as an energy-related services provider.
On November 1, 2022, Energy Transfer LP reported its third quarter of 2022 results.
Note: This article is an update of my preceding article, published on April 19, 2022.
Energy Transfer’s primary operations are midstream natural gas, intrastate, interstate transportation and storage assets, crude oil, natural gas liquids (“NGL”), and refined product transportation.
The company owns and operates one of the largest and most diversified portfolios of energy assets in the United States. It is active in all major domestic production basins, making the stock one of the industry’s best choices in this segment with its rival Enterprise Products Partners (EPD).
ET Map Presentation (Energy Transfer)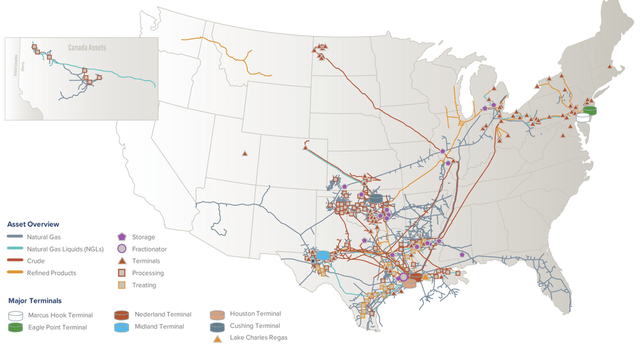
Note: Energy Transfer owns Lake Charles LNG Company, the general partner interests, the incentive distribution rights, and 28.5 million Sunoco LP (SUN) shares, and the general partner interests and 46.1 million shares of USA Compression Partners, LP (USAC).
Recent noticeable transactions:
In August 2022, Energy Transfer announced a 20-year LNG Sale and Purchase Agreement (“SPA”) with Shell NA LNG LLC. In 2022, the Partnership has entered into six long-term LNG SPAs.
Also, in September 2022, Energy Transfer completed the acquisition of Woodford Express, LLC, which owns a Mid-Continent gas gathering and processing system, for approximately $485 million.
CEO Tom Long said in the conference call:
We were pleased to report another strong quarter during which we generated consolidated adjusted EBITDA of $3.1 billion, which was up approximately 20%, compared to $2.6 billion for the third quarter of 2021. In the third quarter, we experienced a nonrecurring $126 million charge in the crude oil segment related to the resolution of a prior-year legal matter. In addition, we had an approximately $130 million negative impact due to the timing of the recognition of gains on hedged inventory in the NGL and refined products segment.
1 – 3Q22 Earnings Snapshot
On November 1, 2022, Energy Transfer LP reported net income attributable to partners for the three months ended September 30, 2022, of $1,006 million compared to $635 million in 3Q21.
Adjusted EBITDA for the three months ended September 30, 2022, was $3.09 billion compared to $2.58 billion for the three months ended September 30, 2021.
As adjusted, distributable Cash Flow attributable to partners for the three months ended September 30, 2021, was $1.581 billion compared to $1.312 billion for the same period last year. In the third quarter of 2022, Energy Transfer achieved its highest intrastate NG transportation volumes.
The company increased 2022 guidance for the third time and expected Adjusted EBITDA to be between $12.8 billion and $13.0 billion. Adjusted EBITDA for 3Q22 was $3.088 billion (EBITDA was $3.011 billion). Adjusted EBITDA would have been higher but was impaired by two special items:
- ET experienced a nonrecurring $126 million charge in the crude oil segment related to the resolution of a prior-year legal matter.
- The company incurred approximately $130 million unfavorable impact due to the timing of the recognition of gains on hedged inventory in the NGL and refined products segment.
ET 3Q22 Highlights (ET Presentation)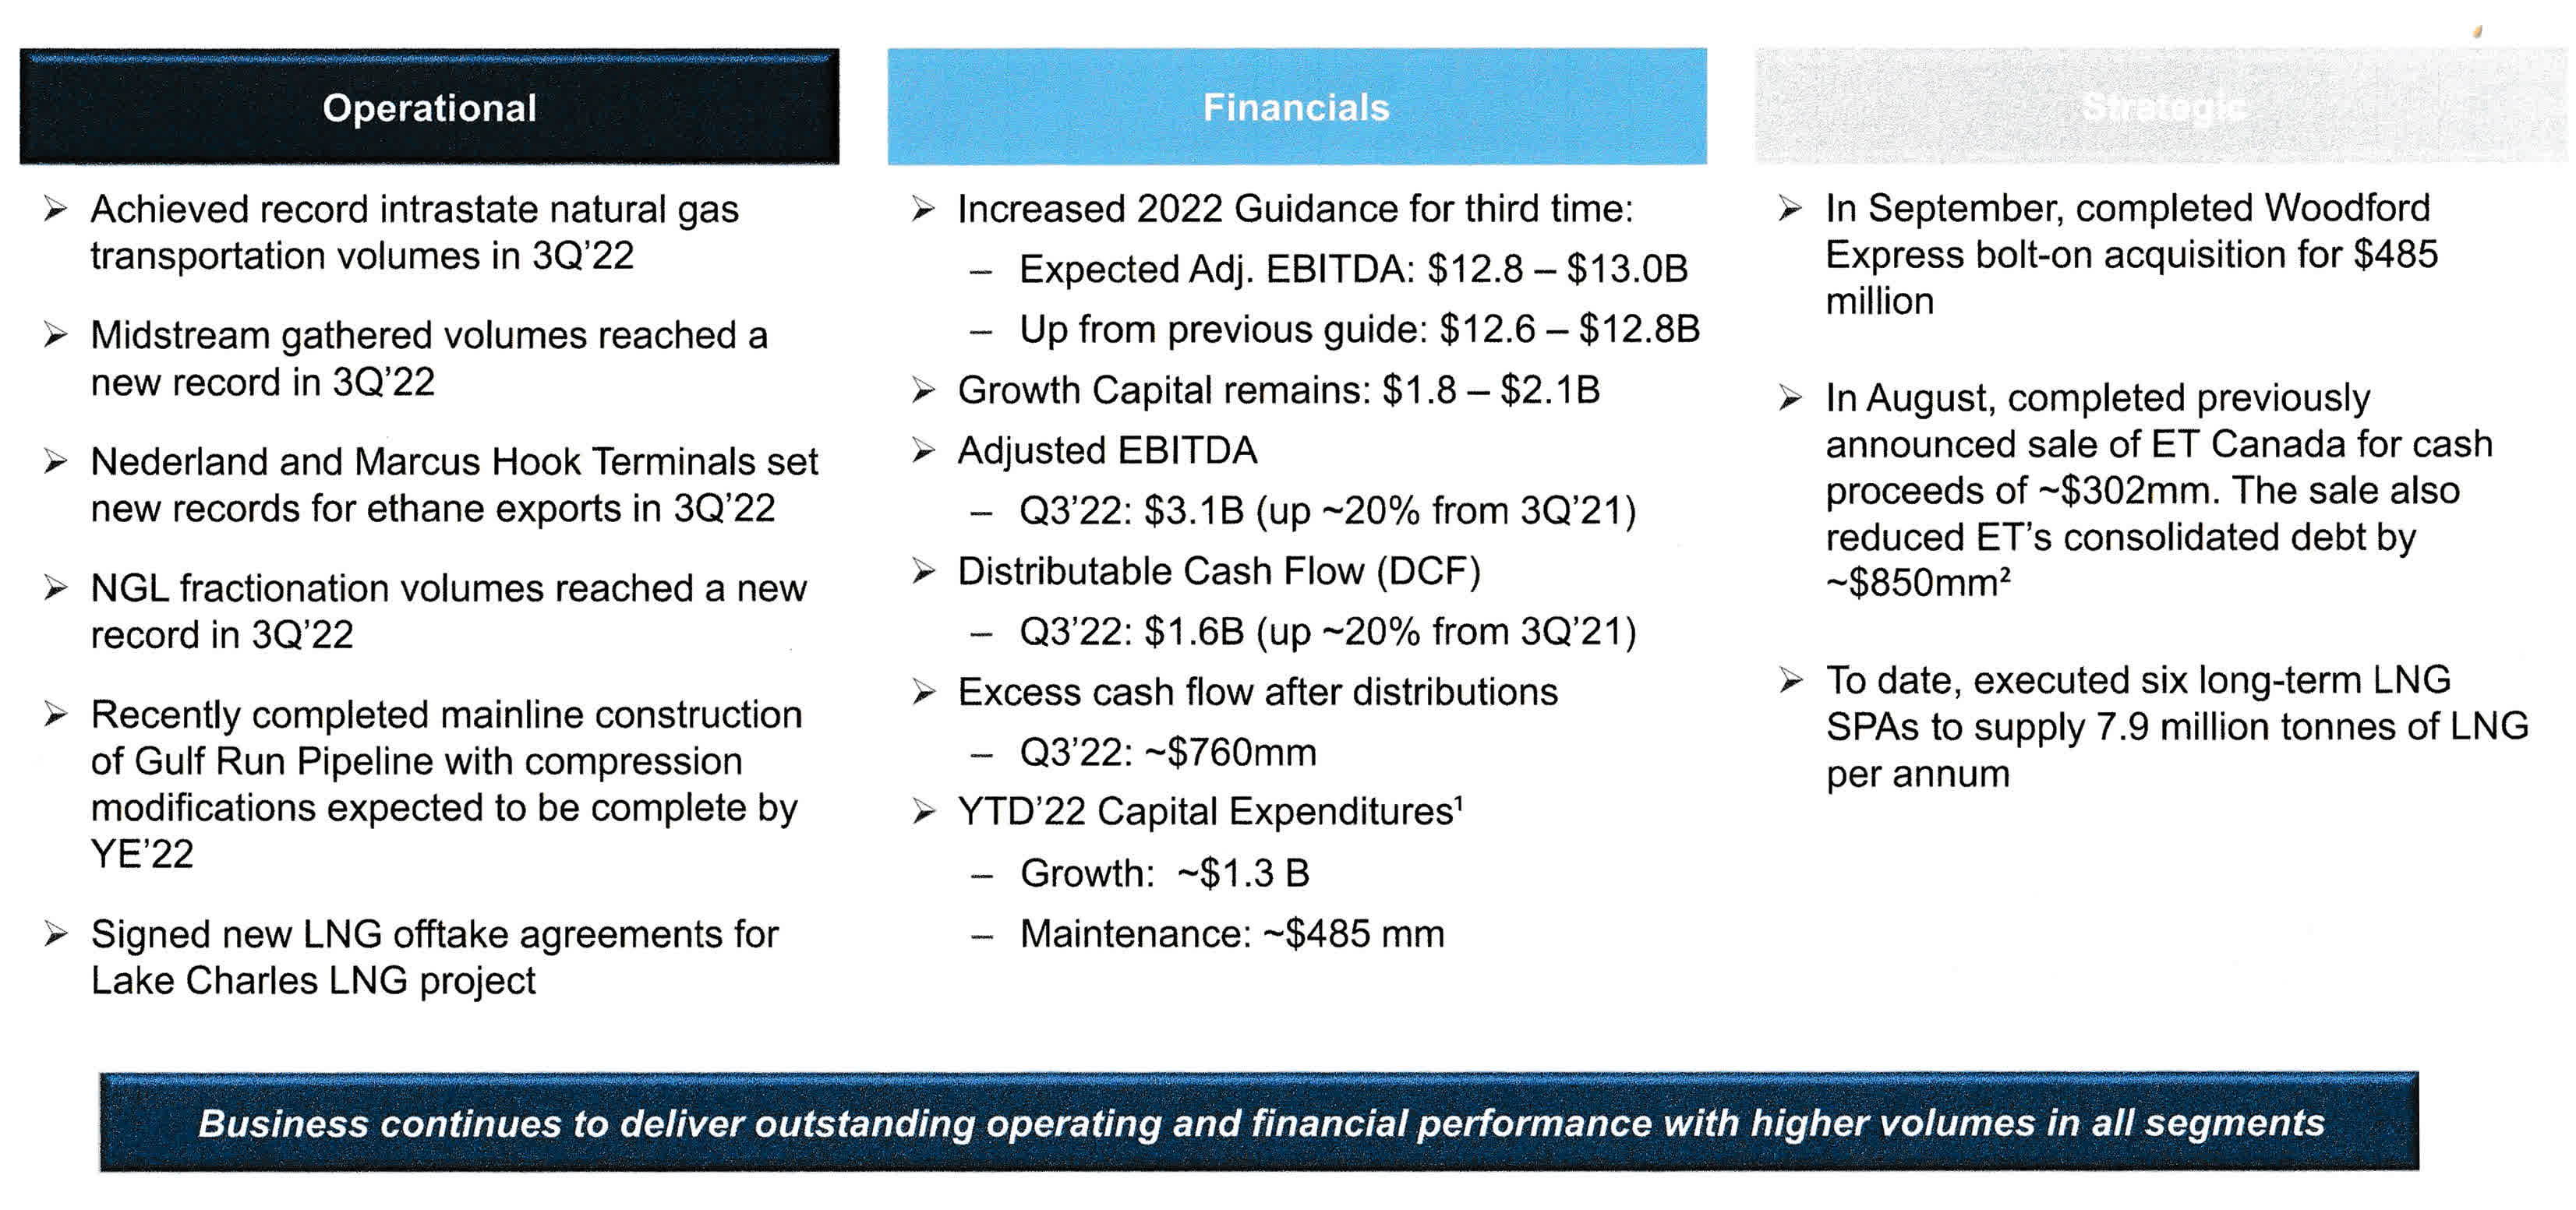
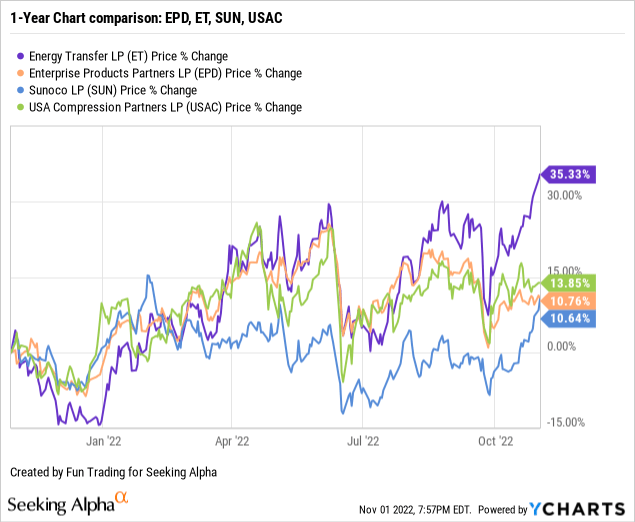
2 – Stock Performance
ET is up 35% on a one-year basis and has outperformed most of its peers on a one-year basis.
3 – Investment Thesis
As I said in my preceding article, the investment thesis for Energy Transfer is clear. I consider ET a solid long-term investment, particularly adjusted to dividend-oriented investors interested in a business model targeting the domestic distribution and storage of natural gas liquid.
Initially, I had a buy rating at $8.20 back on January 2, 2022, and it paid off handsomely. However, the market is more demanding, with the stock rising well above $12. A show-me-the-beef attitude.
The question is, how high can ET go based on the recent earnings results? The market is telling investors that it may be at a strong resistance and could retrace sharply with a faltering world economy.
The third quarter results were primarily neutral, with some solid points and a few misses that hurt DCF. One crucial component is that the company is paying a high-level dividend of 8.31% (versus EPD with 7.57% now) which I consider safe and could eventually increase next quarter. CEO Tom Long said in the conference call:
On October 25, we announced a quarterly cash distribution of $0.265 per common unit or $1.06 on an annualized basis. This distribution will be paid on November 21 to unitholders of record as of the close of business on November 4. This distribution represents a more than 70% increase over the third quarter of 2021.
The balance sheet shows a steady free cash-flow-generation business model, which investors should consider before any other considerations. But one unknown is, of course, the demand outlook for oil and gas.
While the long-term investment thesis is still compelling, I am unsure about the stock growth prospect, and I wonder if we have reached a temporary ceiling that requires a healthy retracement.
Thus, I recommend trading LIFO over 35% of your total position due to the high volatility in this ever-moving segment.
The FED just hiked by 75-point and signaled it is not done yet, which indicates another potential 75-point in December. Europe has already fallen into recession, and the US is expected to follow. Those considerations should push you to be extra careful with a stock that has increased quite a lot lately.
Energy Transfer LP – Financial table 3Q22 – The raw numbers
Important Note: Energy Transfer is an MLP, not a Corporation. Thus, the two major components that matter the most in the table below are EBITDA or adjusted EBITDA and Attributable DCF. Also, shareholders are considered differently when it comes to distribution:
As a result of their substantial non-cash depreciation and amortization charges, MLPs’ GAAP earnings are artificially suppressed, and the distributions paid are usually higher than earnings. Therefore, the IRS considers the majority of an MLP’s distribution a return of capital, or ROC.
| ET | 3Q21 | 4Q21 | 1Q22 | 2Q22 | 3Q22 |
| Total revenues in $ million | 16,664 | 18,657 | 20,491 | 25,945 | 22,939 |
| Net Income in $ Million | 635 | 921 | 1,269 | 1,326 | 1,006 |
| EBITDA $ Million | 2,485 | 2,715 | 3,065 | 3,332 | 3,011 |
| EPS diluted in $/share | 0.20 | 0.29 | 0.37 | 0.39 | 0.29 |
| Operating cash flow in $ Million | 2,263 | 1,739 | 2,370 | 2,354 | 2,989 |
| CapEx in $ Million | 617 | 776 | 752 | 706 | 1,035 |
| Free Cash Flow in $ Million | 1,646 | 963 | 1,618 | 1,648 | 1,954* |
| Total cash $ Million | 313 | 336 | 1,111 | 353 | 326 |
| Long-Term Debt in $ Million | 45,471 | 49,702 | 49,478 | 48,106 | 47,446 |
| Distribution per share in $ | 0.1525 | 0.175 | 0.20 | 0.23 | 0.265 |
| Shares outstanding (diluted) in Million | 2,720.6 | 2,825.6 | 3,100.5 | 3,105.7 | 3,108.6 |
| Attributable DCF to partners of ET | 1,306 | 1,440 | 2,066 | 1,869 | 1,576 |
| Oil and Gas Transportation | 3Q21 | 4Q21 | 1Q22 | 2Q22 | 3Q22 |
| Natural Gas transported BBTu/d | 12,335 | 14,765 | 15,098 | 14,834 | 14,878 |
| NGL Transportation volume MBbls/d | 1,803 | 1,872 | 1,752 | 1,912 | 1,892 |
| Crude oil Transportation volume | 4,173 | 4,173 | 4,216 | 4,318 | 4,575 |
Sources: EP release
* Estimated by Fun Trading from the 10Q
Analysis: Revenues, Earnings Details, Free Cash Flow, Debt, An Oil And Gas Production
1 – Total revenues and others were $22,939 million in 3Q22
ET Quarterly revenues history (Fun Trading)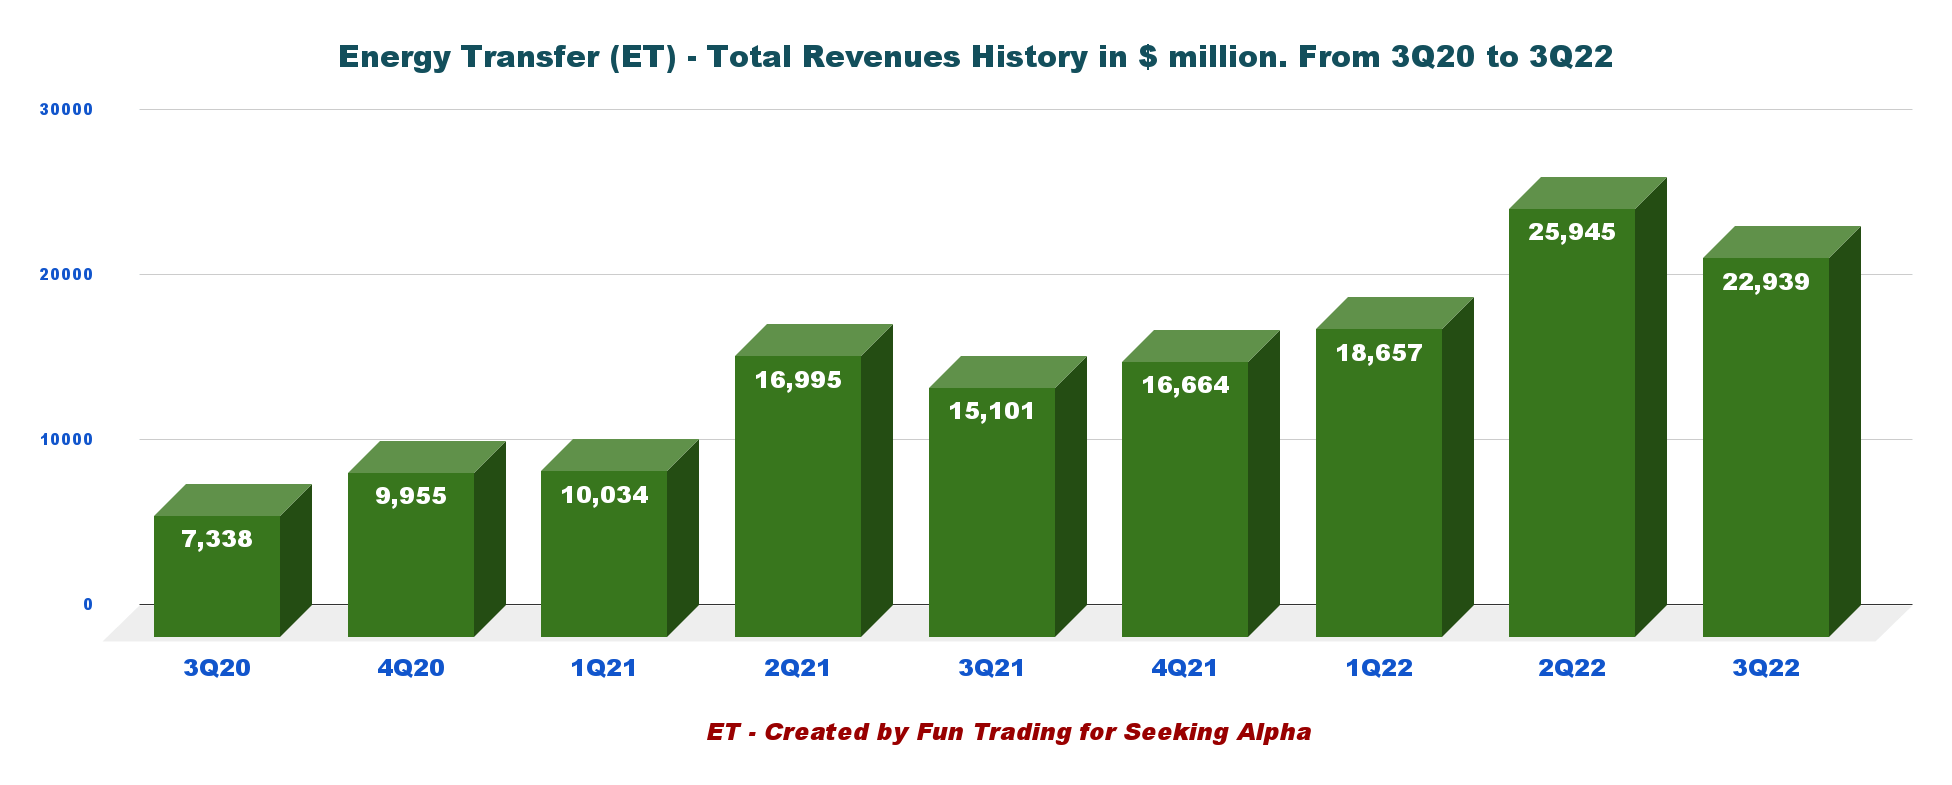
The revenues for the 3Q22 were $22,939 million, with a net income of $1,006 million or $0.29 per diluted share. It was a solid improvement from the 3Q21 but quite dull sequentially.
Growth CapEx is expected to be between $1.8 billion to $2.1 billion. The increase covers all five segments indicated below.
ET Investment returns shorter cycle (ET Presentation)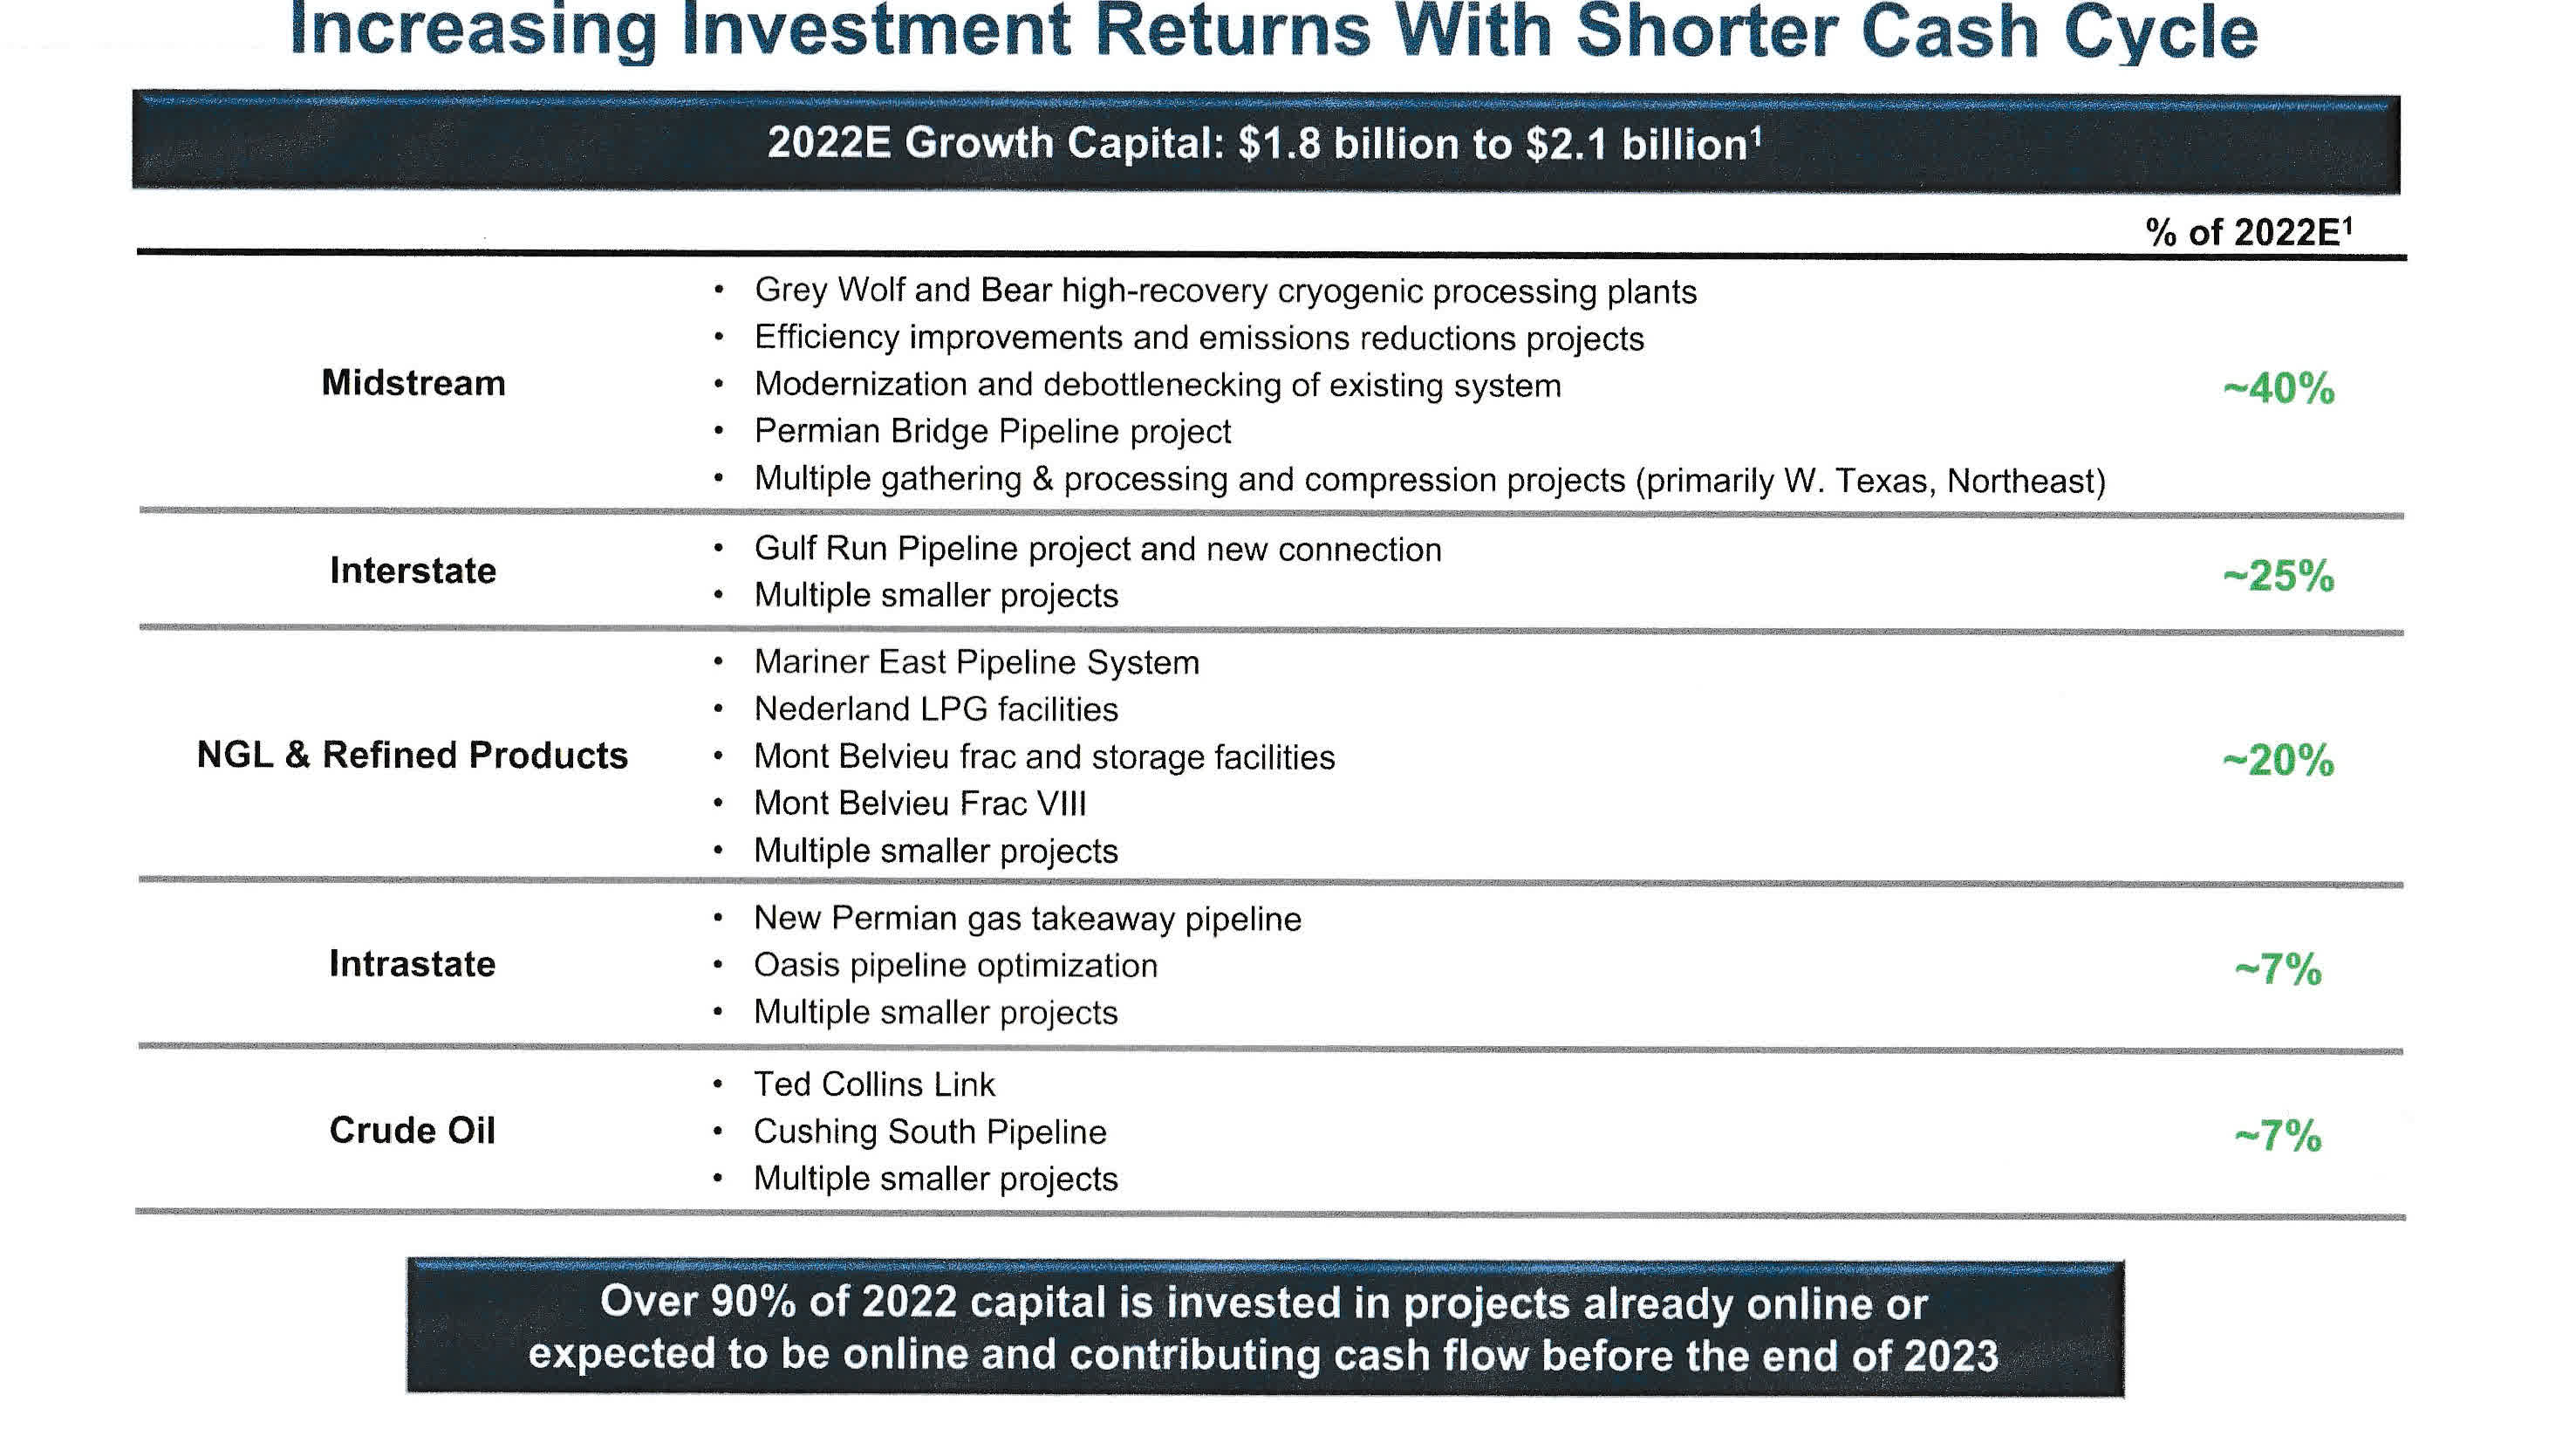
2 – Free cash flow was $1,954 million in 3Q22
ET Quarterly Free cash flow history (Fun Trading)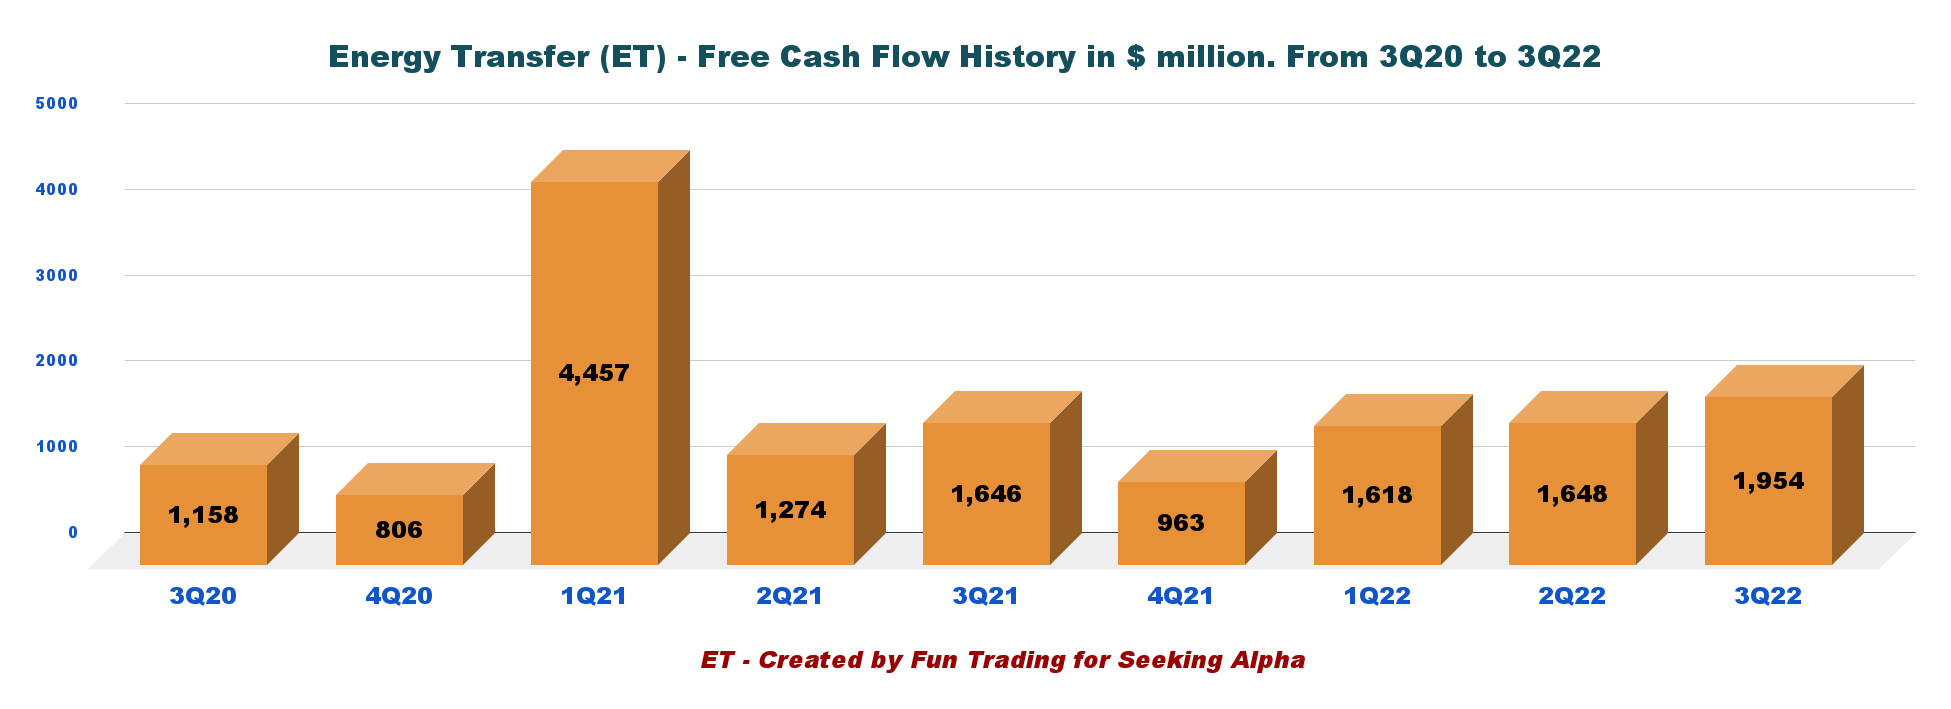
Note: Free cash flow is cash from operations minus CapEx.
Trailing twelve-month free cash flow is now $6,183 million, and free cash flow for 3Q22 was estimated at $1,954 million.
CEO Tom Long said in the conference call:
As a reminder, future increases to the distribution level will be evaluated quarterly with the ultimate goal of returning distributions to the previous level of $0.305 per quarter or $1.22 on an annualized basis while balancing our leverage target, growth opportunities and unit buybacks.
3 – Net debt was $47.12 billion in 3Q22
ET Quarterly Cash versus Debt history (Fun Trading)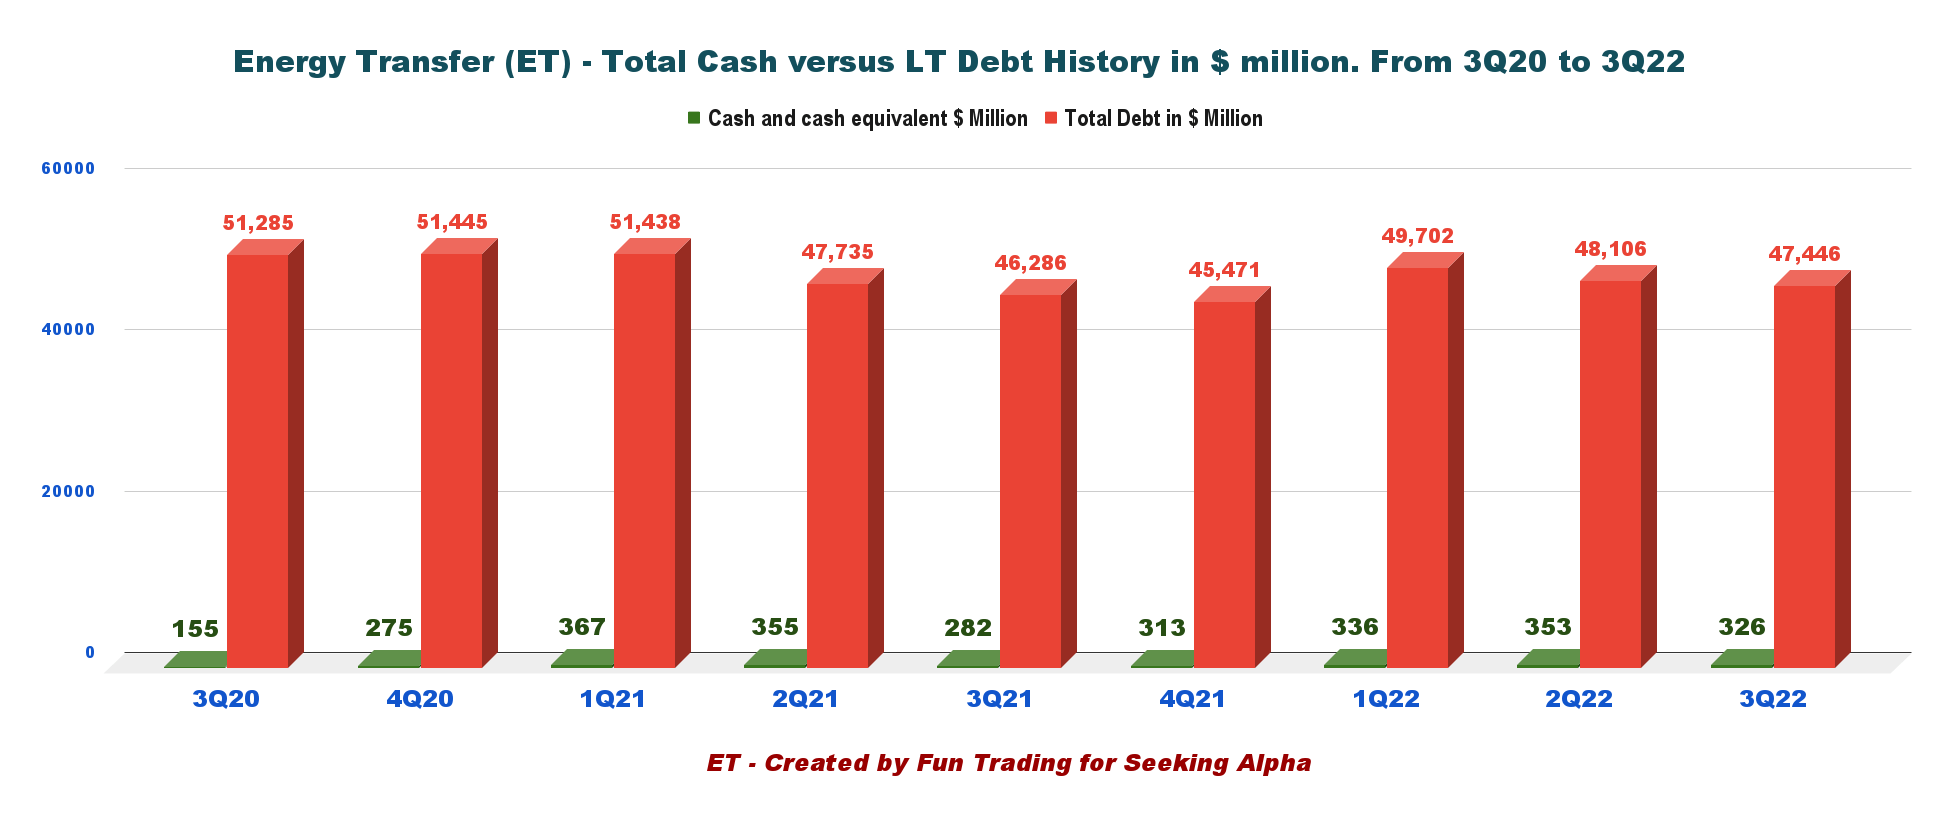
Cash and cash equivalent were $326 million in 3Q22, down 0.8% sequentially, and LT debt (including current) was $47.446 billion.
As of September 30, 2022, the Partnership’s revolving credit facility had $2.32 billion available capacity. For the three months that ended September 30, 2022, the Partnership invested approximately $500 million in growth capital expenditures.
The net debt to EBITDA ratio is relatively high at 4.08x.
4 – Attributable DCF to Partners of ET
We can see that it has remained constant since 3Q21. DCF for 3Q22 is up 9.4% year over year.
ET Attributable DCF to partners of ET history (Fun Trading)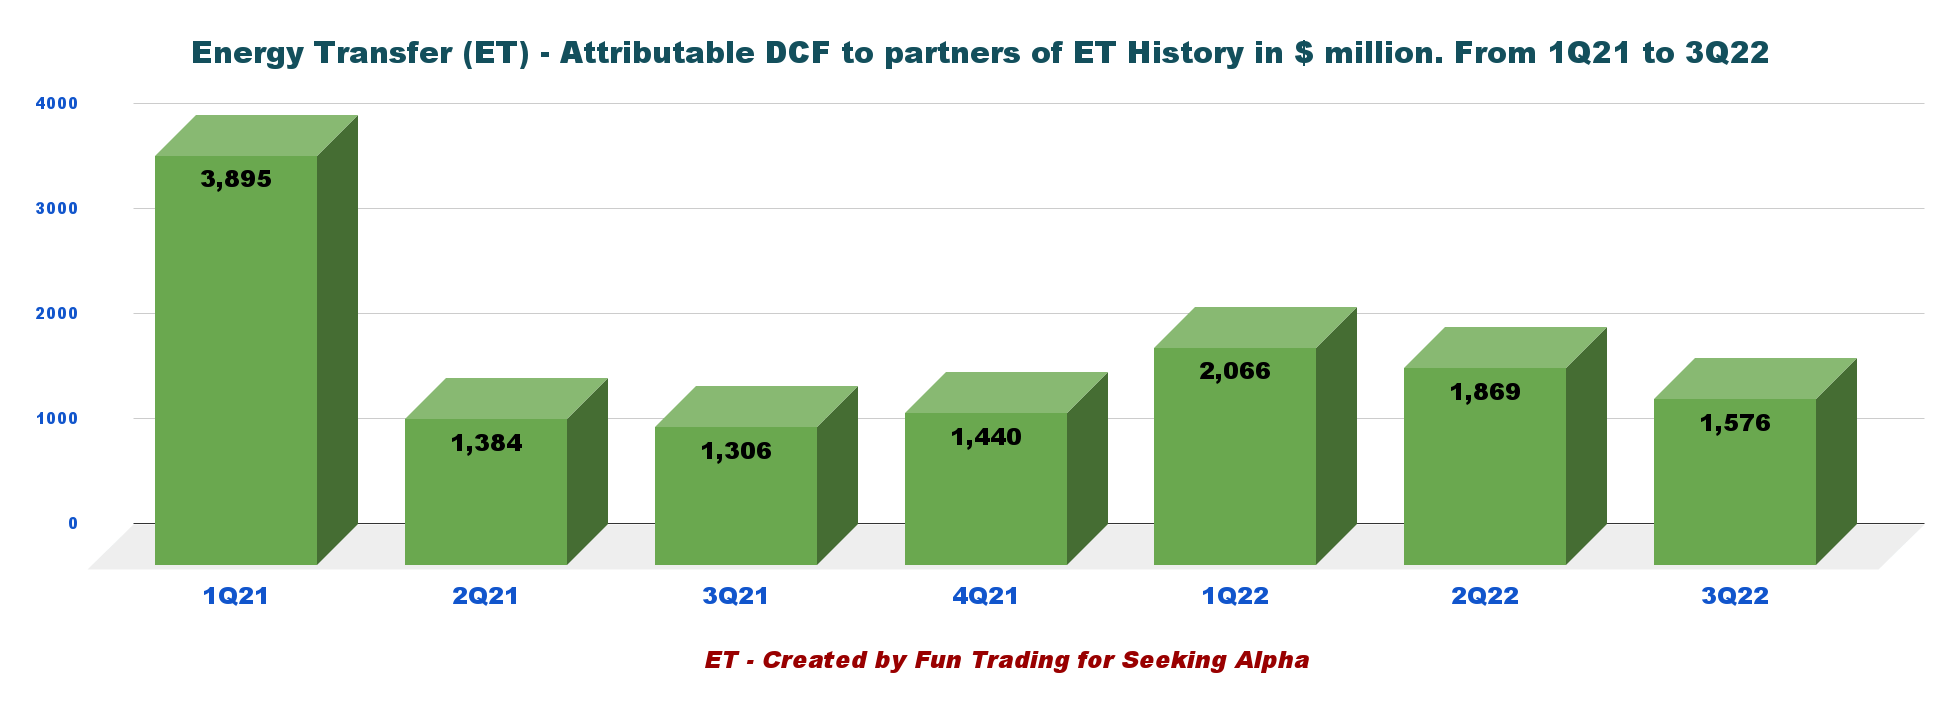
Attributable DCF is solid, but the trend for the last three quarters is down, which is not a good omen.
5 – 2022 Outlook
Adjusted EBITDA for 2022 is expected to come from fees (85% to 90%).
ET 2022 Outlook Presentation (ET Presentation)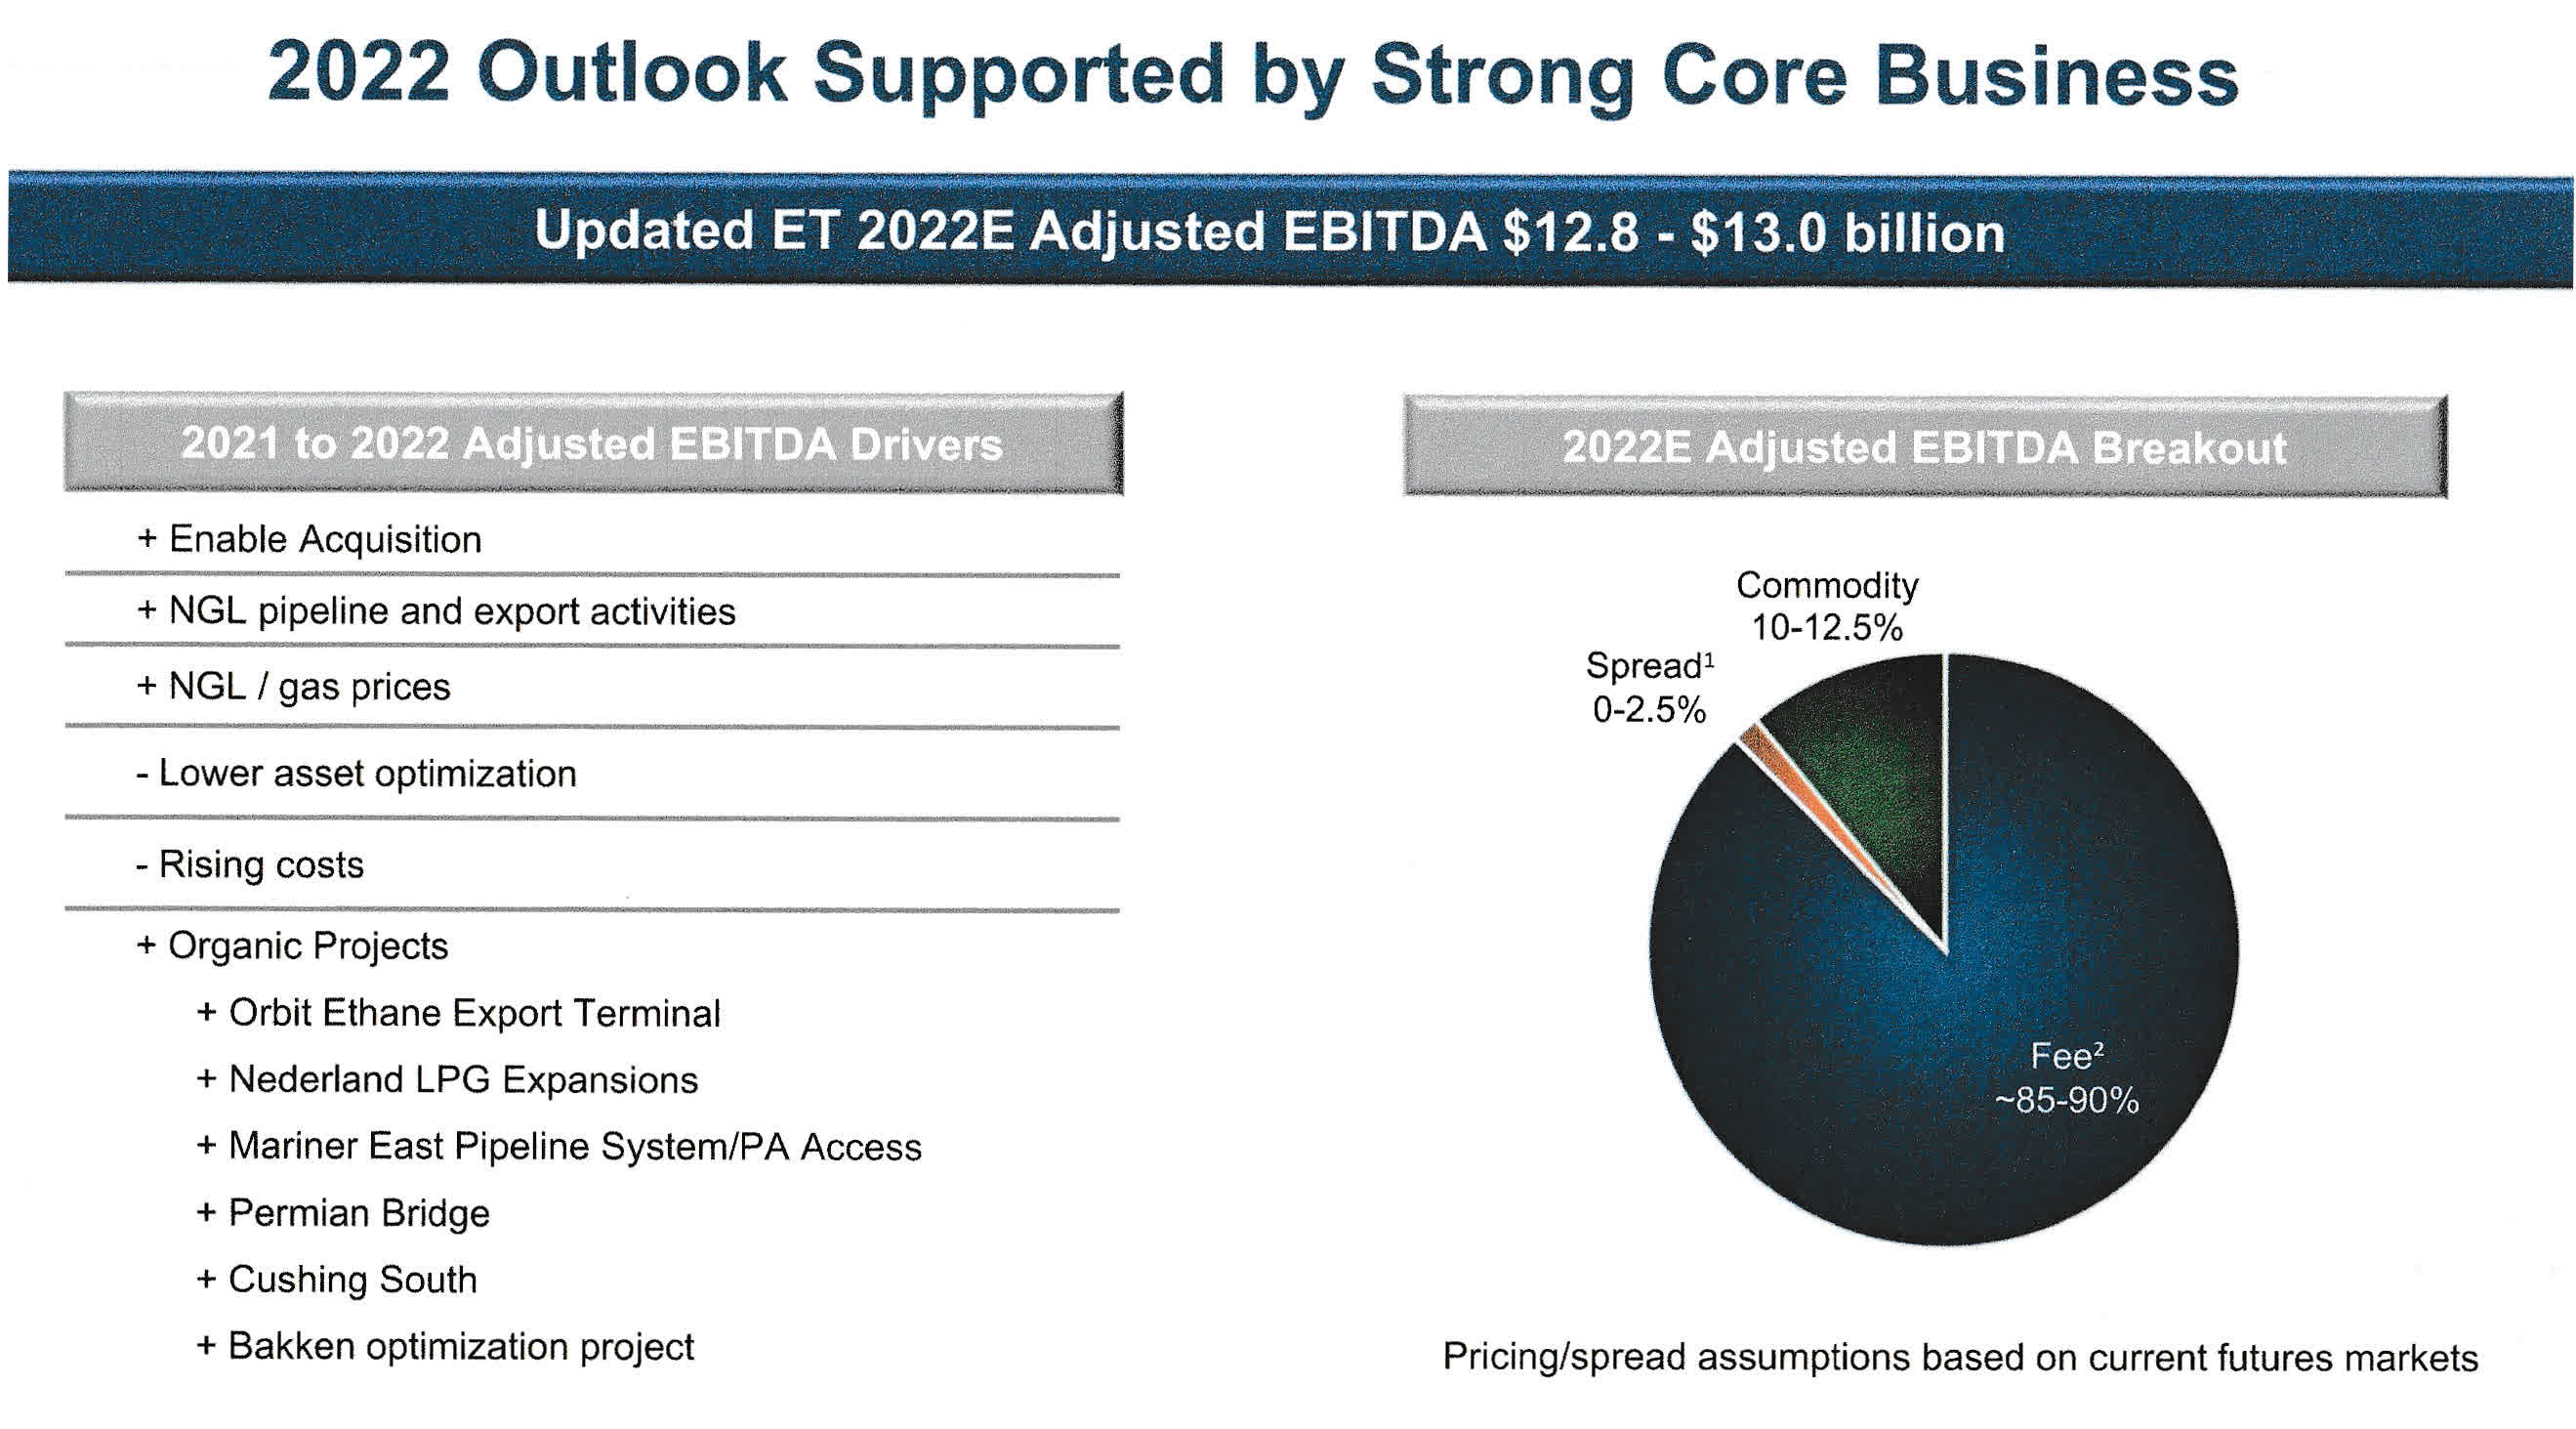
Technical Analysis (Short Term) And Commentary
ET TA Chart short-term (Fun Trading StockCharts)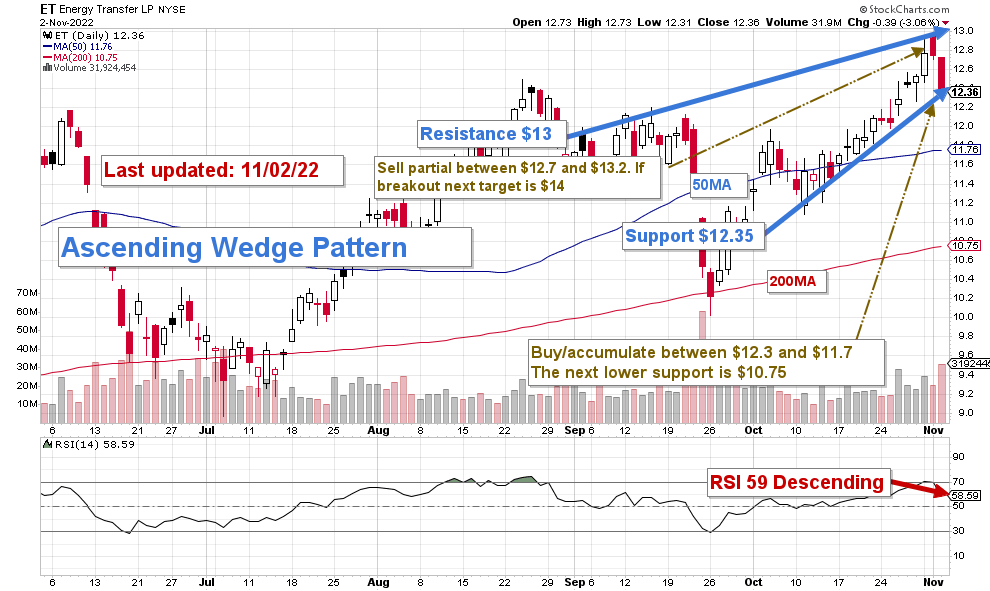
Note: The chart is adjusted for the dividend.
ET forms an ascending wedge pattern with resistance at $13 and support at $12.35. Rising or ascending wedge patterns are bearish chart patterns that signal a looming breakout to the downside.
The trading strategy is to sell LIFO 30% to 35% of your position between $12.7 and $13.2 with a potential new higher resistance at $13.75-$14.50 in case of a breakout which is unlikely after the FED hiked interests by 75-point yesterday.
On the other hand, it is reasonable to start accumulating below $12 with potential low support at $10.75. The breakdown scenario is more likely assuming a possible recession in 2023. However, I recommend waiting until below $11 to start accumulating. Patience is the key.
Warning: The TA chart must be updated frequently to be relevant. It is what I am doing in my stock tracker. The chart above has a possible validity of about a week. Remember, the TA chart is a tool only to help you adopt the right strategy. It is not a way to foresee the future. No one and nothing can.
Author’s note: If you find value in this article and would like to encourage such continued efforts, please click the “Like” button below as a vote of support. Thanks!
Be the first to comment