

FeelPic
Have you ever invested in CLO-related investment vehicles?
CLOs, Collateralized Loan Obligations, are securitizations of a portfolio of Senior Secured Loans. Funds like Eagle Point Credit Company Inc. (NYSE:ECC) invest in CLOs. The CLO market is the largest source of capital for the U.S. senior secured loan market
As of 6/30/22, the CLO market had volume of ~$107B, and was on pace to set a new record.
CLO site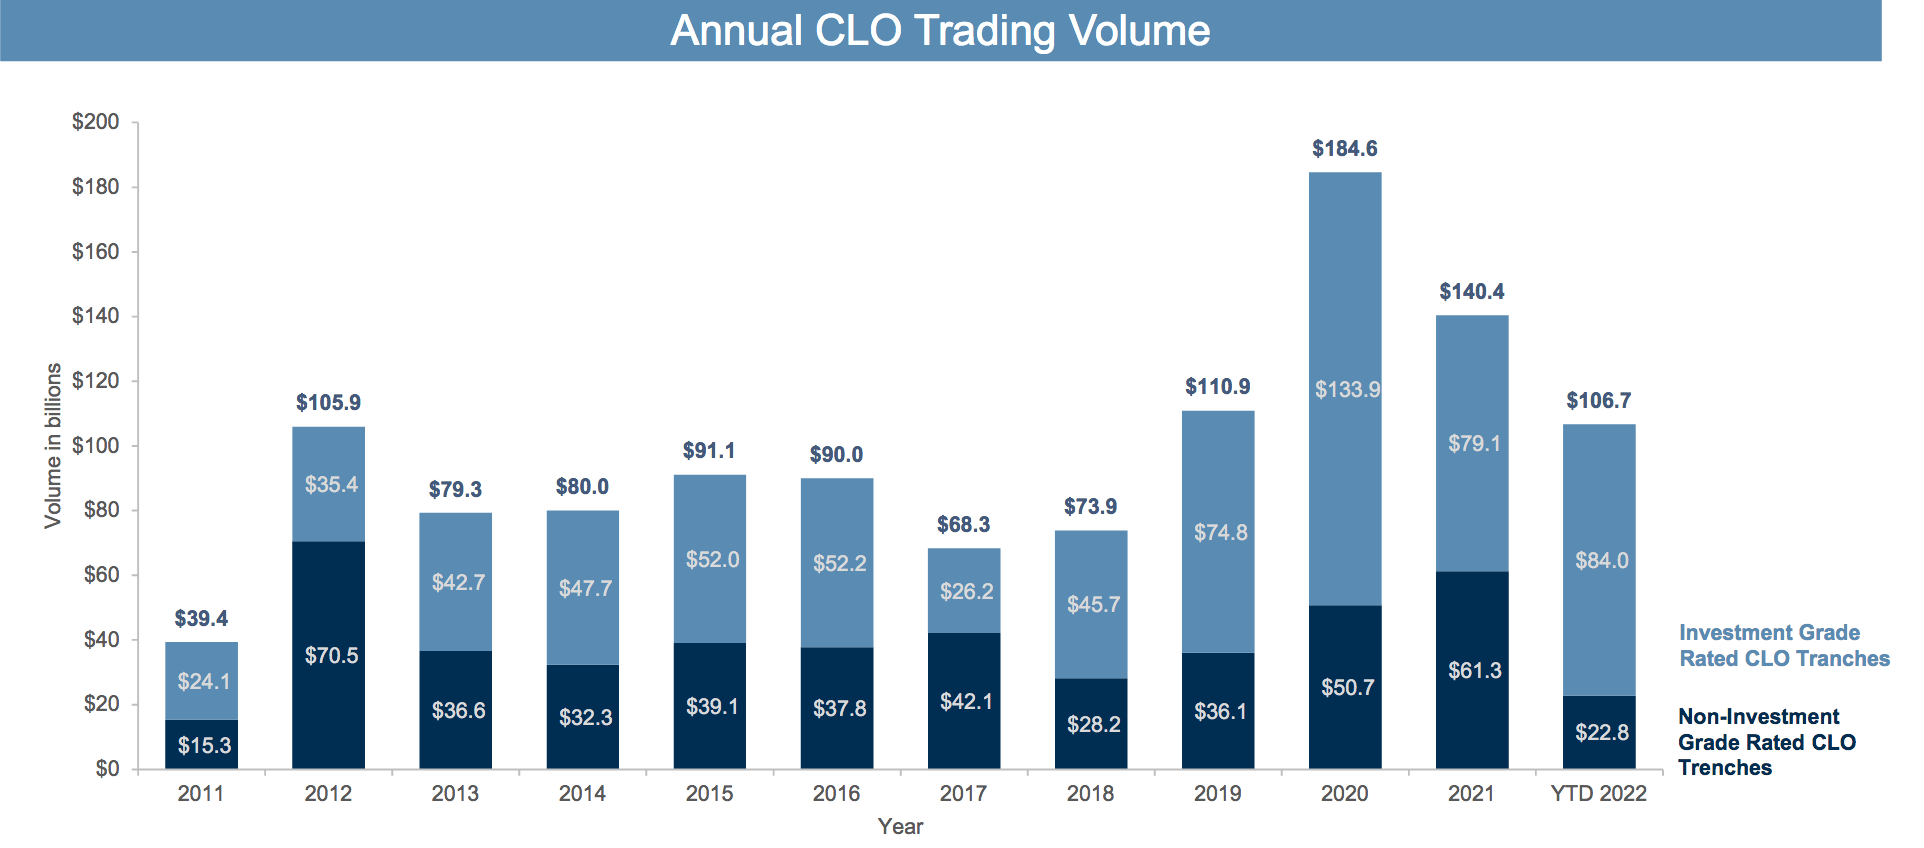
Profile:
Eagle Point is a closed-end fund, a CEF, launched and managed by Eagle Point Credit Management LLC. It is focused on CLO securities and related investments (as well as other income-oriented investments), and each member of the senior investment team is a CLO industry specialist who has been directly involved in the CLO market for the majority of his career.
ECC held 122 CLO equity securities, with 1862 underlying obligors, as of 6/30/22, with ~94% exposure to floating rate Senior Secured loans. (ECC site)
Its annual expenses look much higher than other CEFs we’ve covered, running at 6.51% for management and other expenses. There’s also 3.21% in interest expense:
Hidden Dividend Stocks Plus
The weighted average loan spread is 3.6%, with a B+/B rating, and an average maturity of 4.8 years. ECC’s investments are mostly transacted in U.S. currency, 98.46%.
ECC site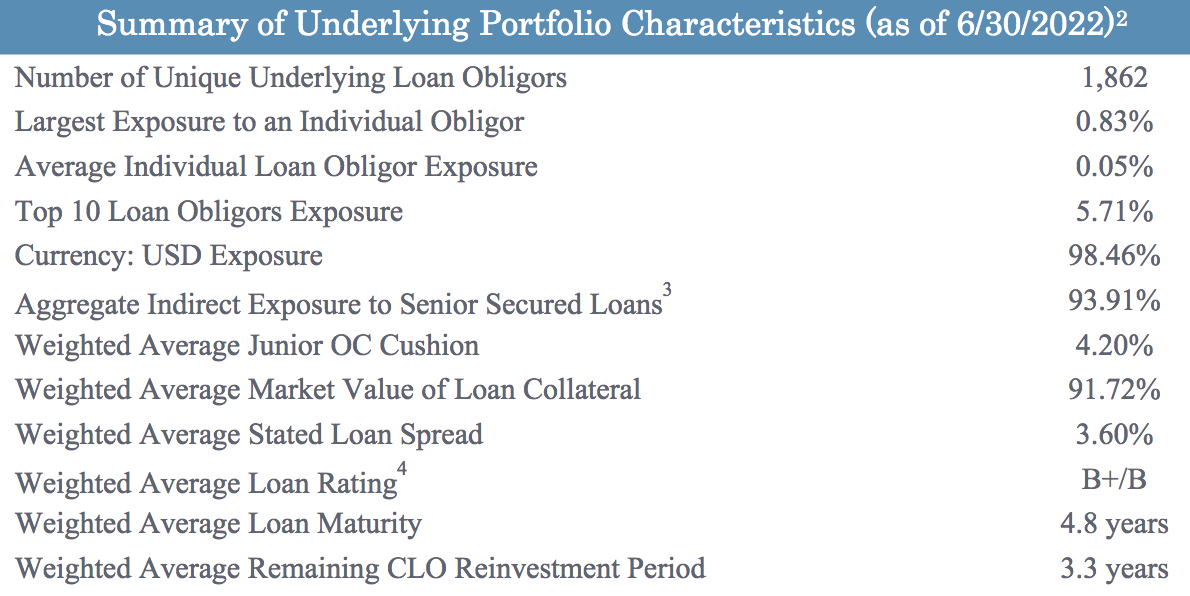
Earnings:
ECC earned Net investment income, NII, and realized capital gains of $0.43/common share, vs. $.30 in Q1 ’22. It received cash distributions of $1.12/share, and paid out $.14/share in common distributions. NAV per common share was $10.08 as of 6/30/22, vs.$12.64 as of 3/31/22.
ECC site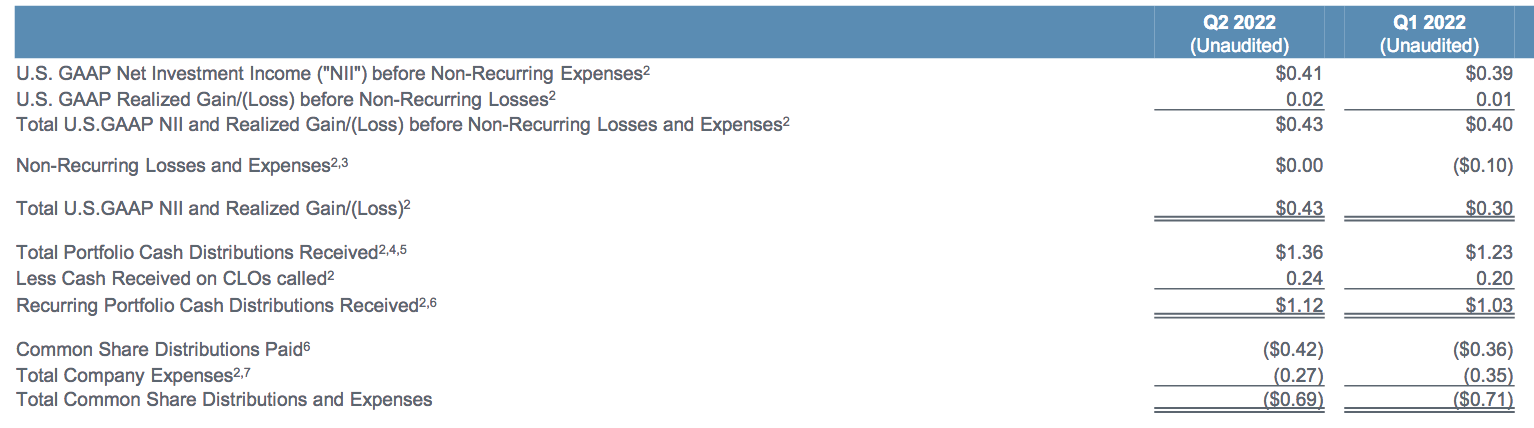
In Q1-2 2022, ECC’s total Investment Income rose 50%, while NII rose 75.6%. Net Realized Gains, which are lumpy on a quarterly basis, were minimal, while Net Unrealized Gains swung from positive $57M to -$153M.
NAV/Share fell -22.3%, to $10.08, vs. $12.97/share in Q2 ’21, due to higher non-cash markdowns, and the share count swelling by 26.6%. Interest Expense continued to climb, rising 18.8% in Q1-2 ’22, after rising ~38% in 2021, as management ramped up the portfolio’s size to drive growth.
Hidden Dividend Stocks Plus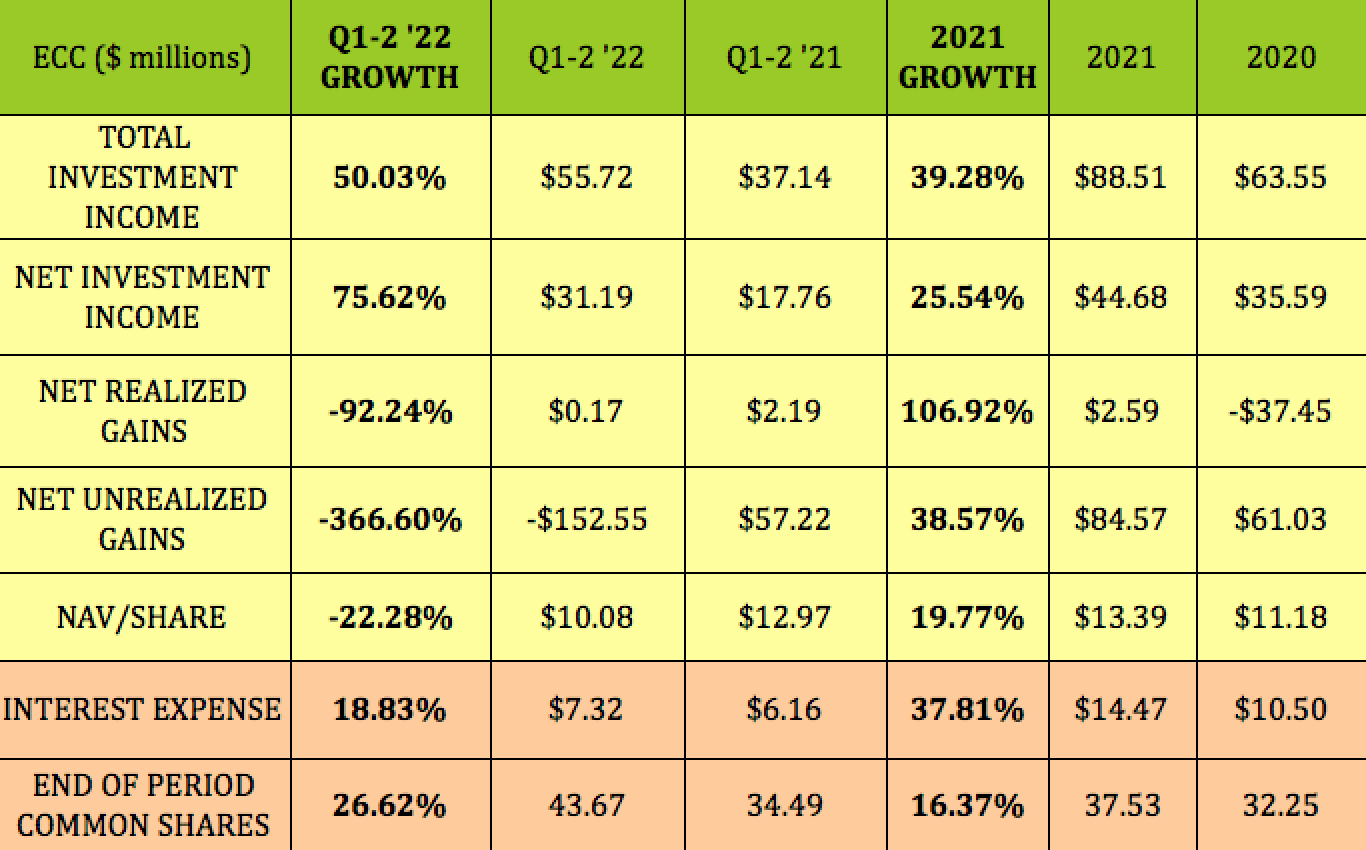
Dividends:
ECC pays $.14/share monthly, yielding nearly 16%, not including special distributions. Management declared a special distribution to common stockholders of $0.25/share to be paid on October 31, 2022, to stockholders of record as of October 11, 2022.
Hidden Dividend Stocks Plus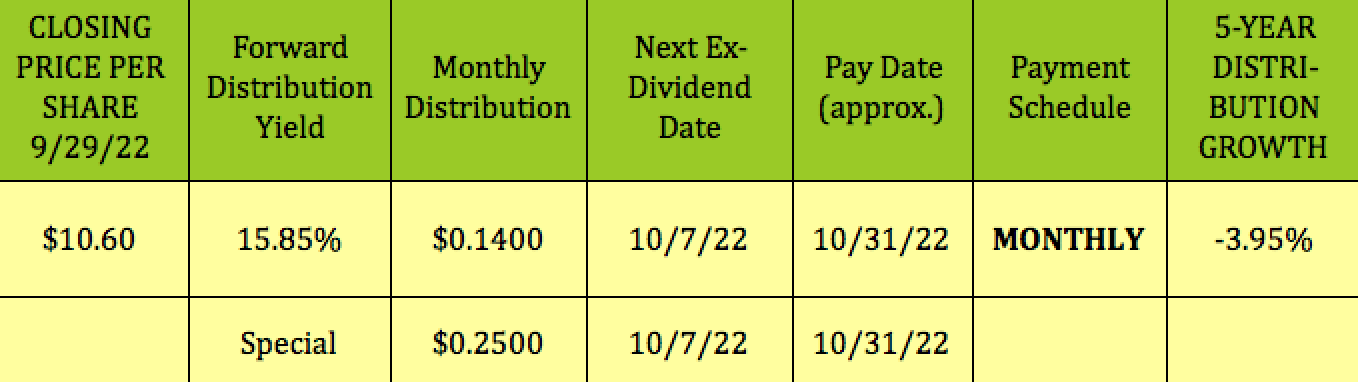
Pricing:
Since NAV/Share is calculated at the end of each trading day, you have to look at the most recent closing values to determine the current NAV discount or premium. Buying CEFs like ECC at a deeper discount than their historical average discounts/premiums can be a useful strategy, due to mean reversion.
At its 9/29/22 $10.60 closing price, ECC was trading at a -6.36% discount to its NAV/Share of $11.32, which is much cheaper than its 1-year 6.29% average premium, its 8.80% 3-year average premium, and its 11.87% 5-year average premium.
However, the average Price/Book for the debt CEF industry is just .85X, a 15% discount to book, so ECC is getting a premium vs. its industry. While ECC’s inception NAV/Share was $19.93, its 9/29/22 NAV/Share was $11.32. However, ECC has paid out a cumulative $16.54 in distributions since its 2014 inception.
Hidden Dividend Stocks Plus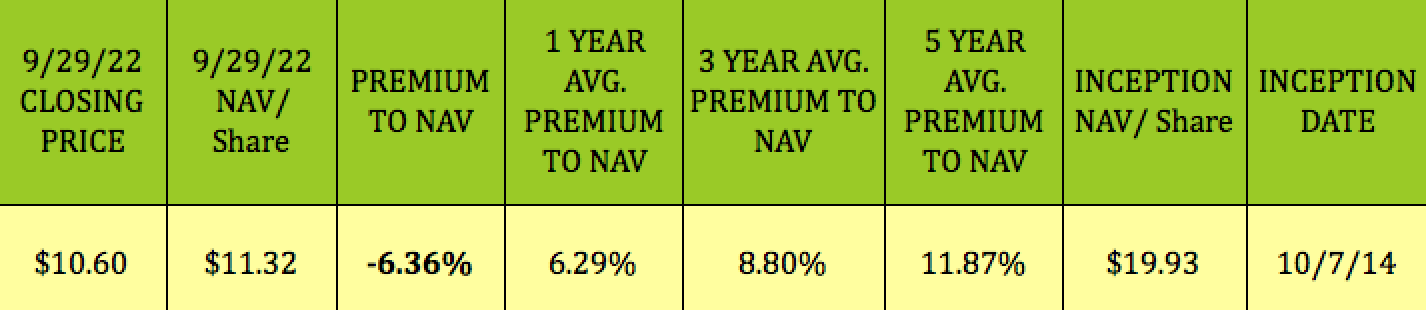
Holdings:
ECC’s portfolio consists of ~86% in CLO Equity positions, ~7% in CLO Debt, ~5% in Loan Facilities, plus cash:
ECC site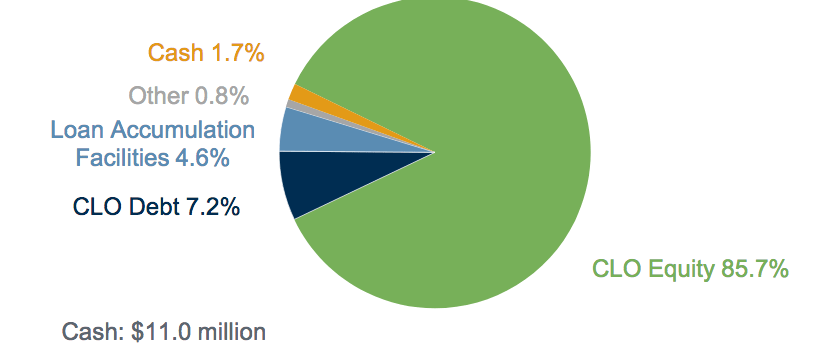
ECC’s holdings look well-diversified, with Tech, Health Care, and Publishing forming ~27% of ECC’s top industry holdings, and 7 other industries comprising ~29%:
ECC site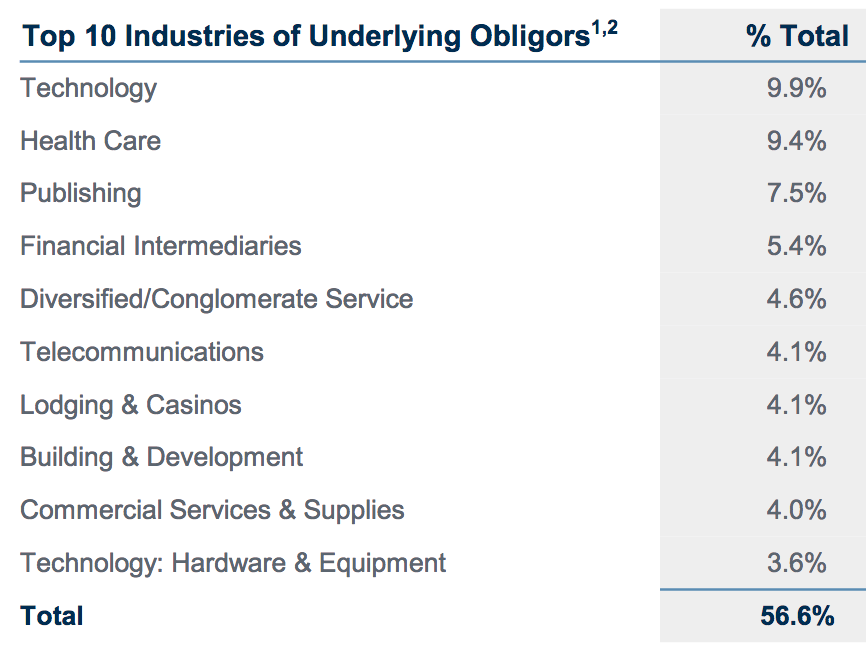
All of ECC’s top 10 positions are less than 1%. Univision dropped from the top 10 in Q2 ’22, replaced by McAfee.
ECC site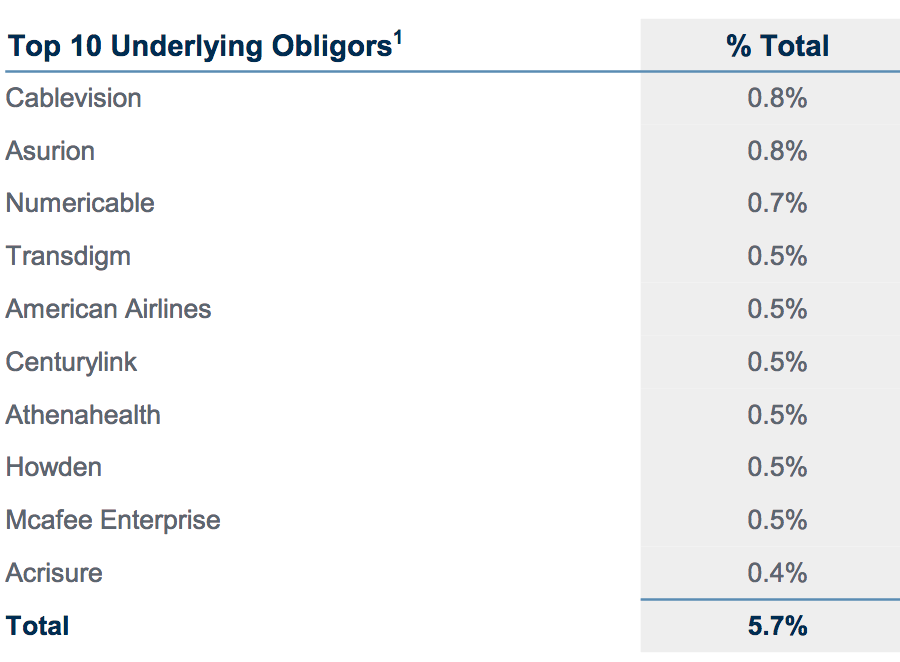
The portfolio also is well-laddered out into the future, with just ~8% maturing before 2025, when it starts maturing at a ~16% rate over 2025 through 2027:
ECC site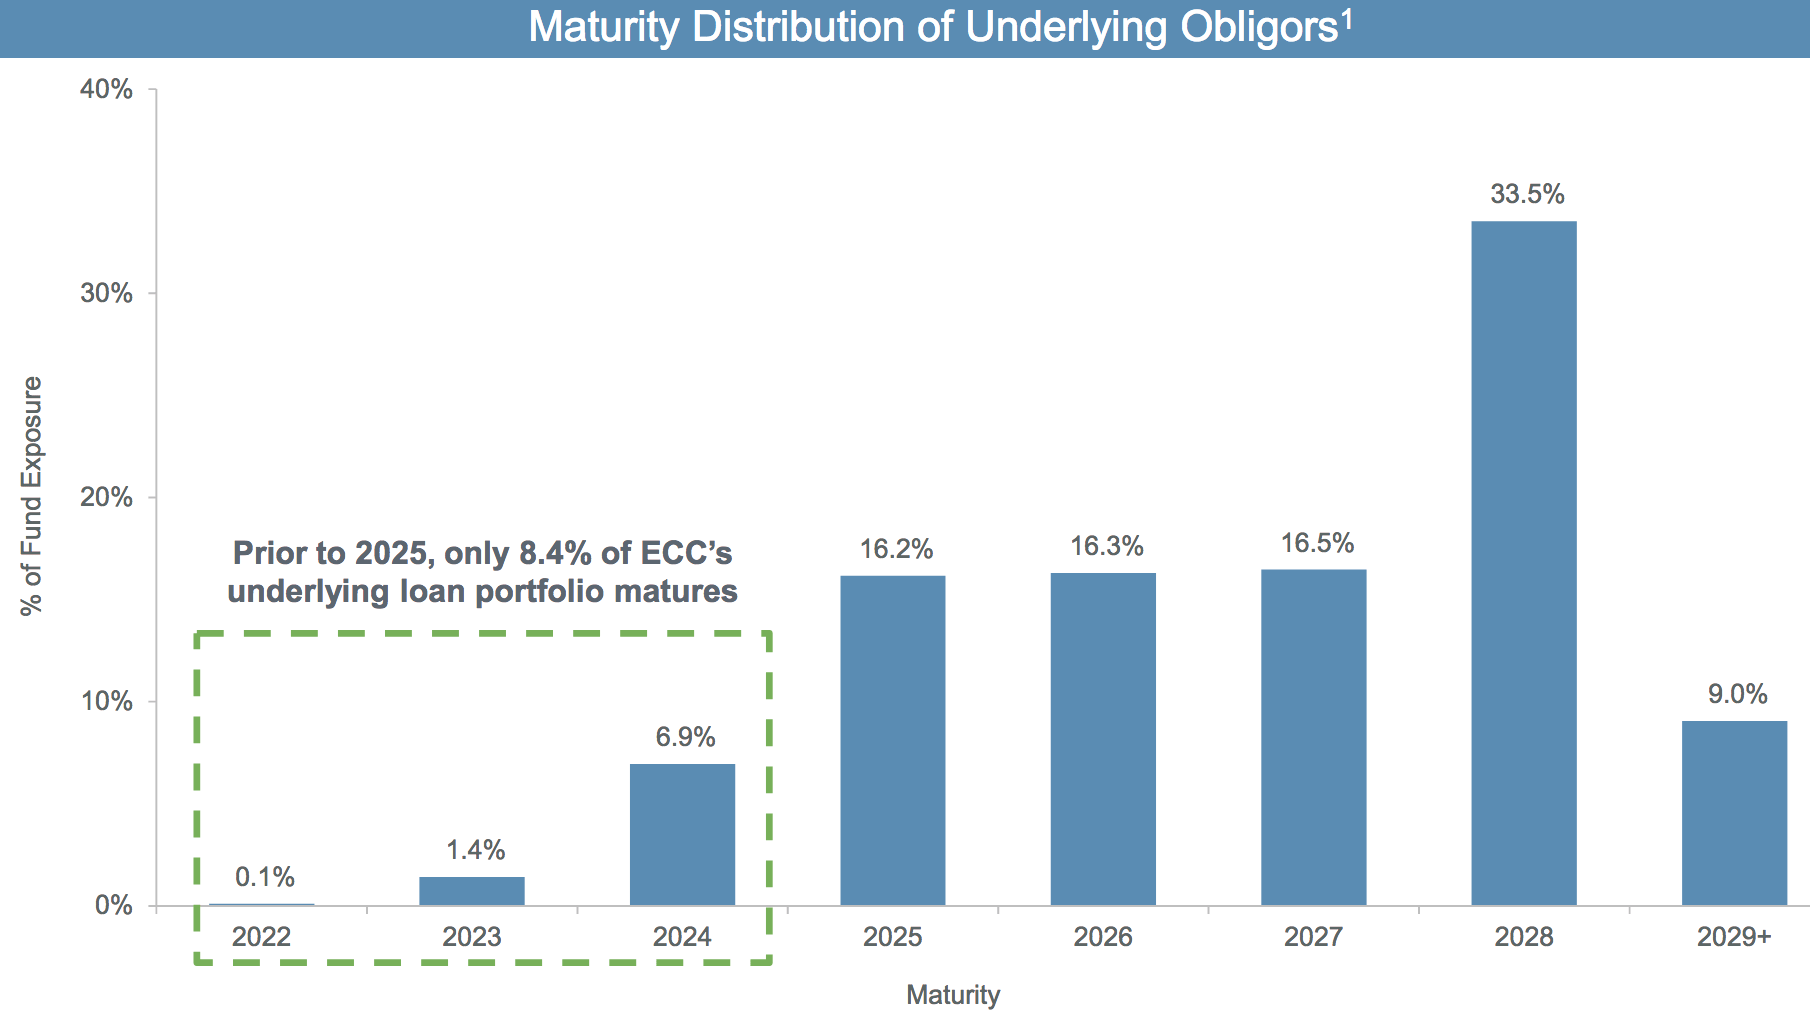
Debt:
ECC has 3 unsecured Notes maturing in 2028, 2029, and 2031, plus a Preferred series maturing in 2031, and a perpetual preferred series D, with a 2026 call date.
ECC site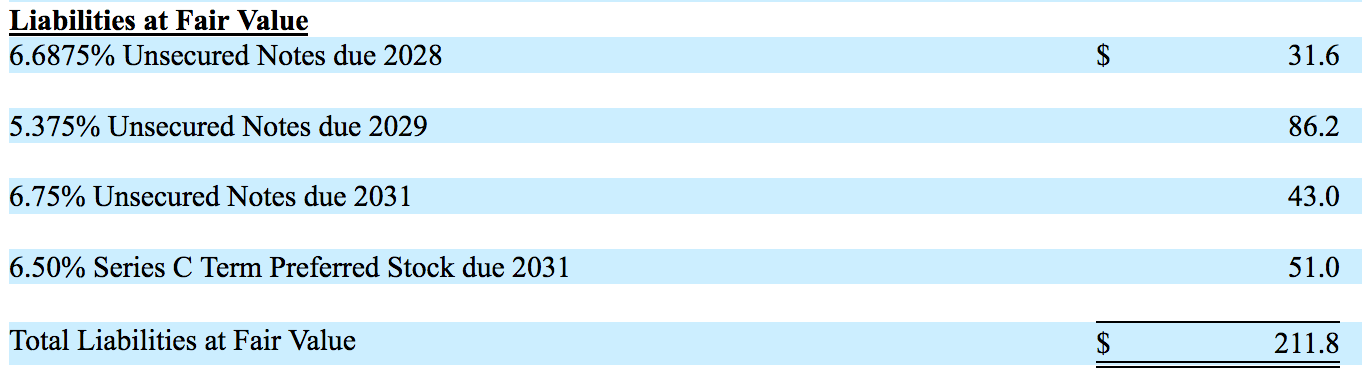
Asset/Debt coverage was 3.98X, as of 6/30/22, vs. 5.34X on 12/31/21, while Asset/Preferreds declined from 3.31X to 2.69X, as of 6/30/22.
ECC site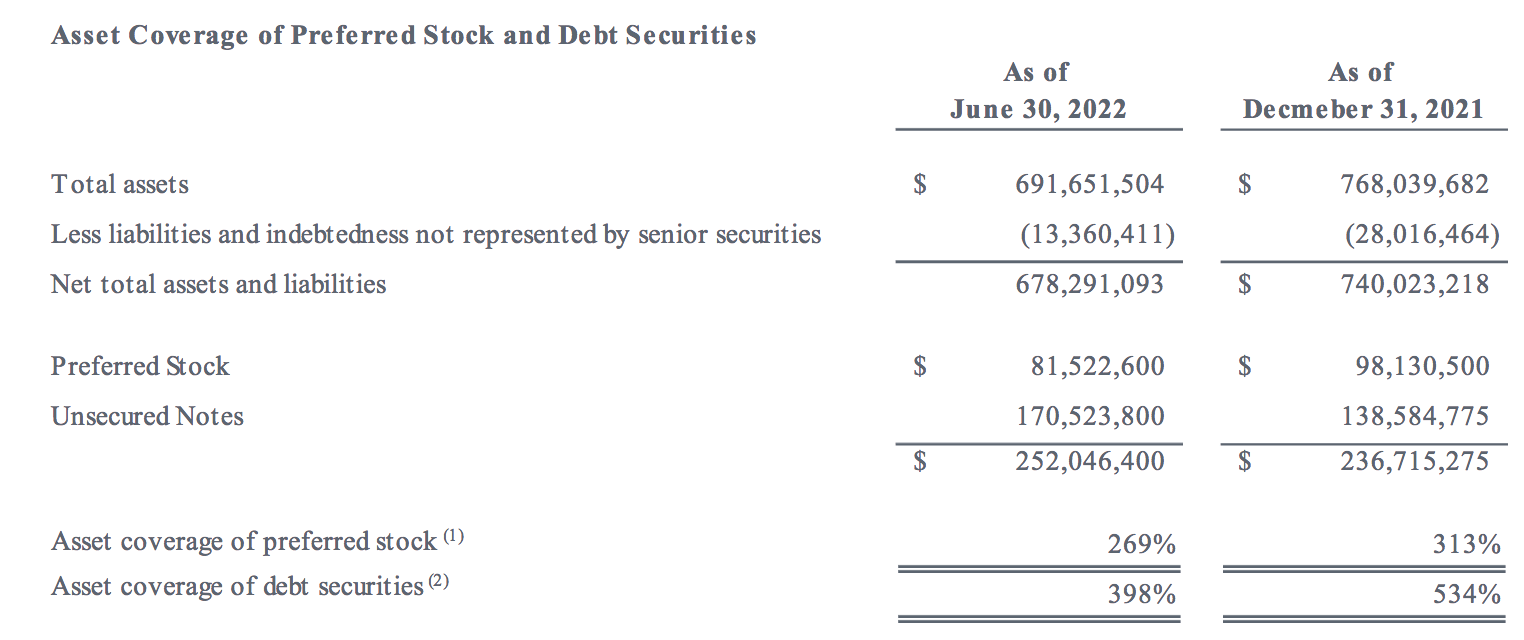
Parting Thoughts:
ECC has outperformed the broad Debt CEF industry averages over the past month, year and so far in 2022; but has lagged the S&P 500 over the past quarter, year, and in 2022. However, it has vastly outperformed the Debt CEF industry and the S&P over the past year, on a total return basis.
Hidden Dividend Stocks Plus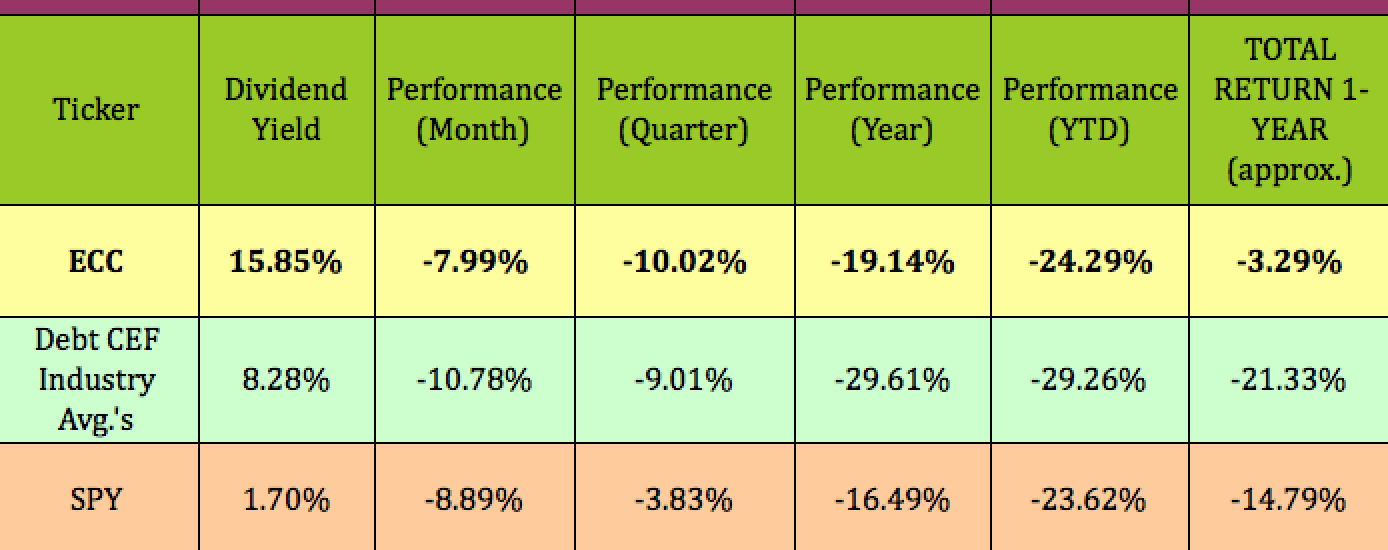
Given the current market volatility, you may want to just add ECC to your watchlist, before jumping in – while its very attractive yield gives it a better total return than the market, shareholders are still swimming upstream against a very negative market.
If you’re interested in other high-yield vehicles, we cover them every Friday and Sunday in our articles.
All tables by Hidden Dividend Stocks Plus, except where otherwise noted.
Be the first to comment