

JuSun
Stocks soared yesterday, wiping out the prior two days of losses, after an economic report showed that the service sector rebounded in July and Fed governor James Bullard reaffirmed Chairman Powell’s earlier assertion that the U.S. economy is not in a recession. We had some help from oil too, which continues to decline in price, falling 4% to just above $90 per barrel. As a result, energy was the only losing sector. The S&P 500 has now risen 13% from the June low, while the Nasdaq Composite is up 19%.
Finviz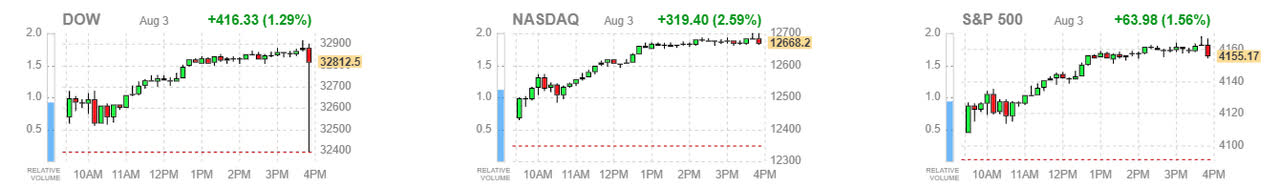
It has been my contention that we would start converting bears to bulls during the second half of this year, as rates of change in economic growth, monetary policy, and inflation move in a more favorable direction. I also expected the stock market to start discounting this as earnings for the second quarter were reported to be not as bad as feared, which appears to be happening. That said, we don’t want to see stock prices run up too quickly, easing the financial conditions that the Fed has worked hard to rapidly tighten in an effort to rein in inflation. We also don’t want to see economic strength to the degree that it undermines the decline in the inflation rate. This balancing act should run through the end of the year, providing investors with plenty of opportunities. Don’t fear missing out.
CNBC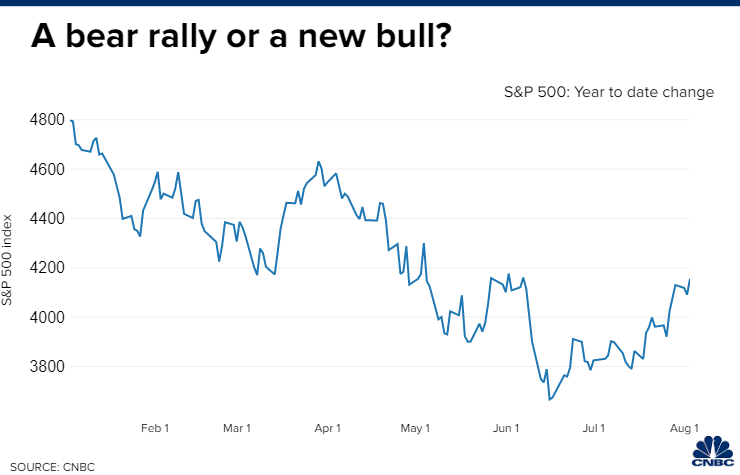
As inflation rose, the Fed tightened, and the rate of economic growth slowed during the first half of this year, I counseled to focus on rates of change. This would be more important to the market’s performance than absolute numbers. For example, a $4 gallon of gas sounds like a horrible price, but if the price was $5 a couple of months ago then it sounds pretty darn good. That is a positive rate of change, and it comes as no surprise that peak gas coincided with the June low in stock prices. By the same token, peak hawkishness from Fed officials also coincided with the bear-market low, which has now eased, as evidenced by a lower peak in short-term interest rates for this rate-hike cycle. Still, fears of recession continue to linger.
Finviz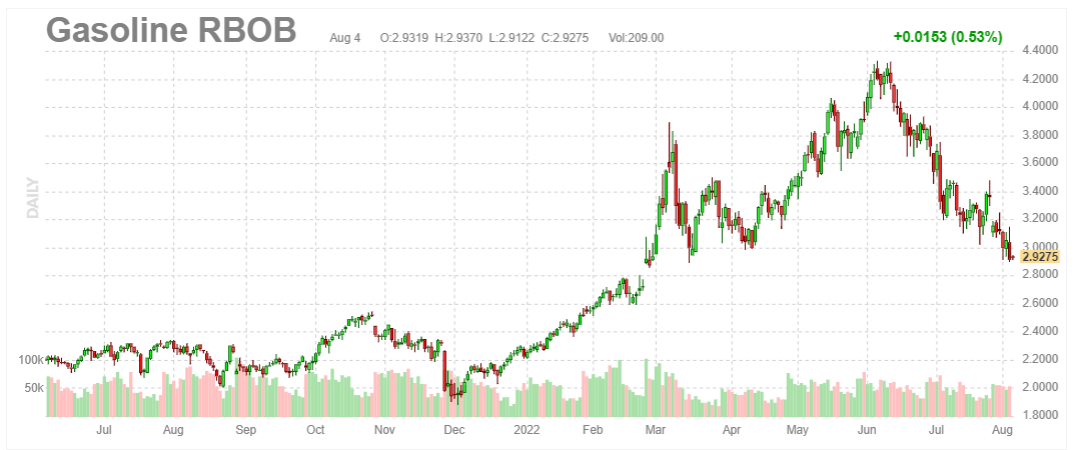
If there were any remaining questions about recession, the Institute for Supply Management’s index that measures service sector strength should put an end to them. The index rose to a three-month high of 56.7 in July, handily beating expectations of 53.5. The sub-indexes of business activity and new orders soared to 59.9, which bodes well for future strength. On the inflation front, the supplier deliveries sub-index dropped four points to its lowest level since early 2021, indicating that bottlenecks are opening, and the prices sub-index declined by the most in five years, pointing to reduced inflationary pressures. This report was a homerun.
ISM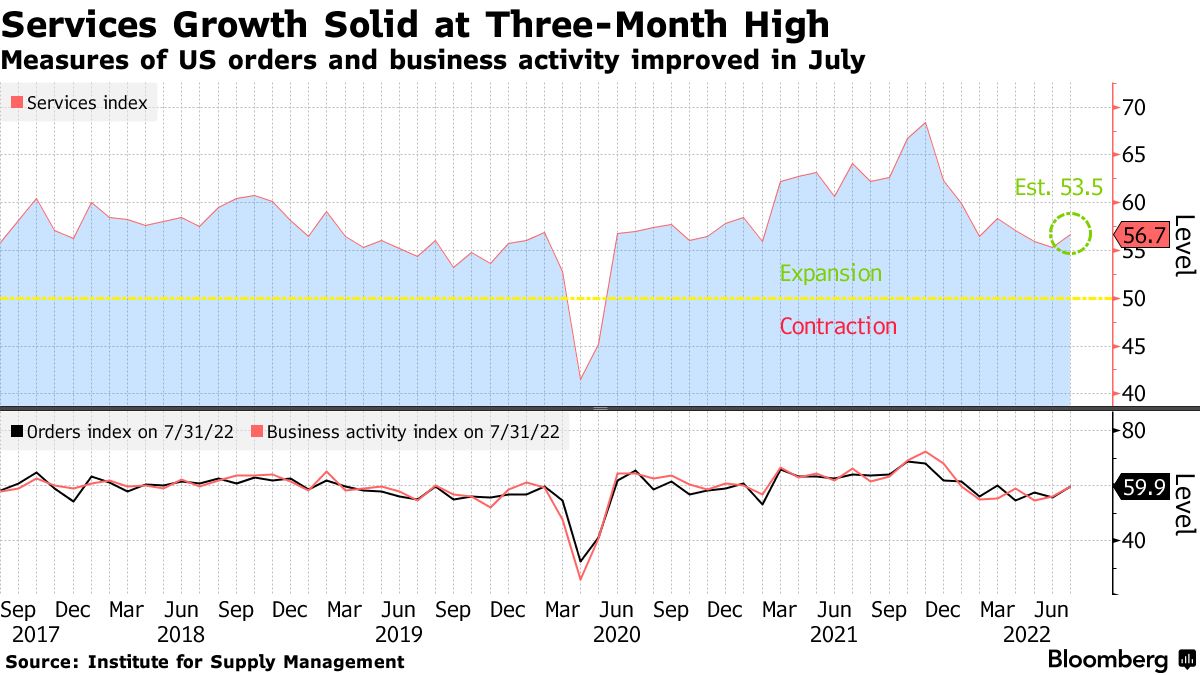
I think the market recovery to date has priced in these positive monetary, inflationary, and economic developments. I can also feel the very early innings of optimism, which suggests the market is ripe for a pullback in price. Friday’s job report could be the trigger if the numbers are stronger than expected. That is all it will take to reignite worries about inflation and tighter monetary policy, but it will also help to digest the gains of the past month and build a stronger base on which to push higher. Therefore, I would not fear missing out. This market should give investors plenty of opportunities to capitalize moving forward.
Technical Picture
From a technical perspective, you can see in the chart below that we are just underneath a ceiling, which is the overhead resistance from the early June high. If we can break above that level, the declining 200-day moving average is just above at approximately 4,350. We are also approaching an overbought condition (70) on the Relative Strength Index (top of chart), which suggests we have run up a little too quickly here. I think it’s more likely the market finds an excuse to pullback from here rather than breakout.
Stockcharts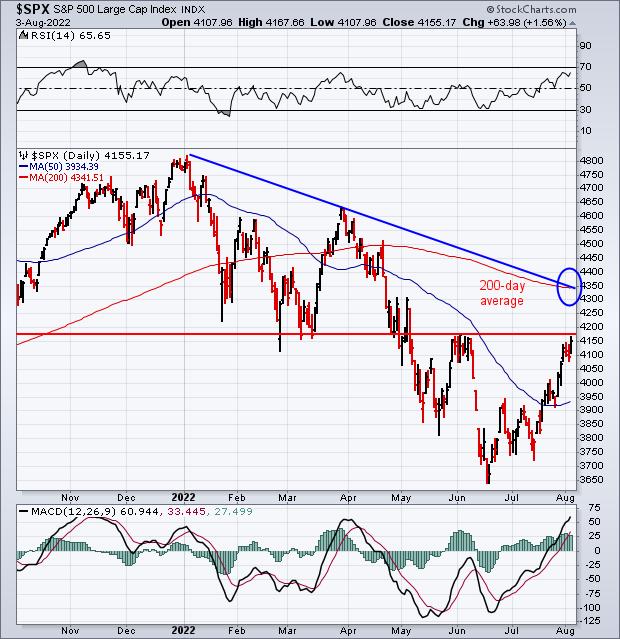
Be the first to comment