

CRUDE OIL & GOLD TALKING POINTS:
- Crude oil prices struggling to add to OPEC Plus-inspired gains
- S&P 500 futures show risk-off tilt, TED spread flags credit stress
- Gold prices down with stocks, testing below range support level
Crude oil prices rose for a third day in what looked like pre-positioning ahead of today’s deployment of the next round of OPEC+ output cuts. The cartel-led grouping of major producers had begrudgingly agreed to the effort after managing to cool tensions between its two largest members, Saudi Arabia and Russia.
Norway likewise announcement output cuts while economic data from the US and China suggested demand in the top two oil-consuming markets may be on the mend. DOE data showed US gasoline demand surged by the most in almost 20 years last week. Meanwhile, mapping technology company TomTom International said traffic in China’s biggest cities is returning to pre-coronavirus outbreak levels.
Oil is struggling to build follow-through in early Friday trade however as market-wide sentiment sours, pulling the cycle-sensitive commodity lower. Bellwether S&P 500 futures are pointing lower ahead of the opening bell on Wall Street, suggesting a risk-off tilt in the final hours of the trading week.
Interestingly, gold prices are down alongside shares, once again reminding investors of its dubious “haven” credentials, market lore notwithstanding. The move seems to reflect a pickup in credit market stress that has inspired liquidation and bolstered the appeal of cash.
The TED spread – a measure of funding stress – has conspicuously moved higher over the past 48 hours, adding 4bps. The US Dollar is tellingly on the upswing against an average of its major counterparts. More of the same is likely if the downbeat mood persists.

Recommended by Ilya Spivak
Top Trading Lessons
GOLD TECHNICAL ANALYSIS
Gold prices are testing below support at 1677.81, the 23.6% Fibonacci retracement. Confirming a breakdown on a daily closing basis seems likely to expose the 38.2% retracement at 1634.54 next. Alternatively, establishing a foothold above the 23.6% Fib expansion at 1728.03 appears to see the next major upside barrier at 1771.30, the 38.2% level.
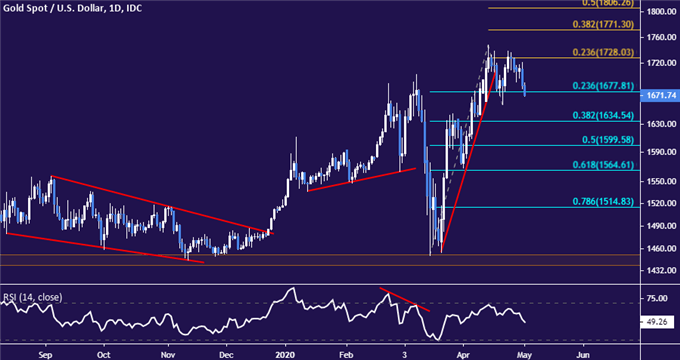
Gold price chart created using TradingView
CRUDE OIL TECHNICAL ANALYSIS
Crude oil prices are testing support-turned-resistance in the 19.29-20-.08 area. A daily close above this barrier opens the door for a test of the 27.40-29.11 zone. Breaching the latter barrier would appear to conclusively clear the bounds of the downtrend in play since early January. Immediate support is at 10.27, with a move below that setting the stage for a return April’s shocking spike low.
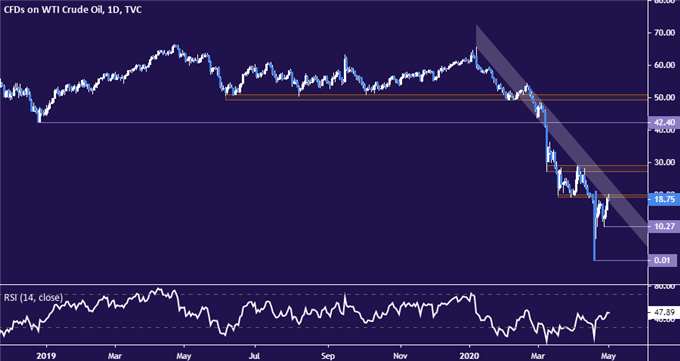
Crude oil price chart created using TradingView

Recommended by Ilya Spivak
Building Confidence in Trading
COMMODITY TRADING RESOURCES
— Written by Ilya Spivak, Currency Strategist for DailyFX.com
To contact Ilya, use the comments section below or @IlyaSpivak on Twitter
Be the first to comment