

designer491
THE RISE AND FALL OF THE CONSUMER
After experiencing the largest government-financed consumption boost in history, household demand for goods and services is poised to fall off a cliff. The US economy simply cannot handle the Fed’s continued monetary tightening. This is the onset of a vicious stagflationary environment. The unprecedented combination of excessive debt, the bursting of speculative asset bubbles, and the persistence of inflation due to structural supply imbalances makes the current economic and market environment truly precarious. A major contraction in consumer demand is imminent. These factors will soon pressure the Fed into a policy dilemma.
The Fed is facing one of the worst predicaments of its existence as it continues to raise interest rates into an economic downturn. The problem is that sooner rather than later it will be forced to relent and inject liquidity into an already inflationary environment.
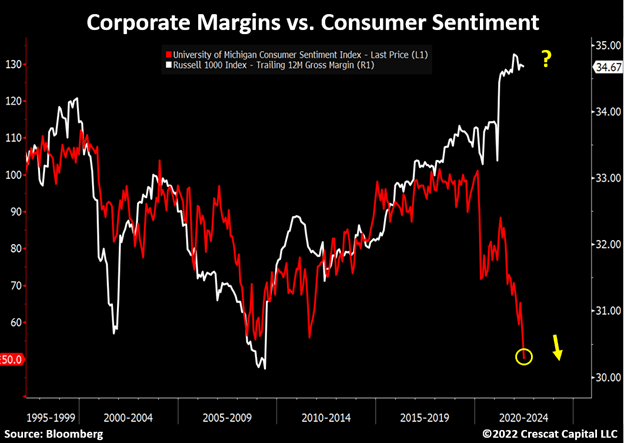
The historically elevated cost of living, surging mortgage rates, and tightening financial conditions are about to trigger a collapse in real household spending. The decline in consumer sentiment to all-time lows is already forecasting a high probability of recession including corporate profit margins that are ripe to plunge from peak unsustainable levels and lead to rising unemployment.
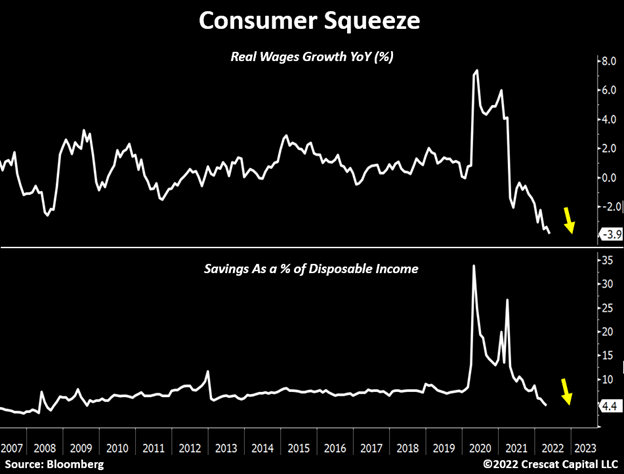
Consumers at a Breaking Point
While workers are starting to make more money, the growth in salaries is not outpacing inflation. In real terms, wages are declining by almost 4%, worse than the Global Financial Crisis.
After a historic surge, saving rates are also plummeting. Relative to disposable income, they are now at the lowest level in 14 years. All these factors combined are likely to cause real consumer spending to fall significantly.
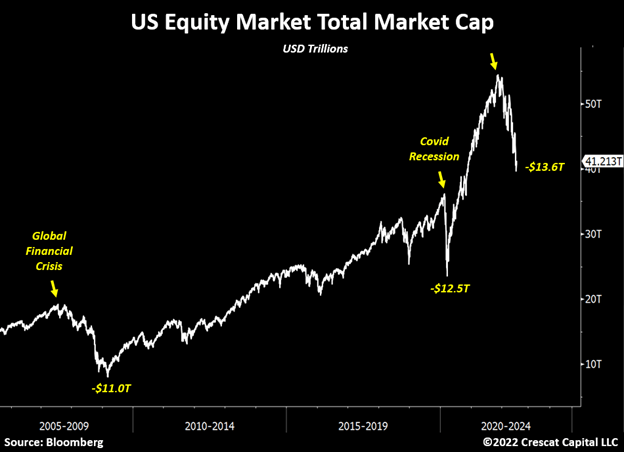
Drawdown in Household Buying Power
The recent decline in equity markets should also drastically impact consumer demand. US stocks have already lost $13 trillion in market cap since the downturn started. That is already a greater capital loss than during the Global Financial Crisis and Covid Recession.
Corporate Margin Squeeze Still Ahead
In addition to the consumer demand side risks laid out above, today’s inflation problem is likely to compress profit margins significantly from record levels. US companies are being challenged by a combination of systemic issues:
- The steep rise in the cost of capital
- Structurally rising raw materials prices
- Workers demanding higher wages
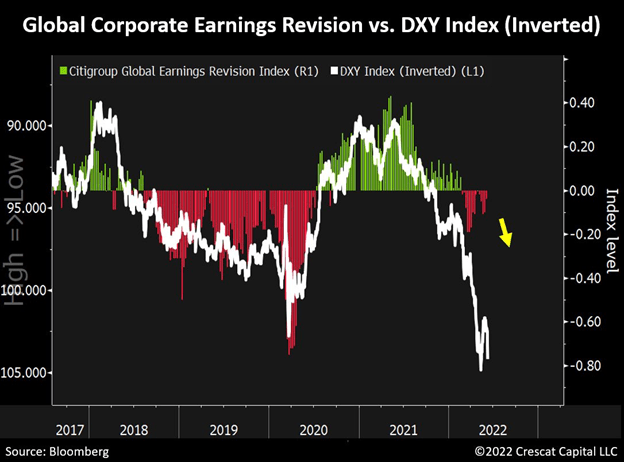
The recent strength of the dollar is also an important factor to consider. History shows that as the US currency appreciates relative to its peers, significant declines in corporate profits tend to follow. The chart below illustrates this relationship between the Dollar Index (inverted) and the Citigroup Global Earnings Revision index. Analysts are slow to incorporate macro factors like currency changes into their earnings estimates. As a result, we expect US multinational companies to be subject to material negative earnings surprises for the June quarter now ending.
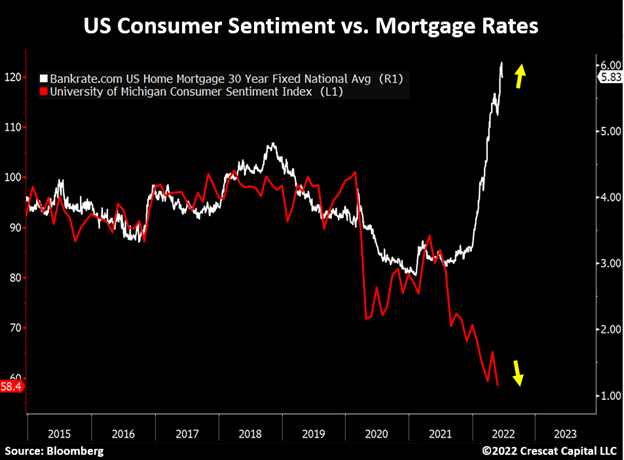
Mortgage Rates Yet to Impact Household Spending
For those who believe consumer demand will remain strong after 30-year mortgage interest rates doubled in the last six months, we think it is time to reconsider that view. According to Goldman Sachs, the median monthly payment of a 30-year mortgage is up 56% year-over-year. We strongly believe this factor alone will handicap household spending in the months ahead.
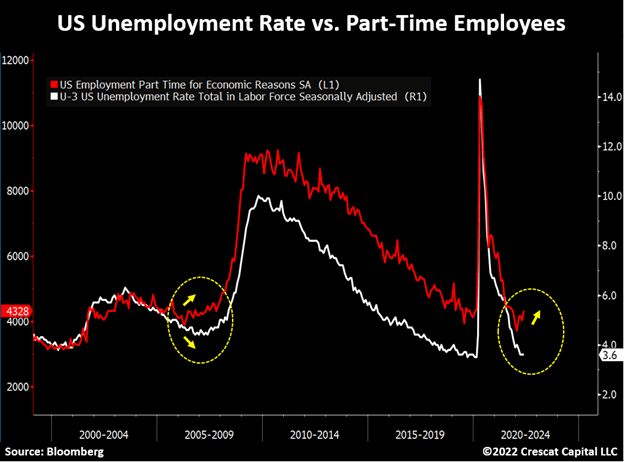
A Rise in Unemployment Rate is the Next Development to Unfold
The rise in part-time employees for economic reasons likely portends significant weakness in labor markets ahead. A similar divergence with unemployment rates also preceded the Global Financial Crisis. As corporate earnings deteriorate, we believe the labor market will suffer accordingly.
Note that initial jobless claims have already been increasing since March. Labor markets are a critical piece of the macro puzzle. If employment activity slowdowns from here, the Fed will be in a policy predicament.
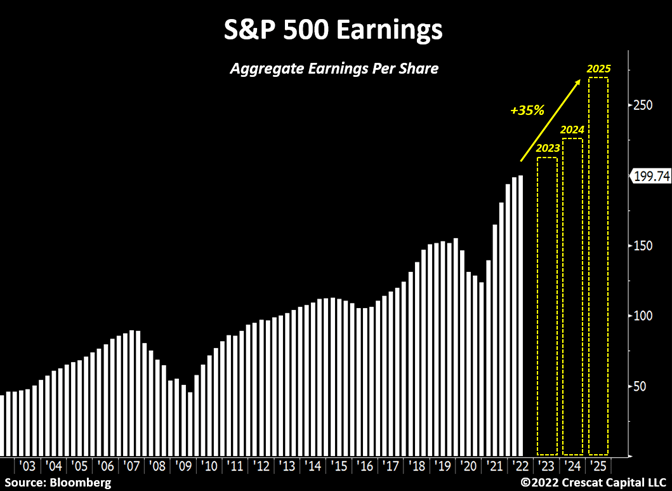
Backward Looking
As usual, Wall Street analysts are looking in the rear-view mirror. After a stimulus-led surge in corporate earnings to record levels, they are projecting another 35% spurt over the next 3 years giving little to no consideration to the monetary tightening and fiscal stimulus falloff. Our view is that corporate profits will nominally contract over this period, while in real terms, we expect a substantial decline.
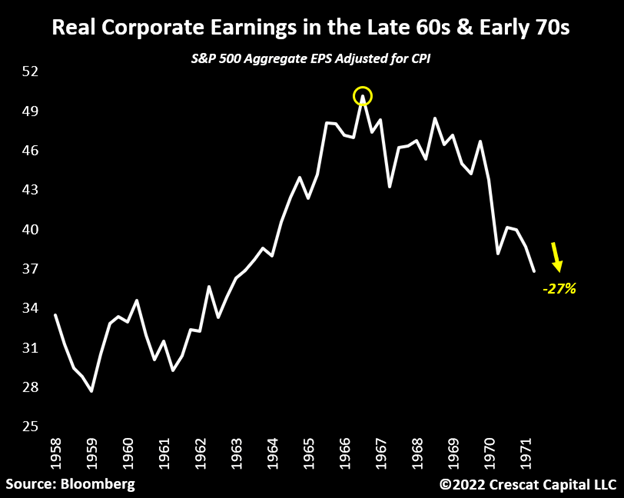
Corporate Profits Collapsed During the 1st Wave of Inflation
Looking back in history, at the very first wave of the inflation problem in the late 1960s and early 1970s, real corporate earnings contracted by almost a third. Such a level of decline is unimaginable for most investors today.
No More Free Money
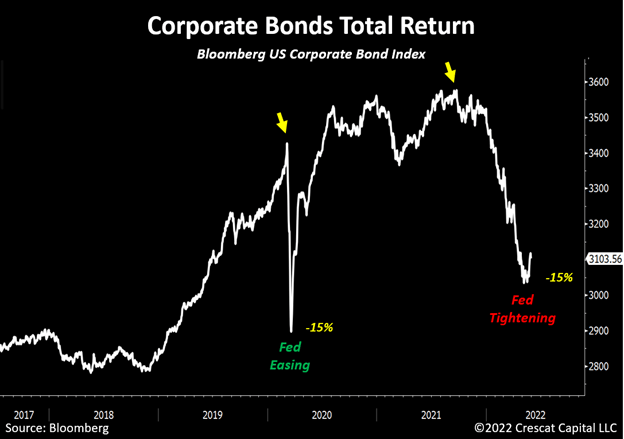
The planned degree of monetary tightening today is a major concern. While we saw the same decline in corporate bond prices in March 2020 as we have over the last year, the difference is that back then, the Fed doubled the size of its balance sheet and the slashed short-term interest rate to 0% to address it. Today’s policy stance is quite the opposite.
Significant Layoffs by Tech Companies on the Horizon
Among all technology stocks in the Russell 3000 index, only 10% of them remain above their 200-day moving average. This sector represents the largest part of the US economy today. If the decline persists, which we believe it will, the stock performance is likely to have a significant impact on the future employment plans of these companies. We are yet to see technology companies significantly shrink their labor force. While some layoffs have already started, we think it will become a bigger trend in the coming months.
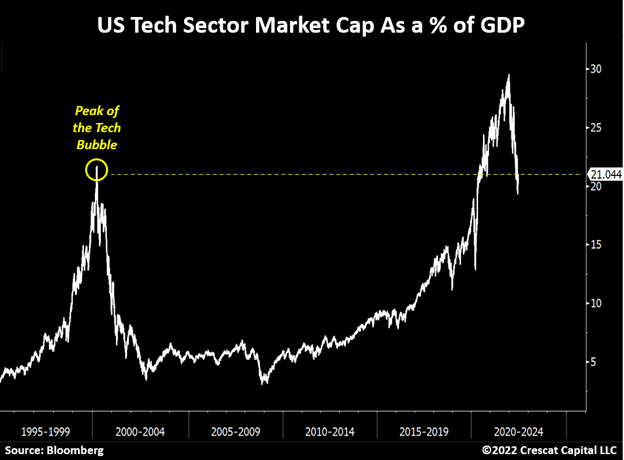
Let us not forget that the bursting of the Tech Bubble 2.0 is only getting started. At the height of the dotcom frenzy in 2000, the technology sector’s overall market cap peaked at 21% of the US economy. Today, despite the recent selloff, this valuation measure is still at Tech Bubble 1.0 highs. We believe the unwinding of this problem has much further to go.
Tightening Financial Conditions
Tightening monetary conditions and the steep rise in the cost of capital will not only negatively impact consumers, corporate earnings, and overvalued financial assets, but it will also cause pain for highly indebted sovereigns.
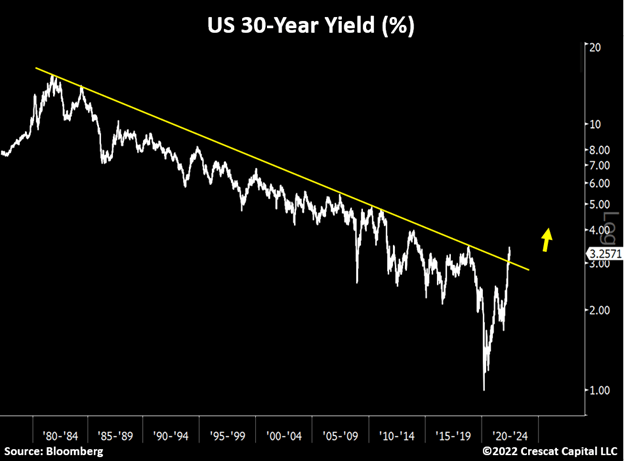
The chart of the US 30-year yield has broken out from a 41-year macro downtrend. This is truly concerning from a leverage standpoint as the US economy remains in a deep deficit in both its current and fiscal accounts.
In the same way the Bank of Japan had to intervene in its bond market, we believe US policy makers will inevitably be forced to impose yield curve control to avoid a sovereign default. The likelihood of success of such policy is highly questionable and risks a monetary crisis given today’s high structurally driven global inflation levels. The stage is set for an incredibly bullish environment for hard-money-based assets over the long term. Precious metals are likely to play the starring role for investors as the most credible alternative to protecting real wealth in this sharply depreciating fiat currency environment. At the same time, the leading precious metals mining companies are likely to soon be entering a Golden Age of alpha generation.
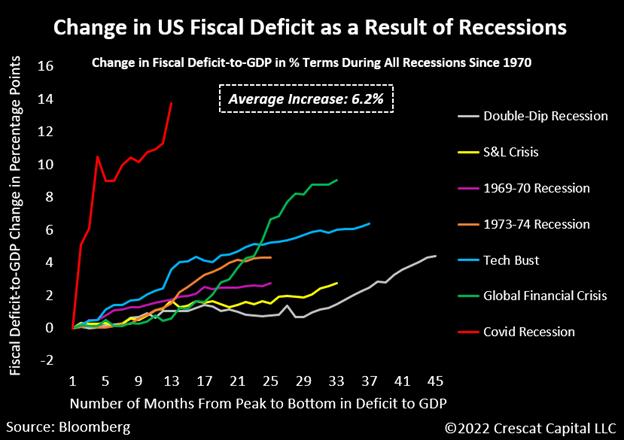
US Fiscal Deficit-to-GDP Poised to Increase in an Inflationary Environment
As we have laid out repeatedly, one of the most concerning issues with US interest rates, particularly at the long end of the curve, continues to be the overwhelming amount of Treasury issuances driven by the excessive twin deficits, fiscal and trade.
We believe the US economy is spiraling headlong into recession. On a real GDP basis, we think one has already begun due to today’s high inflation rate. Unemployment, a lagging indicator, is naturally the next shoe to drop. If indeed we are entering a recession, just like every other economic downturn since 1970, the fiscal deficit to GDP will only increase further. In most cases, it is the result of larger government spending to address the downturn and sometimes also declining nominal GDP levels. Looking at all recessions since 1970, fiscal deficit-to-GDP worsened by an average of 6.2%. We think the next downturn will be no different. However, government spending will likely be increasing with inflation rates already historically elevated so nominal GDP may also be rising. Ultimately, this combination should prove very positive for tangible assets, particularly gold.
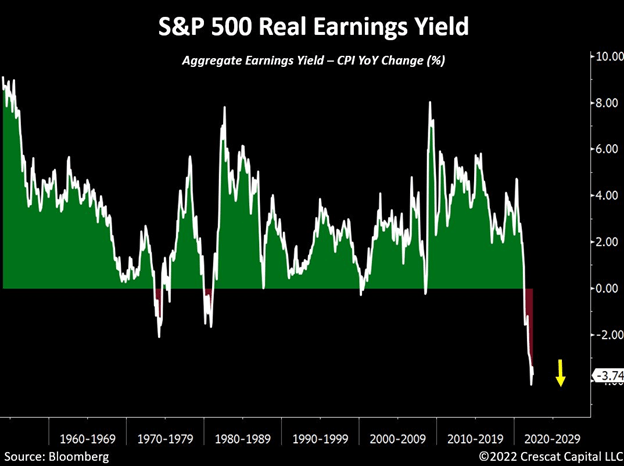
The Fed Can Only Do So Much
Macro imbalances are far worse than any other inflationary regime the US economy suffered. On a real earnings yield basis, the S&P 500 is almost twice as expensive as it was in the 1970s. Never mind the overall debt problem which also weighs on the ability of policy makers to fight inflation. For the first time in history, the US is experiencing a confluence of three macro extremes all at once:
- High government debt to GDP like the post-war 1940s
- Excessive stock market valuation on par with the 1929 & 2000 bubbles
- A resource-driven inflationary crisis environment comparable to the 1970s
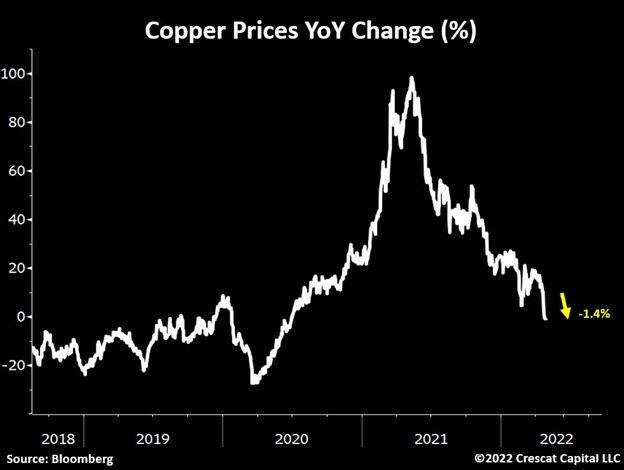
Dr. Copper Signaling Weakness Ahead
It amazes us how much commodities have fallen in just the last month despite years of depressed capital investment in producing new supplies. Protracted commodity bear markets are normally precipitated by years of aggressive capital expansion and overcapacity while today’s setup is the opposite. Still, we believe the recent decline in commodities is reflective of how challenging economic activity is likely to be in the coming months.
As the saying goes, copper is the only metal with a PhD in economics, and it is now down 21.5% from its recent peak. On a year-over-year basis, its performance just turned negative. On the one hand, it is a signal of a weakening economy and fear over Fed tightening that will almost certainly hit consumer demand and corporate earnings. On the other hand, it presents a buying opportunity for the long term for this critical metal in high demand and short supply to meet the needs of a global economy on an energy transition path. New government stimulus programs to bring us out of the recession and facilitate the energy transition should be highly favorable to copper in the years ahead.
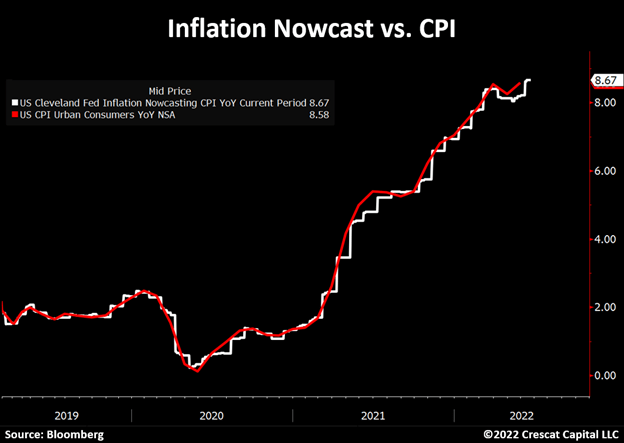
CPI Growth Not Slowing Down Yet
Understandably, the recent fall in commodity prices may raise questions about the future of inflation. Interestingly, the Fed’s inflation nowcast is showing no signs of a slowdown and it is still projecting a slight increase in CPI for this month.
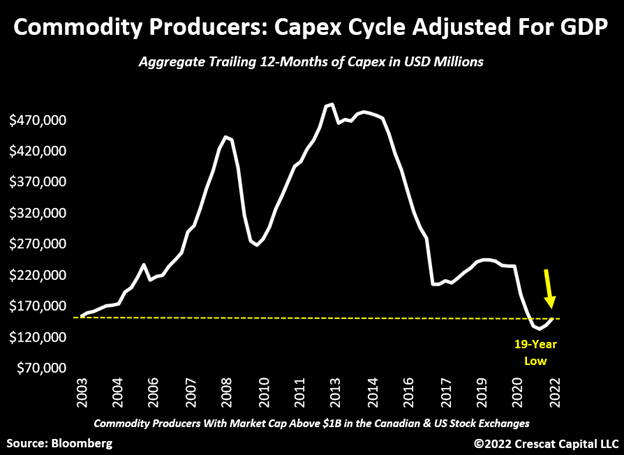
Commodities Bull Market
While the current hawkish stance by the Fed should create downward pressure on inflationary forces by reducing the availability of capital and credit in the economy it will only exacerbate the structural issues we face. As we have presented multiple times, the long-term capital spending among natural resource industries is near historical lows. We strongly believe that until this imbalance gets resolved, the supply of raw materials will remain severely constrained. CAPEX trends take a long time to reverse, and this issue should continue to fuel commodity prices to increase over time.
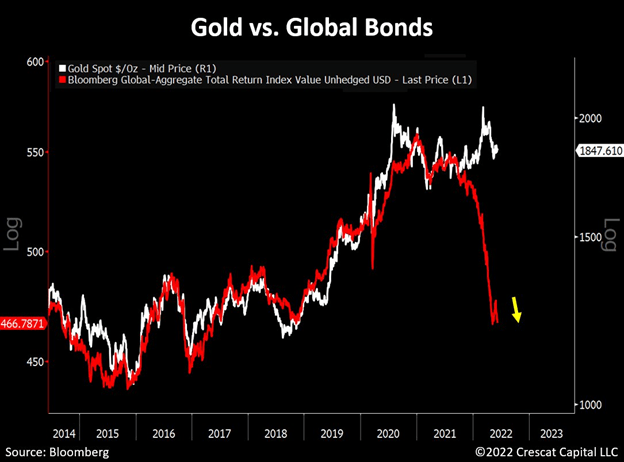
Gold Holding Up
It is very impressive how gold has been holding up despite the bloodbath in global sovereign bonds. Wait until something really breaks in the economy and the Fed is forced to reverse its policy in an already inflationary environment.
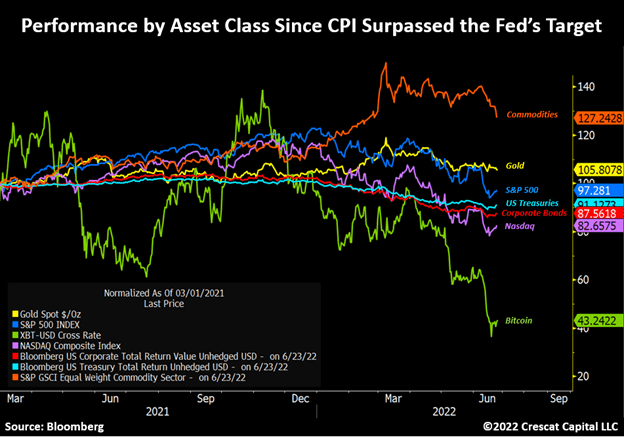
Gold and Commodities Appreciated Since CPI Went Above 2%
Despite the recent pessimism towards precious metals, since the Consumer Price Index went above the Fed’s 2% annualized growth target, gold and commodities were one of the few assets to perform positively in this new macro environment. Note the striking difference with other risk assets that were supposed to benefit from an inflationary regime. Bitcoin, often touted as the “fastest horse” in this environment, is now down over 60% during that period. Similarly, Nasdaq declined almost 18% and is down over 30% since the bear market began.
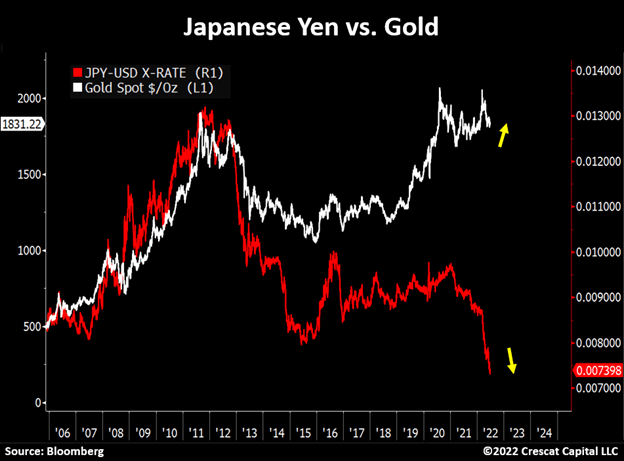
“Safe Haven”
Watch closely what is happening with Japan. It is a highly indebted economy now being forced to loosen monetary conditions in an already inflationary environment. By purchasing unlimited amounts of 10-year Japanese government bonds, the yen has been in freefall relative to the US dollar. Interestingly, the Japanese currency used to be perceived as a safe-haven monetary asset by investors. Note the major divergence in performance between the yen and gold over the years. Japan is facing a true monetary crisis and may soon be forced to abandon its yield curve control, at least temporarily, to stem its currency collapse.
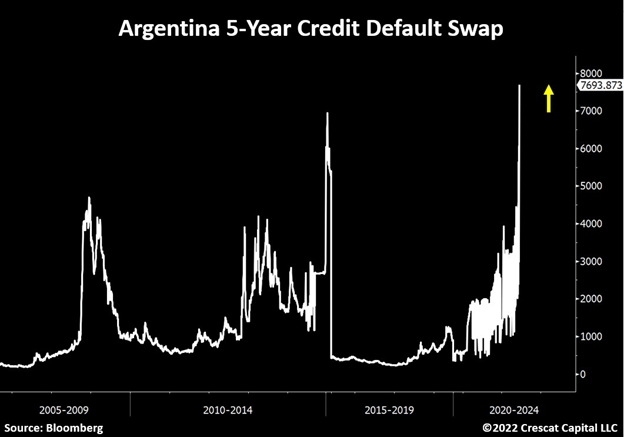
Synchronized Real Growth Contraction
The global economy is interconnected and cannot sustain this level of monetary tightening from developed economies to fight inflation without something cracking. Argentina is a great example. Its sovereign credit default swaps just surged to all-time highs. There are more knock-on effects like this to come before financial conditions ease.
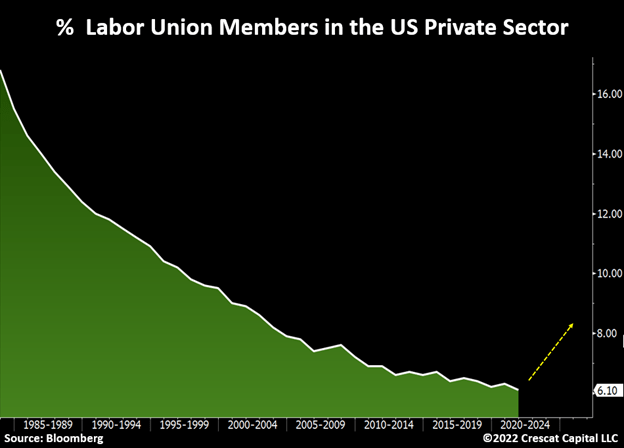
Labor Unionization in Early Innings
As the cost of living rises and workers begin to demand higher wages, we are likely to see a significant pick up of employees joining labor unions. As shown in the chart below, this number was significantly higher decades ago. This will be a critical change socially and economically as we are also likely to see more labor strikes organized by these unions. The years following the Spanish Flu in 1919 and the decade of the 1970s were great analogs.
A Deep Value and High Growth Opportunity
General investor sentiment toward precious metals has become far too negative recently and is wholly unwarranted given the supply-driven inflationary environment. Gold and silver are typically safe havens for such times and should soon prove so again. We think the market environment is creating an excellent entry point for smart capital to get into Crescat’s funds now. This month, we are seeing a substantial inflow commitment into our combined hedge funds. This is mostly from current investors who see the opportunity this pullback has created and have decided to increase their position.
Hockey fever is at an all-time high here in Denver with the Avalanche winning the Stanley Cup. At Crescat, we have recently referred to the Great One’s father’s famous quote, “Skate to where the puck is going, not where it has been”. It might be an overused cliché, but we think it perfectly represents current investor sentiment. Most investors think buying the dip in overvalued tech stocks is the best investment thesis right now because that is where the metaphorical puck has been for the last several years. We think it is going in a different direction. That’s why our funds are positioned in the deep value and high growth opportunities of the new macro cycle. For investors who have the same mentality, now is a tactically-superior time to add to your investments in any of our strategies, particularly the Precious Metals Hedge Fund, given the unusually-favorable risk/reward dynamics in our favor.
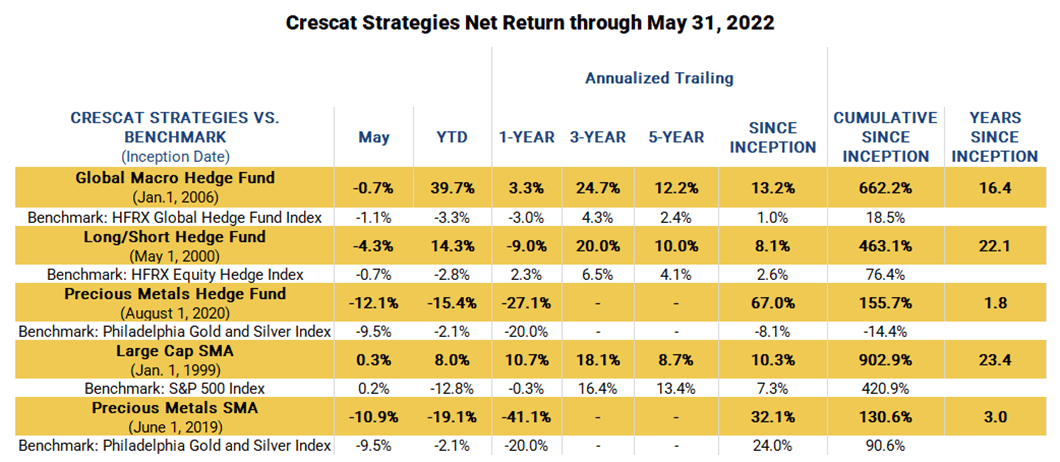
Net Performance Since Inception
Editor’s Note: The summary bullets for this article were chosen by Seeking Alpha editors.
Be the first to comment