

Editor’s note: Seeking Alpha is proud to welcome Jon Seyhun as a new contributor. It’s easy to become a Seeking Alpha contributor and earn money for your best investment ideas. Active contributors also get free access to SA Premium. Click here to find out more »
Chiradech/iStock via Getty Images
Industrial products company Crane Holdings’ (NYSE:CR) stock is currently selling near all-time high prices thanks to financial engineering activities, in our view. But both our fundamental analysis and trades from top insiders suggest these good times are not to last. In our analysis, we find an inflated market valuation from stock repurchases driven by non-recurring asset sales, fresh borrowing and overoptimistic forecasts. We believe the stock is more than 40% overpriced at this time. Recent insider selling also suggests that a stock price top may be in the offing.
Crane Holdings Background
Crane Holdings produces a range of custom designed, highly engineered products used in a variety of applications, such as landing systems, sensing and utility systems, power and microelectronic applications, and microwave systems. Crane sells these products directly to aircraft manufacturers, defense and space prime contractors, defense organizations, and others.
Crane is a mid-cap ($6B) firm in the Industrials sector. The sector as a whole has faced numerous challenges over the recent period due to supply chain disruptions from lockdowns, sanctions due to the Russia-Ukraine conflict, and commodity price volatility.
Crane has outperformed sluggish peers over the past year. For example, the First Trust Industrials/Producer Durables AlphaDEX Fund (FXR) composed of large and mid-cap industrials firms is down 2% over the past year while Crane is up 5% over the same period.
Crane is currently trading close to $108, which is very close to its all-time high price of $114.87. The stock was previously trading in the $80 to $90 range a few years ago but took a large hit from the March 2020 shutdowns, falling from $85 to $40 in a single 30-day span. In recovering to above $100 since then, Crane shareholders have experienced significant volatility as the share price has fluctuated between approximately $110 and $84. The share price plotted below from the beginning of 2021 to today shows this volatility visually.
Crane Holdings, Co. stock price has shown significant volatility in the last few months. (insidersentiment.com)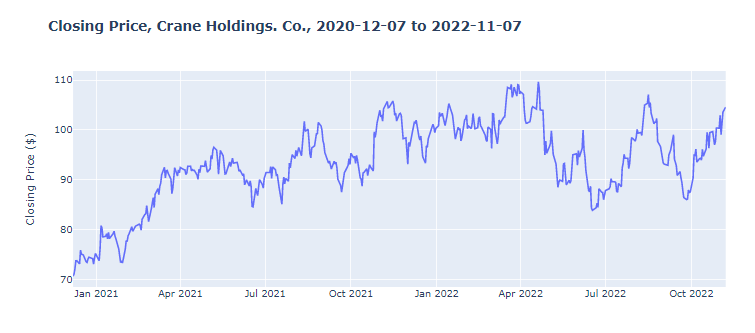
Though Crane has been profitable for the 9 previous quarters and cashflow positive for 8 of the previous 9 quarters, recent filings show some concern that has not been reflected in the stock price. Crane’s stock has risen since posting a $1.06 per share net loss in Q3 2022 earnings, driven by presumably non-recurring asbestos related liabilities. Adjusting for this still resulted in meager losses year-over-year, though this was expected. What has been driving up the stock price, however, is a bit of financial engineering. Crane’s 9-month-ending operating cash flow has declined over $700 million from $327 million in Q3 2021 to negative 378 million Q3 2022, based on the most recent 10-Q filed on September 30, 2022. Cash flows from investing activities have increased by $250 million during the same period, helped by a non-recurring $318 million from a sale of business. The financial engineering comes from the financing activities: Crane took out a fresh $399 million term loan and spent $203 million on share repurchases on the open market. Clearly, this level of share repurchases is not likely to be a recurrent event every quarter. Furthermore, Crane had no share repurchases during the same quarter last year.
We argue below that selling businesses to raise cash, buying $203 million of your own shares using $399 million in bank debt when you experience a $700 million cash flow decline is not a good long-term wealth creation strategy. We argue it is what we call financial engineering, or window dressing.
Crane’s Fundamental Analysis
Let us now take a look at the fundamentals. We proceed in three steps. First, we estimate the fundamental value using our recent, historical base-case assumptions. Second, we reverse engineer Crane’s fundamentals to see what the market expectations are embedded in Crane’s recent stock price of $108. Finally, we ask whether these expectations are realistic and whether they are likely to be maintained, downgraded or improved. Before we begin the fundamental analysis, we will go over the relevant, historical income statement and balance sheet ratios from the most recent 10-K filing.
Starting at the top line, Crane’s sales growth has shown a lot of volatility over the past four years, ranging from a high of 20.1% in 2018 to a low of -15.9% in 2020, for an average of 4.4% over this period. Sales declines cannot entirely be attributed to the lockdowns, as CR had a 2% sales decline in 2019 as well. This volatility makes it harder to forecast, as we discuss shortly. Cost of goods sold and R&D ratios are reasonably stable at 61% and 2.6%, respectively. However, SG&A has also been somewhat volatile, ranging from a high of 26% of sales in 2019 to a low of 19.3% of sales in 2021. The average SG&A/Sales value over the past four years is 21.6%. Relevant historical ratios from CR’s income statement are provided in the table below.
Crane’s historical income statement ratios. (Author’s calculation from CR SEC filings)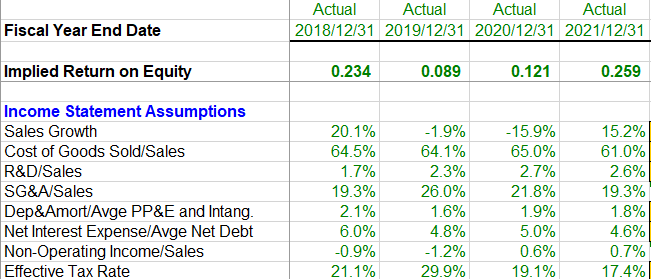
Historical ratios from the balance sheet are also provided in the table below. Receivables are pretty stable at 15%. Inventory turnover is declining slightly. Payables are pretty stable. PP&E is at a four-year low point, currently. All in all, the balance sheet shows a lot of stability.
CR’s historical balance sheet ratios. (Author’s calculation from CR SEC filings)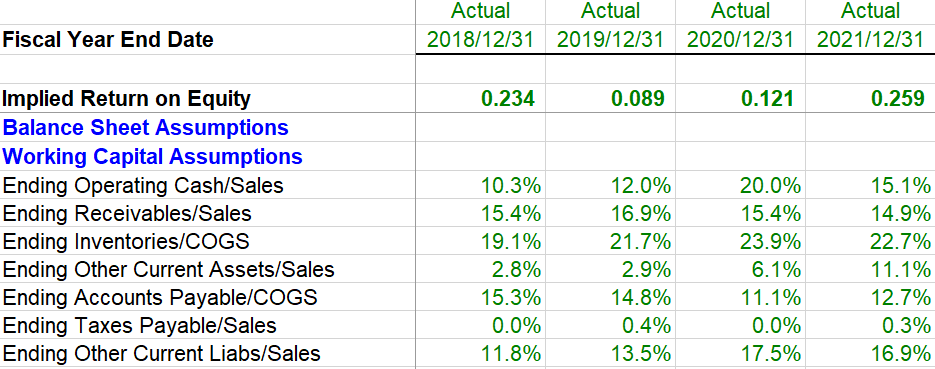
Continued. (Author’s calculations from CR SEC filings)
Fundamental Analysis – Base Case
To start our fundamental analysis, we assume the beta of Crane to be 1.5 (Zach’s estimate), the market risk premium as 7% (historical average), the risk-free rate as 3.7% (current 10-year T-Note rate), the cost of equity at 14.2% and the cost of debt at 5% (average investment-grade-debt yield to maturity). To equalize the direct shareholder approach and indirect enterprise approach estimates of the warranted stock price, the required break-even weighted average cost of capital (WACC) assumption is 11.78%. Computing WACC directly gives us 11.0%, which is close. Using our recent short-term, base case assumptions projecting the most recent, 2022Q3 financials forward, our DCF model below shows a warranted value for Crane of $83.5, which is about 23% below the current stock price of $108. Here, we start with the most recent estimates from 2021 and gradually reduce sales growth rates to a long-run sustainable rate of 3%.
CR fundamental analysis forecasted cash flows – base case. (Author’s calculation)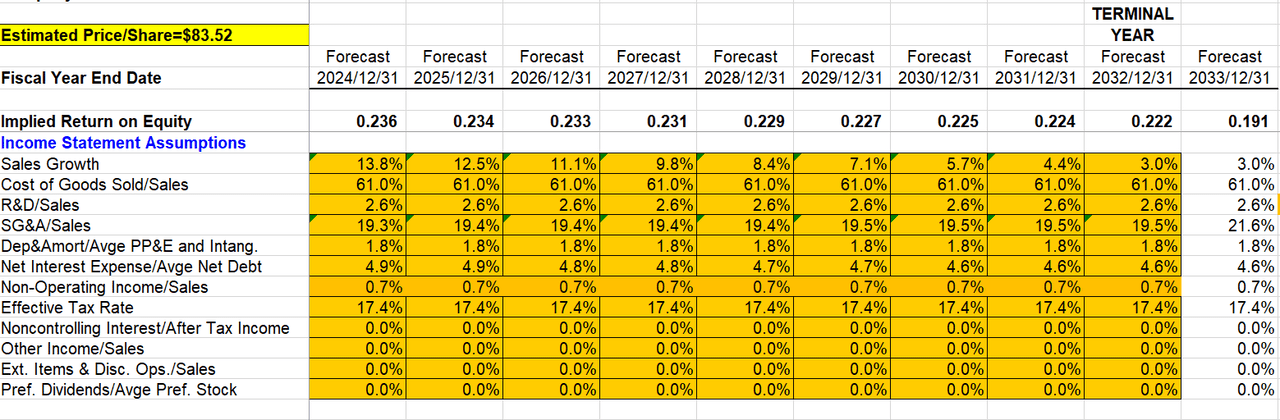
Fundamental Analysis – Reverse Engineering The Market Price
Second, we reverse engineer the assumptions to justify CR’s market value of $108. The required assumptions are 1) the current low levels of SG&A are maintained at 19.3% over the next 10 years and 2) the current high sales growth level of 15% gently declines to about 9% over the next ten years. We find both of these requirements to be highly optimistic. Our model assumptions in this scenario are shown below:
CR fundamental analysis forecasted cash flows – reverse engineering the market price. (Author’s calculation)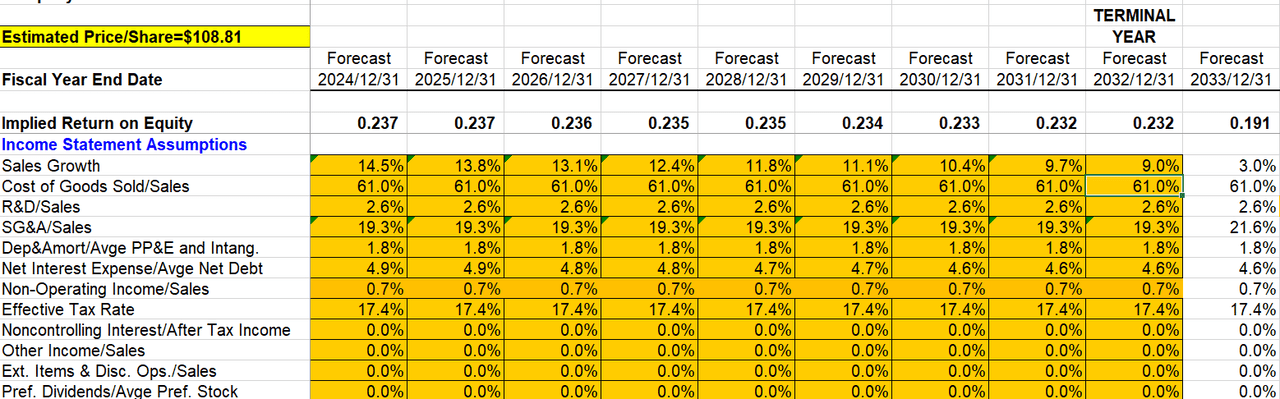
Fundamental Analysis – Our Approach
Finally, we adjust our forecasts to the average of the last four years of financial results. Based on our analysis of the financials, we increase the forecasted SG&A from its current value of 19.3% to 24% after ten years. Given that the average SG&A over the past four years was 21.6%, assuming that SG&A will rise to 24% and average 22% over the next ten years is more realistic than a constant 19.3% over the next ten years. Second, we bring the forecasted sales growth to a constant level of 4.4%, which is the average value for the last four years. Finally, we impose a statutory tax rate of 21%. With these adjustments, our model’s estimated fair value of Crane falls to about $64.79, or 40% below the current level of $108. Hence, our realistic fundamental analysis of Crane suggests that the current price of $108 is approximately $43 or 40% overpriced.
CR fundamental analysis forecasted cash flows – our approach. (Author’s calculation)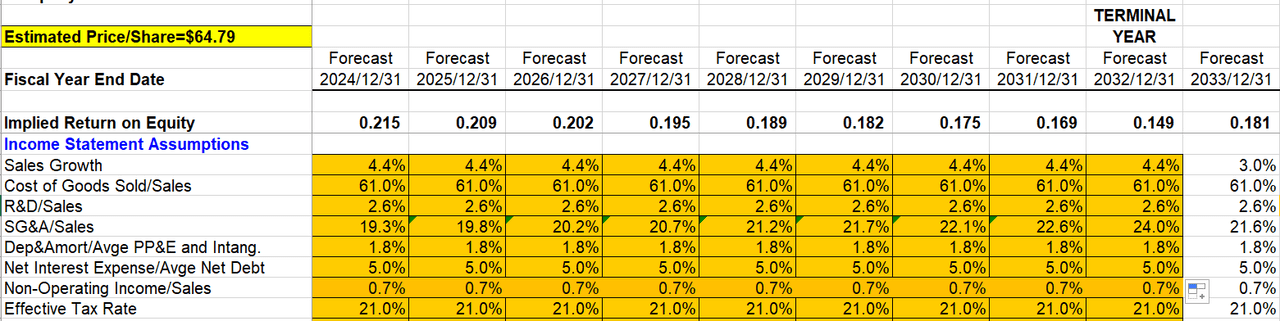
We’ll now see whether insider activity from Crane’s top executives supports the insight that stock may be 40% overpriced from our fundamental analysis. If Crane executives also believe the market is baking in unrealistic expectations to the company’s future SG&A levels and hence the share price, they may similarly feel the stock is overpriced and increase their selling. If they feel that they can maintain these minimal SG&A levels and relatively high sales growth levels over the next ten years, and thus the market is correctly pricing Crane shares, they may not engage in any increased selling at this time, or they could even be buying.
Signals From Insider Trading
When we take a look at Crane’s insider trading activity, the first thing we notice is that Crane executives appear to exhibit a strong timing ability in selling their company’s shares. We have plotted below the trading activity of Crane officers Alejandro Alcala and Kurt Gallo. Mr. Alcala and Mr. Gallo are both Senior Vice Presidents within Crane and have shown such an ability.
Selected transactions for Crane Holdings executives Mr. Alcala and Mr. Gallo, plotted alongside the stock price. (insidersentiment.com)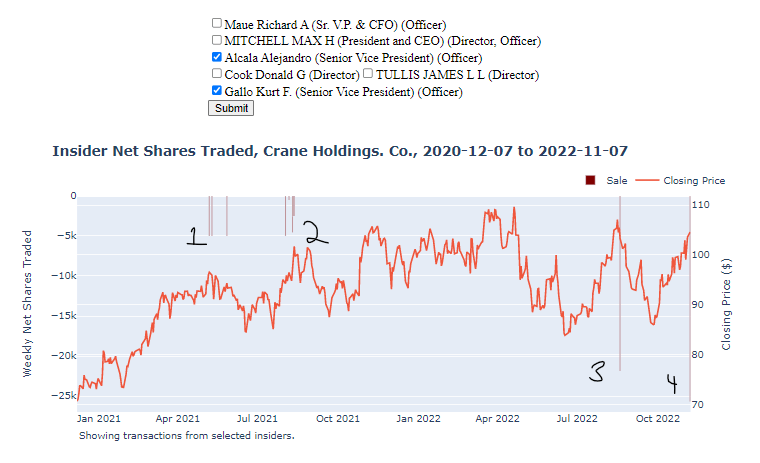
We have numbered the groups of transactions 1 to 4 to help illustrate the analysis. All transactions presented here represent shares purchased via options exercises that are then immediately sold at the market price. Transactions labeled 1 and 2 are from Mr. Gallo and represent stocks that were sold on May 7th, 10th, and 27th of 2021, then again on August 2nd, 6th, 10 and 11, and 12th. In total, Mr. Gallo sold 30,000 shares for a value of nearly $3 million. Transactions labeled 3 and 4 belong to Mr. Alcala. Transaction 3 represents nearly 21,863 shares that were sold on August 19th, worth over $2.2 million. Transaction 4 occurred earlier this month and represents 25,649 shares, worth over $2.6 million.
As we mentioned earlier, both insiders showed impressive market timing in making their trades, as Crane’s stock price experienced dips immediately following the transactions. We’ve copied the above chart and added arrows showing these dips, below.
Transactions from Mr. Alacala and Mr. Gallo have been closely followed by dips in the stock price. (insidersentiment.com)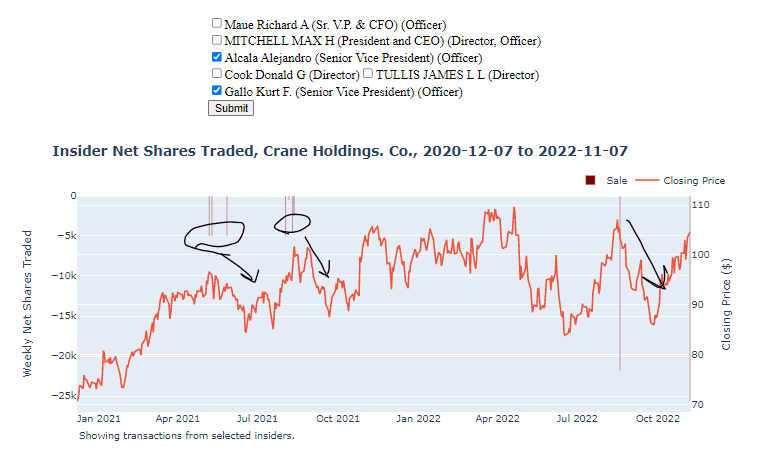
Of course, we don’t know yet whether Mr. Alcala’s most recent sale will show the same pattern.
Now, let us take a look at trades made from one more Crane insider, President and CEO Max Mitchell. Mr. Mitchell has made few transactions within the last two years. Looking at his larger transactions, he made several sales of shares purchased via options exercises in May 2021 alongside Mr. Gallo, selling 73,835 shares on May 7th, 106,018 shares on May 13th, and 154,411 shares on May 25th. These sales were worth over $32 million in total. Like Mr. Gallo, Mr. Mitchell was able to sell these shares in May before the June dip in the stock price.
While noteworthy, we believe the most informative transaction occurred recently, when Mr. Mitchell exercised options to acquire and then immediately sold 117,103 shares on November 7th, representing over $12 million in total. Notably, these trades occurred the same day as Mr. Alcala’s most recent large trade. As a comparison, before acquiring the shares to sell, Mr. Mitchell was in possession of just under 350,000 shares. Meaning, his sale of 117,103 shares on the day represented approximately one third of all shares in his possession before the sale. That is a very large number of shares to sell at one time, relative to all holdings.
Does The Insider Activity Align With The Fundamental Analysis?
Our fundamental analysis suggests the stock is 40% overpriced, and insider transactions support our belief. Not only do Crane top insiders historically trade with prescience, timing their sales right before large dips in the stock price, but top executives Mr. Alcala and Mr. Mitchell have both made large sales very recently. Both executives sell relatively infrequently, another fact that gives weight to their recent large sales.
Counter-Arguments
Skeptics can point out that no analyst currently has a sell recommendation on CR (one hold, three buys). Furthermore, CR has strong operating margins (39% gross margin), high return on equity (25.9% on 12/2021), reasonable debt levels (debt to equity ratio of 46% on 12/2021), and lots of liquidity (current ratio of 2.2 on 12/2021). CR has grown dividends 7.1% over the last three years. They would be right on all of these counts, of course. We are not disputing any of this. We agree. Instead, we are simply pointing out the CR’s performance has peaked in 2021 and it is this exceptional performance that is being projected into the next ten years. This is where investors need to be careful not to project current exceptional strength into the indefinite future.
Conclusion
We are decidedly bearish on CR. The fact that recent exceptional performance combined with one-time financial engineering activities (share repurchases funded by bank debt) may be pumping up the current stock price, our more realistic fundamental analysis supports our recommendation to sell or even short Crane, and insider trading signals from top executives additionally suggests further upside is doubtful.
Be the first to comment