

Editor’s note: Seeking Alpha is proud to welcome Jake Speers as a new contributor. It’s easy to become a Seeking Alpha contributor and earn money for your best investment ideas. Active contributors also get free access to SA Premium. Click here to find out more »

pcess609
Facebook was once known as the greatest social media site on the web and is still considered the largest in terms of users. Recent bad press, along with increased competition (TikTok, Twitter, Snapchat (SNAP), etc.), and slowing user growth has shifted Mark Zuckerberg to focus on the Metaverse, even changing the name from Facebook to Meta Platforms (NASDAQ:META).
That transition has not been the smoothest, with the share price dropping over 75% from the high of $378 in September of 2021 to the recent low of $89 in November 2022. Investments in the metaverse have not yet paid off, and the losses are really adding up. The question is, has this drop provided an opportunity for the long term? I believe so. Despite all of the struggles, Meta still has solid fundamentals. Read below for why I am bullish on META stock!
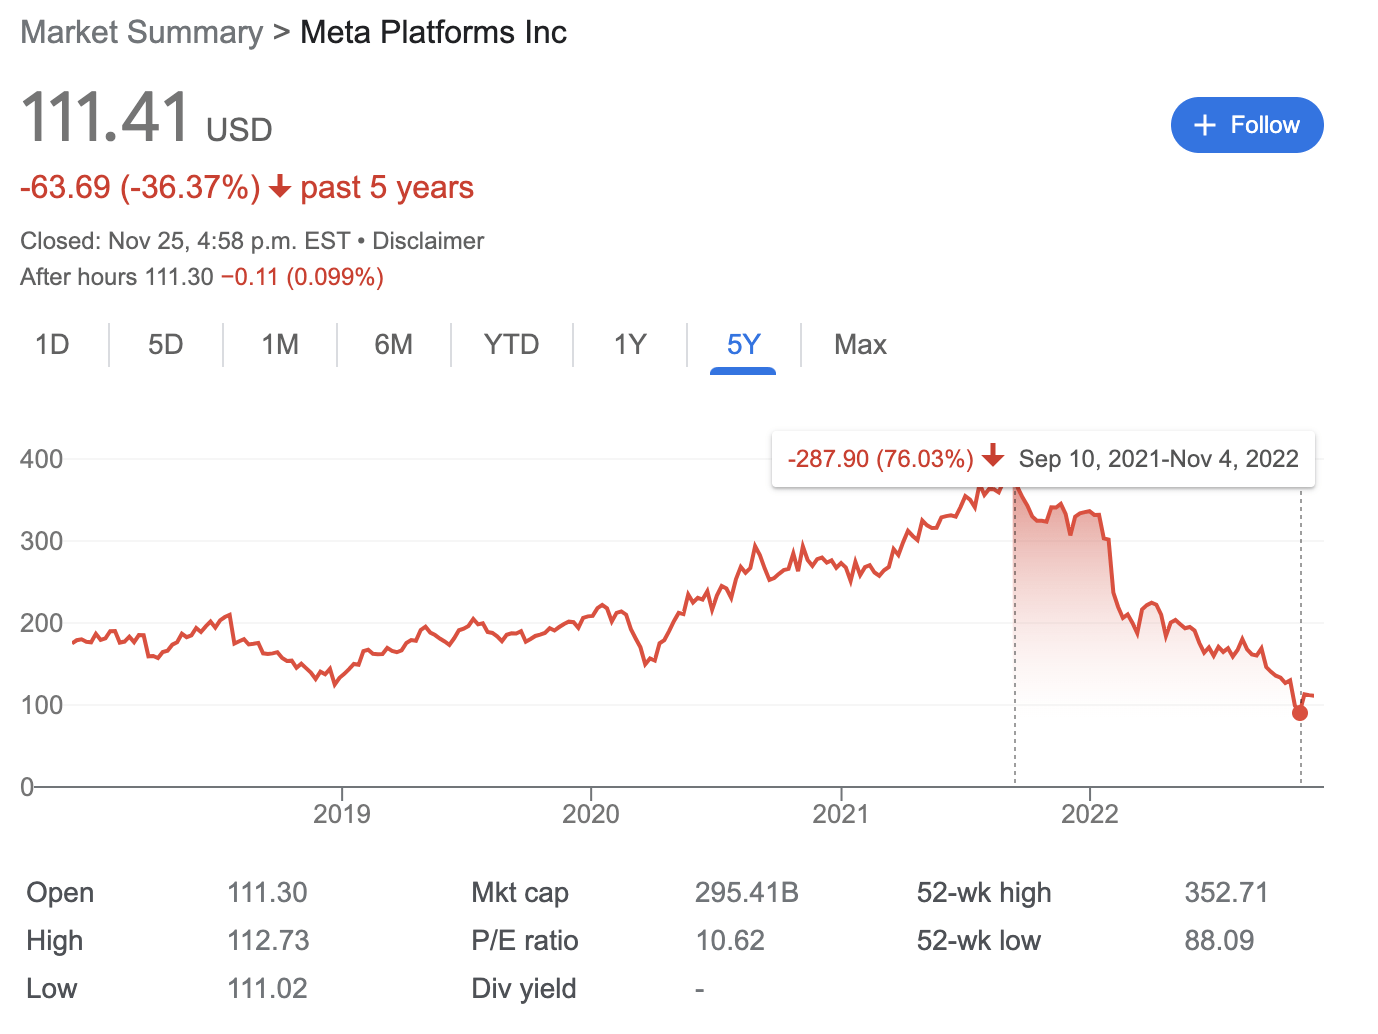
Meta has dropped over 75% from all time highs to recent lows. (Google)
In this post we’re going to look at a brief history of Facebook/Meta, before doing a deep dive into the metaverse, its users, competition, financials, and finally finishing with a discounted cash flow calculation, to see if the intrinsic value we come up with shows Meta as undervalued or overvalued.
History Of Facebook/Meta
Facebook was founded in 2004 by Mark Zuckerberg and some of his Harvard classmates. It was originally only available for Harvard students but expanded quickly to include other universities, followed by everyone over the age of 13. The following list shows a brief timeline of some of Meta’s most important moments:
- April of 2012: Acquired Instagram for ~$1 billion
- May 17, 2012: Facebook’s IPO, valuing the company at $104 billion
- October of 2012: Facebook hits 1 billion active users
- February of 2014: Acquired WhatsApp for $19 billion
- March of 2014: Acquired Oculus VR for $2.3 billion
- 2016: Oculus releases first VR headset
- March 2018: Cambridge Analytica scandal, data from 50 million users used without authorization
- November of 2019: Acquisition of Beat Games (VR developer)
- October of 2021: Facebook fined 50.5 million Euros for breaching order in Giphy acquisition; in October 2022, Meta was ordered to sell Giphy
- October of 2021: Facebook rebrands to Meta Platforms
- September of 2022: Acquisition of Lofelt (Advanced haptic technologies for VR)
Number Of Users
The number of users Facebook has is very important, as the more users, the more ads the company can show. Facebook has greatly increased the number of users throughout its history, but recently that growth has slowed significantly. On December 31, 2012, the company achieved 1.06 billion MAU (monthly active users). The chart below shows how the number of users on Facebook have changed over the years.
|
Daily Active Users |
Growth |
Monthly Active Users |
Growth |
|
|
2012 |
618 Million |
25% |
1.06 Billion |
28% |
|
2013 |
757 Million |
22% |
1.23 Billion |
16% |
|
2014 |
890 Million |
18% |
1.39 Billion |
13% |
|
2015 |
1.04 Billion |
17% |
1.59 Billion |
14% |
|
2016 |
1.23 Billion |
18% |
1.86 Billion |
17% |
|
2017 |
1.4 Billion |
14% |
2.13 Billion |
14% |
|
2018 |
1.52 Billion |
9% |
2.32 Billion |
9% |
|
2019 |
1.66 Billion |
9% |
2.5 Billion |
8% |
|
2020 |
1.84 Billion |
11% |
2.8 Billion |
12% |
|
2021 |
1.93 Billion |
5% |
2.91 Billion |
4% |
|
2022 |
1.98 Billion |
2.6% |
2.96 Billion |
1.72% |
In 2018, the company also began keeping track of DAP (daily active people), MAP (monthly active people), and ARPP (average revenue per person). These metrics track users over the “Family of Apps” including Facebook, Instagram, WhatsApp, and Messenger. The table below shows how the number of users/amounts of revenue have changed since 2018.
|
Daily Active People |
Monthly Active People |
Average Revenue Per Person |
|
|
2018 |
2.03 billion |
2.64 billion |
$21.67 |
|
2019 |
2.26 billion (+11%) |
2.89 billion (+9%) |
$25.57 (+14%) |
|
2020 |
2.6 billion (+15%) |
3.3 billion (+14%) |
$27.51 (+8%) |
|
2021 |
2.82 billion (+8%) |
3.59 billion (+9%) |
$33.68 (+22%) |
|
Q3 2022 |
2.93 billion |
3.71 billion |
– |
Competition
Ad revenue generated by social media websites brings lots of competition. Currently META’s top competitors are TikTok (ByteDance), Snapchat, Alphabet (GOOG, GOOGL), WeChat (Tencent), and Twitter. In the latest annual report Mark Zuckerberg even went as far as listing off all the competition the company faces, and how it is negatively affecting its growth.
In October of 2022 Facebook was ranked #3 for most visited website, according to SemRush. During the last 10 years or so, Facebook has normally hopped between rank 2 and 3. Google and YouTube rank #1 and #2 currently. Twitter was #4 in October, with other notable social media websites Reddit, Instagram, and TikTok being 6, 8, and 16 respectively.
In the Reality Labs segment, Meta will continue to see increased competition. There are currently rumors Apple (AAPL) is planning on releasing a VR/AR headset soon, and this is set to compete with Meta’s Meta Quest headset.
Metaverse
Mark Zuckerberg has made it his mission (much to the dismay of many of his shareholders) to make VR/AR/Metaverse the future of the company. The response thus far to the Metaverse isn’t the best, with many people commenting on how bad the quality was. I personally think the AR/VR aspect is very interesting, but I can’t think of many wide-use cases beyond gaming, fitness, and office use for meetings. I think the technology has a way to go before being perfected, and I wonder if Meta is too early to the space. I can’t help but think back to when I bought my current Samsung 3D TV 12 years ago. At the time I thought it was a brilliant idea, bringing the IMAX experience into the home, and that soon every TV would be 3D. Fast forward to today, I think I’ve watched two 3D movies on the TV, and when looking at TV’s this past boxing day I don’t think I saw a single 3D TV!
Meta has invested billions of dollars into the Reality Labs division. In 2019, Reality Labs accounted for just 0.7% of total revenue; in 2020, it accounted for 1.32%, in 2021, this climbed to 1.93%, and in 2022 so far it has accounted for 1.68%. So, although it has been growing with the exception of the last three quarters, it still accounts for a very small portion of total revenue. During that time, Reality Labs has posted losses of $4.5 billion in 2019, $6.6 billion in 2020, $10.2 billion in 2021, and $9.4 billion so far in 2022. That’s a total of $30.7 billion in losses since 2019! During that same period, the Family of Apps division posted income of $156.7 billion. This is what has allowed Meta to invest so aggressively while maintaining buybacks and a healthy balance sheet. Now that a recession is widely expected, Mark Zuckerberg has slightly backed off on his commitments to continue the heavy spend going forward. Meta has announced it is laying off 13% of employees and will cut spending to allow for continued growth in operating income. Whether it sticks to that or not, time will tell. This was a welcome announcement in my eyes, as I was starting to believe nothing would be able to slow Zuckerberg on the Metaverse train.
Financials
While doing a valuation, I like to look at the last 5-10 years of financials for the company, to see the current trends and how growth rates are changing.
Revenue & Cost Of Revenue
Meta had revenue of $118 billion in fiscal year ending December 31, 2021 (it had $118 billion TTM as of Sept 2022). In 2011, the company had revenue of $3.7 billion. This represents a CAGR (compound annual growth rate) of 8.6%. Comparing that to the 5-year CAGR of 33.72%, and 3-year CAGR of 28% you can see growth has been huge over the last few years, especially during COVID when businesses were forced to pivot online (and thus spend more advertising dollars online). That is likely to drop off significantly over the next few years, as can already be seen in the TTM where revenue has been flat. With a likely recession on the horizon, companies will cut back spending on advertising.
Cost of revenue as a percent of revenue has climbed over the last 5 years, from 13.42% in 2017 to 19.67% in 2021. This is partly due to a higher cost of products sold for Reality Labs products, as well as increases in operational expenses for the data centers and technical infrastructure.
Operating Margin
Meta’s operating margin is currently around 30% in the trailing twelve months, compared to 40% in FY 2021, and 50% in FY 2017. This is largely due to the investments in its Reality Labs segment, which covers its VR/AR products. A large proponent of this investment has been increasing headcount, which has jumped from 25,105 employees as of December 31, 2017, to 87,000 employees as of November 2021, although the company just announced it will be laying off roughly 13% of the workforce (~11,000 employees).
Net Income
Net income for the TTM was $28.8 billion, down nearly 27% from FY ending December 2021 which had net income of $39.37 billion. During this time the biggest difference was an additional $8 billion in R&D expenses. In FY 2020 net income was $29.146 billion, while FY 2019 had net income of $18.5 billion. The 5-year CAGR (excluding TTM) for net income has been 31%, while if you include TTM it drops to 19.8%.
Cash Flow
Cashflow is one of the most important indicators for value investors. Warren Buffett once described intrinsic value as ‘the present value of all cash that will be distributed from now until judgement day’. Meta has achieved great growth in terms of cash flow from operations increasing from $24.2 billion in FY 2017 to $57.7 billion in FY 2021 ($54 billion in TTM).
Of course, Meta have also been investing a lot more money in buildings, infrastructure, employees and the Reality Labs portion of the business, which is why capital expenditure (and thus cash flow from investing activities) has been negative for so long. Cash flow from investing activities also includes investments in marketable and equity securities, which can show large unrealized losses/gains.
Balance Sheet
Looking at the balance sheet, we can see Meta is in a very healthy financial position. As of September 30, 2022, the company has $58 billion in current assets, which includes $14.3 billion in cash/cash equivalents, $27.5 billion in marketable securities, and $11 billion in accounts receivables.
Meta has $22.7 billion in current liabilities, which gives it a current ratio of 2.52. This shows that Meta should have no problem continuing operations and paying for its share repurchase program.
Meta had no debt until recently, but in August of 2022 issued $10 billion of fixed-rate senior unsecured notes to fund capital expenditures, stock buybacks, and possibly acquisitions/investments. The interest rate ranges from 3.63%-4.71%, and comes due in 2027, 2032, 2052, and 2062.
PE Ratio
I would advise against using the price to earnings ratio itself to value a business, but it can be helpful to look at over a specific period and compare it to the average, as long as you understand what is driving the underlying PE ratio. Our PE Ratio tool allows you to select a specific time frame to compare current PE ratio to. In the case of Meta, the current PE ratio of 10.6 is well below the 1-year, 5-year, and 10-year historical averages of 15.5, 25.8, and 55.7 respectively.
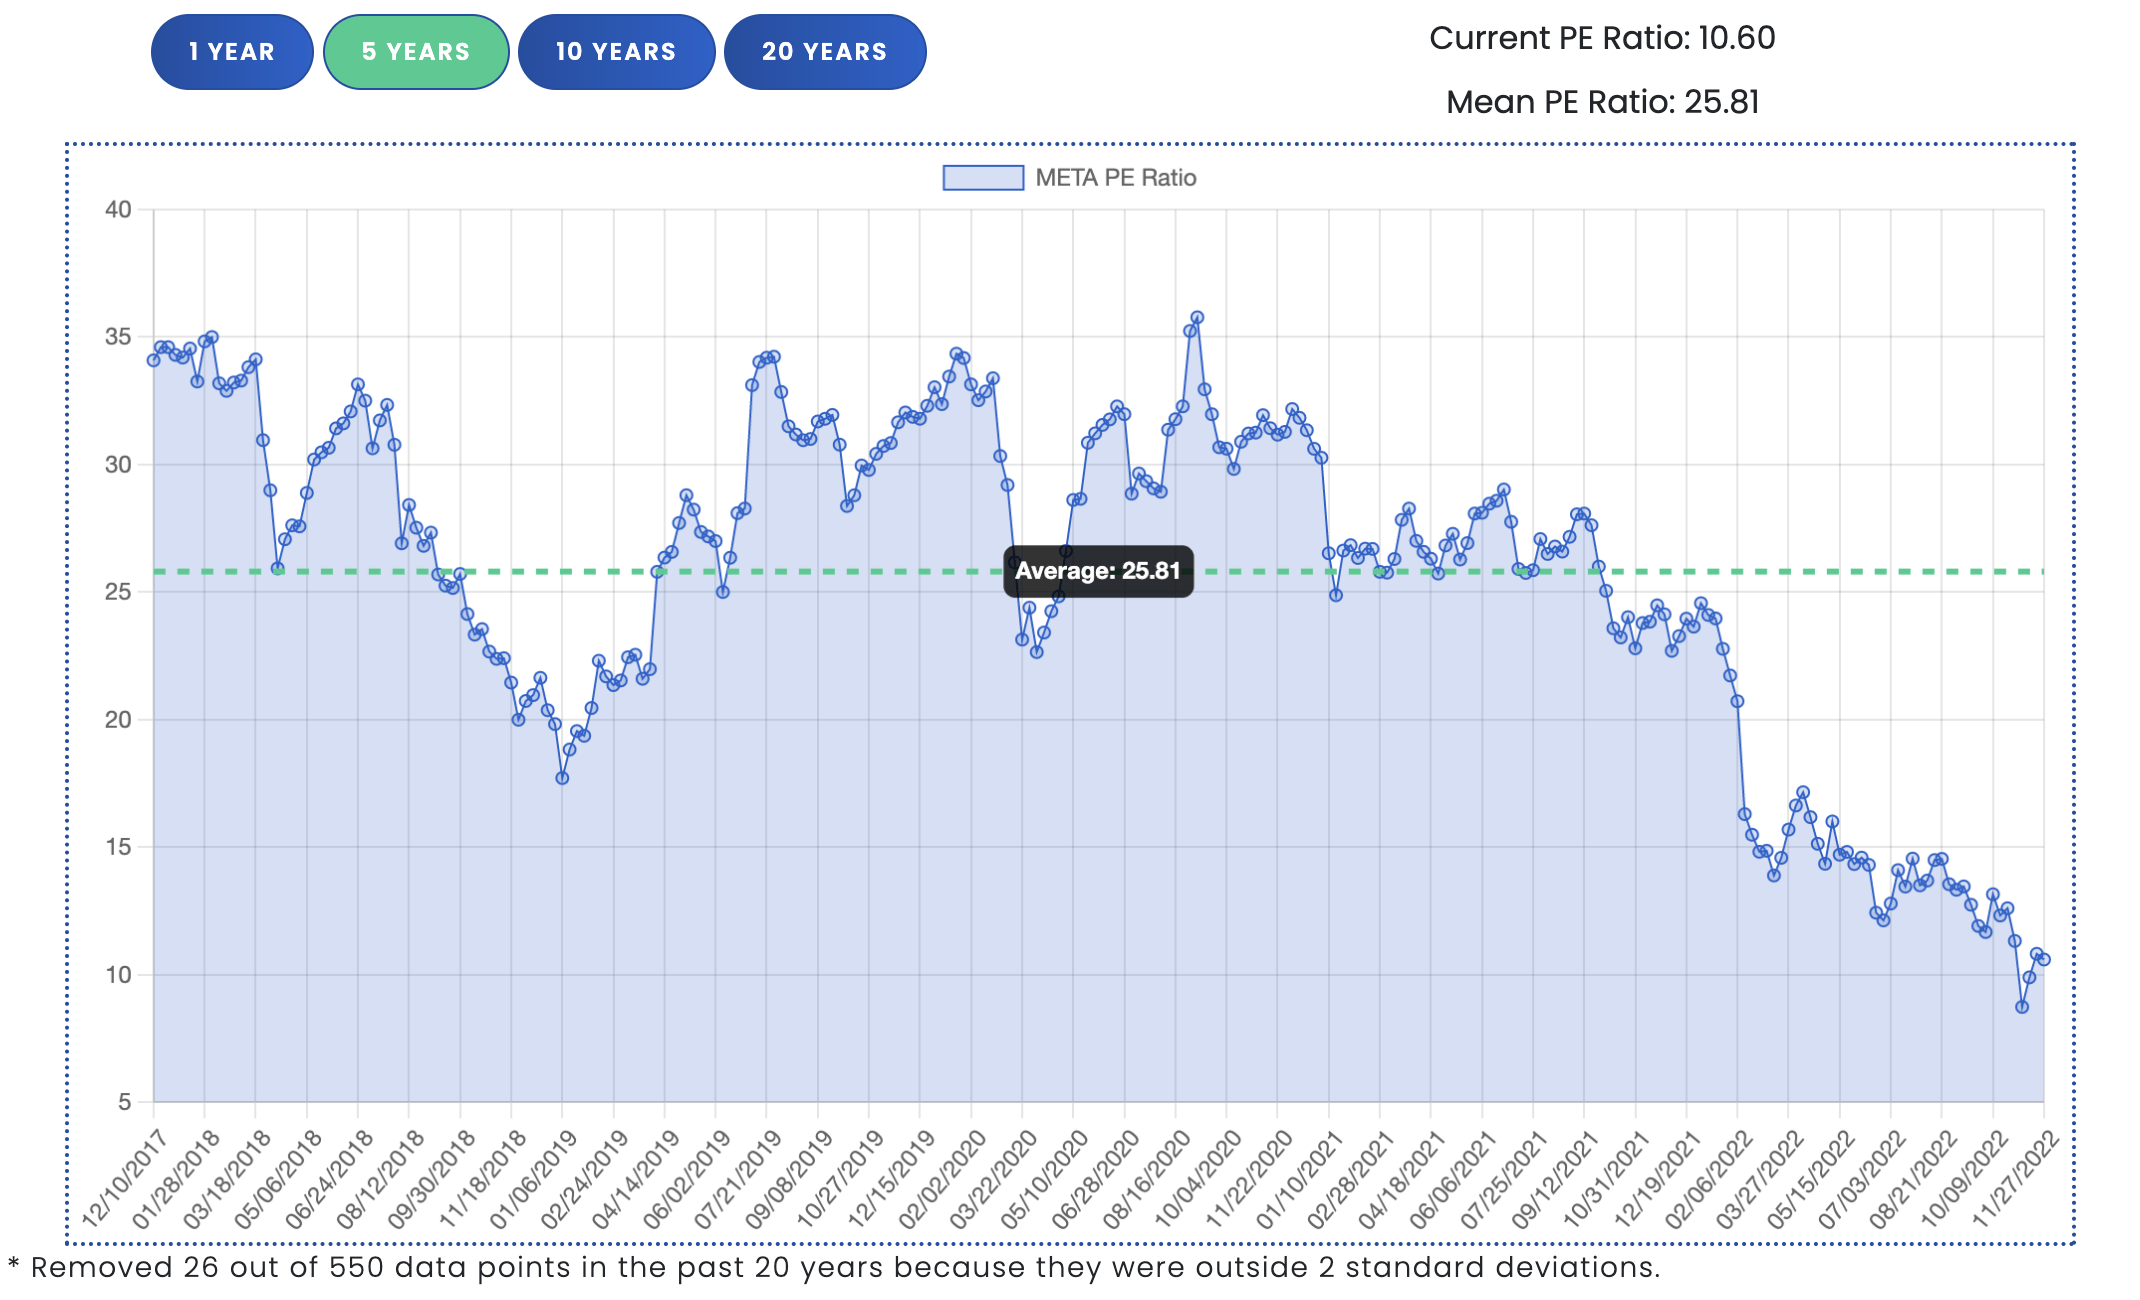
Meta’s current PE ratio of 10.6 is significantly lower than it’s 5 year average of 25.8. (Author)
Ownership
There have been more insiders selling shares than buying recently. This is generally not a great sign for the company, although founder led companies tend to do better than non-founder led companies. In August of 2022, long-time chief operating officer (COO) Sheryl Sandberg stepped down from her role, being replaced by chief growth officer Javier Olivan.
Insider ownership of Meta is low, excluding founder Mark Zuckerberg who owns ~13.6% of Meta. Although Zuckerberg only owns ~13.6% of Meta, because of the share structure he still has ~58% of the voting rights. He gets 10 votes per his class B share, while class A shares only get 1.
Share Buybacks
Meta started a share repurchase program in 2017. Since then the company has continually expanded it, with no expiry. The table below shows the shares repurchased per year since 2017.
|
Shares Repurchased |
Total Cost |
Cost/Share |
|
|
2017 |
~13,000,000 |
$1,976,000,000 |
~$152 |
|
2018 |
~79,000,000 |
$12,930,000,000 |
~$163 |
|
2019 |
~22,000,000 |
$4,100,000,000 |
~$186 |
|
2020 |
~27,000,000 |
$6,300,000,000 |
~$233 |
|
2021 |
~136,000,000 |
$44,810,000,000 |
~$329 |
|
3 Quarters 2022 |
~101,000,000 |
$21,020,000,000 |
~$208 |
As of September 30, 2022, there was $17.78 billion still available and authorized share buybacks.
Intrinsic Value – Discounted Cash Flow (DCF) valuation
Finally, after looking at all the important details of the business, we’re ready to calculate our intrinsic value. To come up with an intrinsic value, we will be using our DCF calculator, which allows for finer tuning and is easier to see how certain changes affect valuation.
I’m going to do two valuations: one is my base case, where I will input what I think is more likely to happen over the next 5-10 years. The second is my slightly less optimistic case, where I believe Meta will continue to overspend on the Reality Labs segment, without seeing much of a return on it.
Base Case
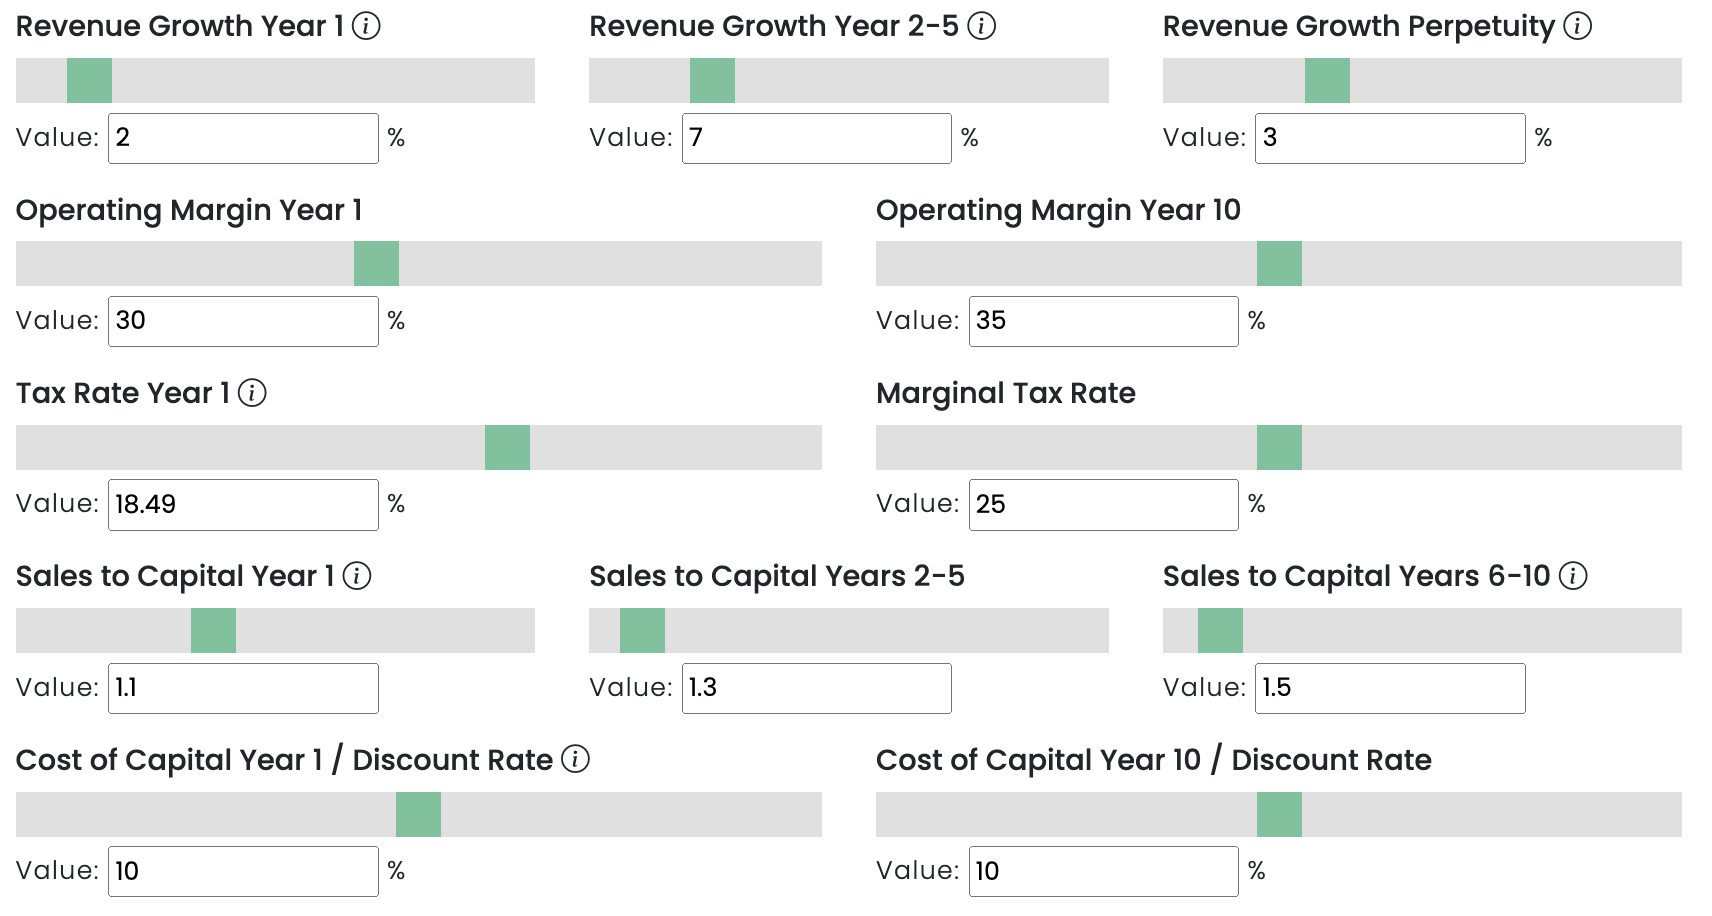
The many variables I’m using in my DCF to calculate intrinsic value (Author)
Revenue Growth in Year 1: 2%
Analysts are predicting ~5% revenue growth next year. I am a bit less optimistic. With a likely recession on the horizon, we are already seeing companies cut advertising budgets. I also don’t know the full effect that Apple’s iOS changes will have on Meta’s advertising revenue yet.
Revenue Growth for Years 2-5: 7%
Seeking Alpha analysts are projecting revenue growth of 11.75% in 2024, 10.51% in 2025, 9.17% in 2026, and 6.78% in 2027, which would give Meta revenue of $176.5 billion in 2027. My estimate of 7% growth for years 2-5 is not as optimistic, giving them revenue of $157.9 billion in 2027. Despite the slowing growth in Facebook users, I believe the company will be able to achieve this growth due to its potential ability to monetize Instagram and WhatsApp.
Revenue Growth in Perpetuity: 3%
The 10-year treasury yield is often used for growth in perpetuity, to prevent ‘impossible’ growth scenarios. The current yield is 3.7%. We are going to use 3%.
Operating Margin in Year 1: 30%
Although Meta reached an operating margin of 40% in 2021, which was the highest level since 2018 (when it had 44.62%), it has since dropped down to 30% in the TTM due to the large investments it has made. I’m going to use 30% for year 1, as I’m not sure the company will be able to increase it in 2023 if there is a recession, even if it does cut spending.
Operating Margin in Year 10: 35%
This is the big question, and the variable that will affect the valuation the most. I personally believe META will be able to get to 35% as a long-term operating margin, and I feel that’s fairly conservative. The company’s main revenue driver (ads business) does not take a lot of ongoing investment and has higher margins. The Reality Labs segment is likely to see high spend over the next few years, at which point I’m hoping the company will either start to see a return which would improve margins, don’t have to spend as much to maintain it, or it fails and they kill it.
Tax Rates
We are going to leave the tax rates as the default, which will slowly bring the effective tax rate up to the marginal tax rate over 10 years.
Sales to Capital
I will set these at 1.1 in year one, 1.3 for years 2-5, and 1.5 for years 6-10. Sales to capital is an efficiency ratio, showing how much reinvestment is needed for each dollar of revenue.
Discount Rate in Year 1: 10%
Although often times cost of capital is used as a discount rate, in this case I am using 10%.
Discount Rate in Year 10: 10%
When using cost of capital as a discount rate I will sometimes use a different number in year 10 to normalize it. In this case I am keeping it at 10%
Intrinsic Value Per Share: $189.33 (reflects 70% potential upside from current price of $111 – as of writing)
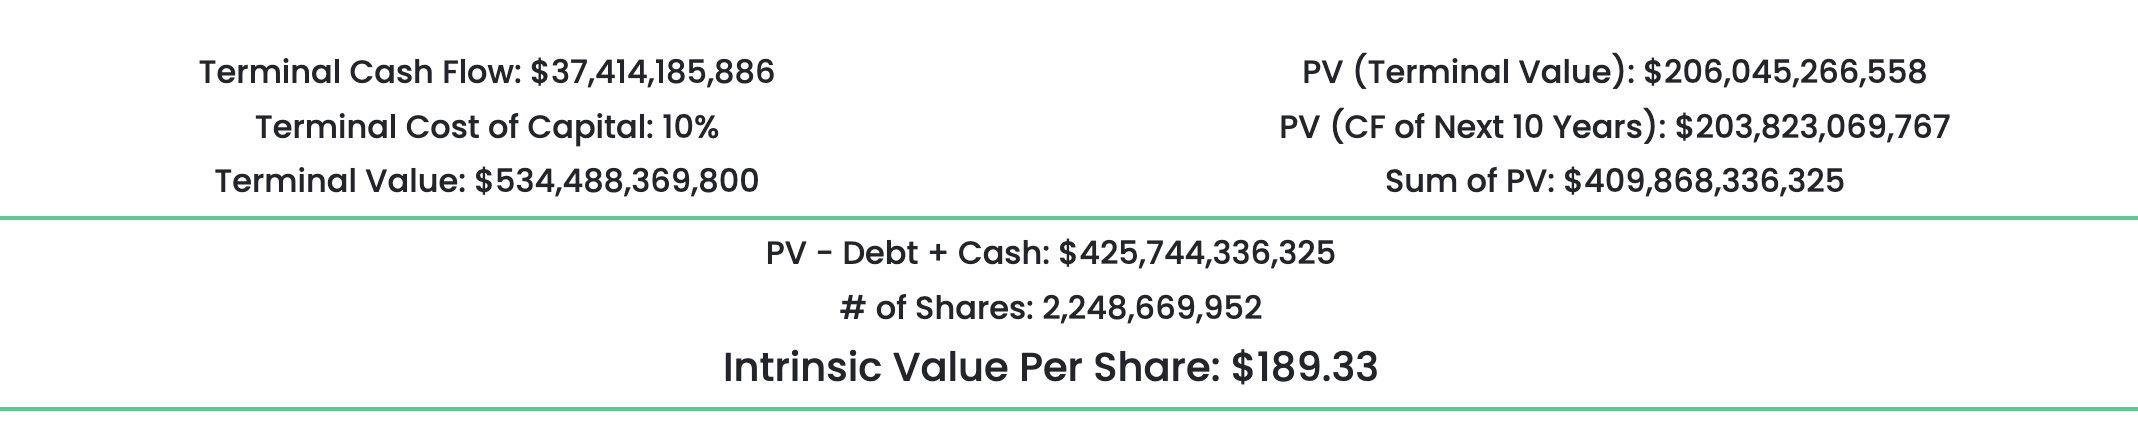
Case 1 intrinsic value for Meta (Author)
Less Optimistic Case
For the less optimistic case I will be keeping everything the same, except I will be dropping operating margin to 25% in year 10, and sales to capital will stay at 1.1 throughout the 10 years. This will reflect the risk that Meta continues to spend large amounts on Reality Labs, without seeing a return, and is unable to keep margins up while monetizing Instagram and WhatsApp.
Intrinsic Value Per Share: $144.35 (reflects 30% potential upside from current price of $111 – as of writing)
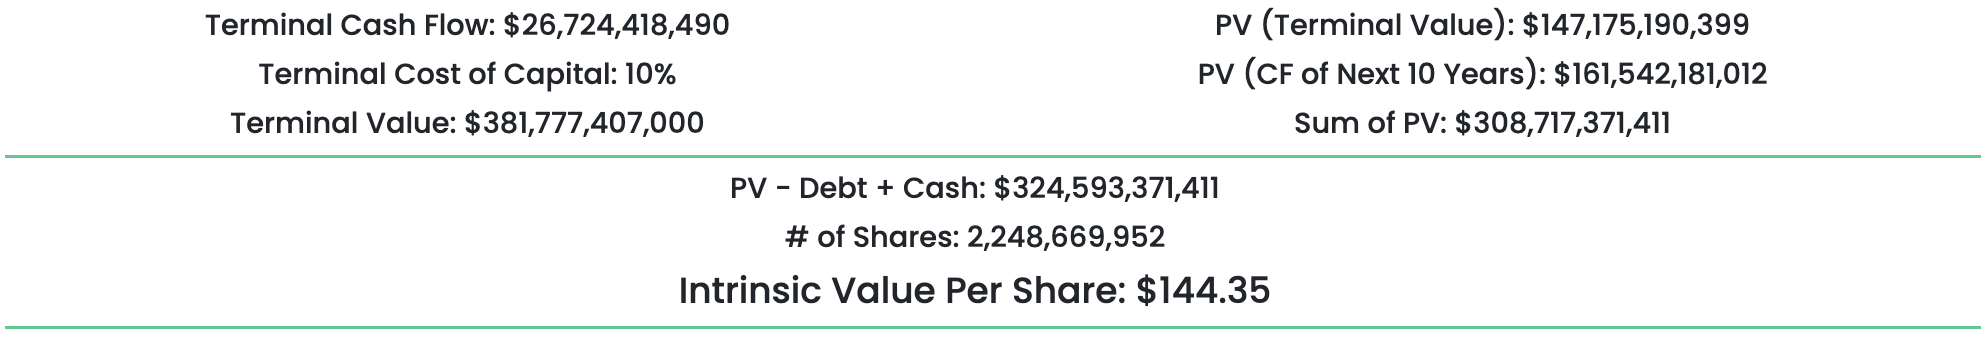
Intrinsic value for Meta in my less optimistic case (Author)
Conclusion
To be fully transparent, I have recently started a small position in Meta. The company is facing many potential issues, such as Apple iOS changes, Metaverse failing (or worse, Meta continuing to spend billions of dollars on Metaverse and not acknowledging it failed), slowing user growth (and possibly no user growth going forward), and increased competition from apps like TikTok.
That being said, Meta currently has 2.93 billion daily active people across its family of apps. That’s 36% of the world’s population! When looking at monthly active people, it jumps to 3.71 billion people. That’s nearly half the world’s population. Even if the company continues to lose market share to TikTok, there is a huge part of the population that most likely won’t be leaving sites like Facebook or Instagram any time soon. Perhaps I am biased towards Facebook, as it is the social media site I use the most. I have tons of pictures/memories on there; the first time I met my wife, our wedding pictures, honeymoon pictures, and recently our first born child, and all the changes we’ve seen in her over the past 10 months. I can’t see myself ever leaving Facebook, and that is something to keep in mind when reading my analysis.
For my personal investment, I concluded that the fear of the metaverse failing and user growth slowing was overblown, and this has provided a great opportunity. I don’t need everything to go right for this investment to work out, Mr. Market has provided a margin of safety that I am personally comfortable with. I’m rating Meta as a Buy, and if I get any sign that the Metaverse investments are starting to pay off, it would be a Strong Buy.
Like Warren Buffett once said: “Be fearful when others are greedy, and greedy when others are fearful”.
Be the first to comment