

Sergey Nazarov/iStock via Getty Images
Investment Thesis
Costco Wholesale Corporation (NASDAQ:COST) is even more expensive now, after rallying by 24.56% from $424.80 to $529.12, since our previous Hold rating in May 2022. Pity for those who had missed the highly attractive dip, since the stock has been on a massive roll in the past decade, with an impressive 5Y total price return of 260.7% and 10Y return of 592.3%. In hindsight, we suppose that COST is one stock that will always be perceived as expensive, though with a massive potential for price appreciation over the next decade.
COST’s recent results in August 2022 also proved exemplary, with 8.7% of YoY comparable sales growth, excluding impacts from gasoline prices and foreign exchange. Nonetheless, it remains to be seen if the company is able to continue its lucky streak ahead, since it historically reported a -1.5% YoY decline in revenues, -16.6% in net incomes, and -51.1% in Free Cash Flow (FCF) generation in the previous recession in FY2009. In the meantime, the COST stock had also plunged by -40.4% between September 2008 and March 2009.
Therefore, we prefer to wait it out since we missed the previous stellar opportunity of $300s in March 2021 and $400s in May 2022. Assuming that the Feds continue to hike rates through 2023, we may potentially see an adverse effect on its stock performance. Though, we are more optimistic, given the massive value and savings COST offered to its members, especially in an economic downturn ahead.
COST Remains Highly Relevant In An Economic Downturn
S&P Capital IQ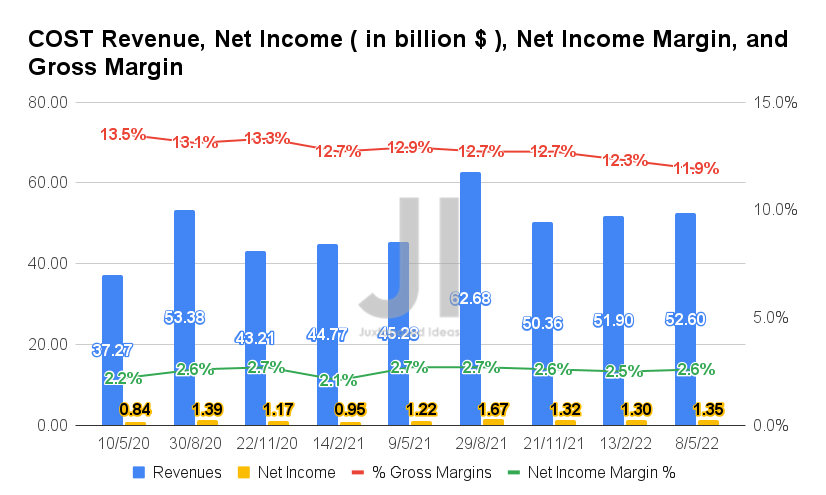
In the last twelve months (LTM), COST reported exemplary revenues of $217.5B and average gross margins of 12.4%, representing an increase of 11%, though a decrease of 0.5 percentage points YoY, respectively. In contrast, the company reported improved profitability, with net incomes of $5.64B and net income margins of 2.6%, representing an increase of 12.8% and in line YoY, respectively.
S&P Capital IQ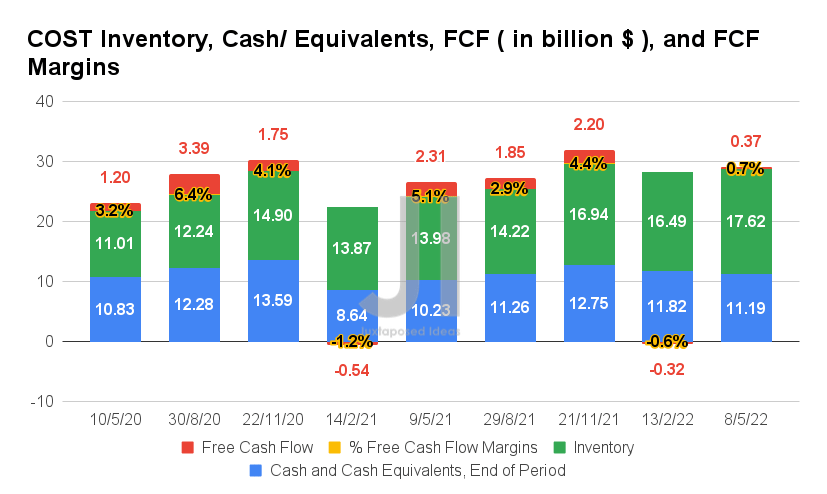
In the meantime, COST reported elevated inventory levels of $17.62B in FQ3’22, representing a massive increase of 6.8% QoQ and 26% YoY. Combined with the aggressive YoY capital expenditure increase of 3.9%, of $3.58B in FY2021 to $3.72B in the LTM, it is no wonder that the company reported a lower FCF generation of $4.1B and an FCF of 1.9% in the LTM, compared to $5.37B and 2.7% in FY2021.
Nonetheless, we believe these represent temporary headwinds, since COST still boasts robust cash and equivalents of $11.19B on its balance sheet in the last quarter.
S&P Capital IQ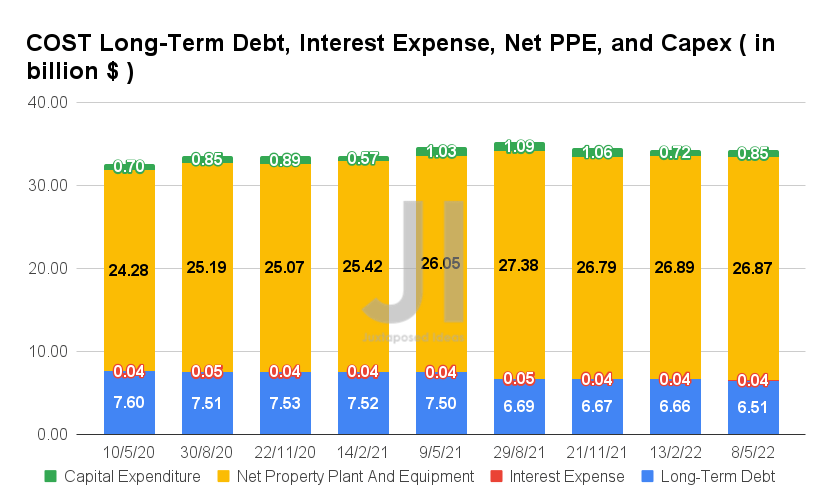
COST also reported excellent deleveraging from $7.5B in FQ3’21 to $6.51B by FQ3’22, representing a notable decrease of -13.2% YoY. This is despite the company’s continued investment in store growth to 834 stores as of July 2022, with net PPE assets of $26.87B and capital expenditure of $0.85B in FQ3’22. The former represents a massive YoY increase of 3.1% in asset value from 813 stores, 10.6% from FQ3’20 levels of 790 stores, and 31.2% from FQ3’19 levels of 778 stores, given the massive consumer demand thus far.
COST Long-Term Debt Maturity
S&P Capital IQ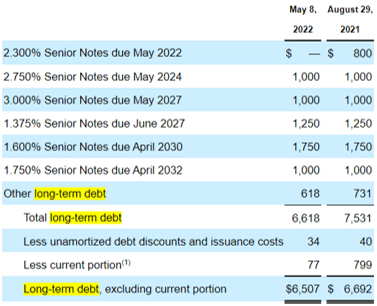
However, COST investors have nothing to fear about its long-term debts, since only $1B will be maturing by 2024, with the rest well staggered through 2032. Combined with its growing war chest of cash and equivalents and the eventual sale of its massive inventories, the company appears well poised for growth and expansion during the time of economic uncertainty ahead.
It Remains To Be Seen If COST Can Sustain Its Growth Momentum
S&P Capital IQ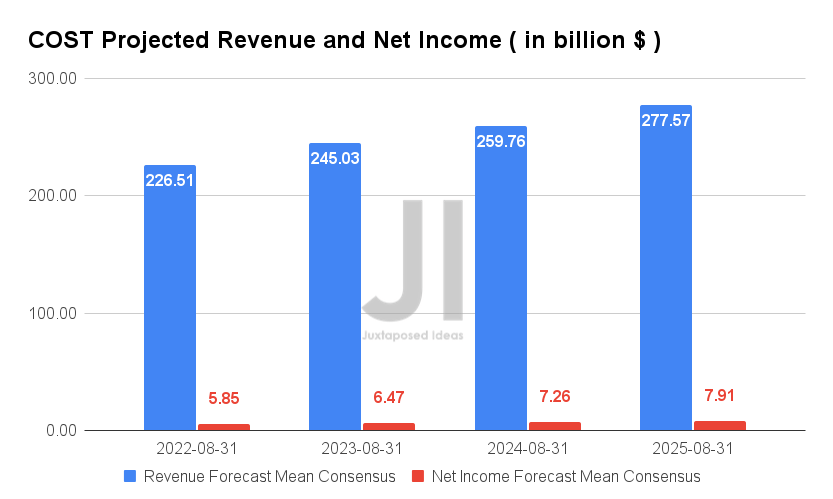
Over the next five years, COST is expected to report revenues and net income growth at a CAGR of 9.1% and 12.15%, respectively, faster than the pre-pandemic revenue growth of 8.76%, respectively, though at a more normalized rate than the past 3Y revenue CAGR of 14.05%. Consensus estimates are also relatively optimistic about its forward profitability, given the improvement in its net income margins from 2.4% in FY2019 to 2.84% by FY2025.
For its upcoming earnings call, COST is expected to report revenues of $226.51B and net income of $5.85B in FY2022, representing impressive YoY growth of 15.6% and 17%, respectively. Analysts will also be closely watching its FQ4’22 performance, with consensus estimates’ projected EPS of $4.17 and revenues of $71.96B, representing tremendous YoY growth of 6.9% and 14.81%, respectively.
We expect COST to report excellent numbers then, given the increases in comparable sales in May, June, and July 2022. For May 2022, the company reported total comparable sales growth of 11.8%, June 2022 – growth of 13%, and July 2022 – growth of 7%, excluding impacts from gasoline prices and foreign exchange. For e-commerce alone, May saw YoY growth of 6.3%, June 7%, and July 11.5%. There are some signs of QoQ sales slowdown, possibly attributed to the rising inflation and Amazon’s (AMZN) Prime Day sales in July 2022, with e-commerce growth potentially attributed to the rising delivery orders. We shall see, since the FX and gasoline impacts remain tailwinds to COST’s financial and stock performance.
In the meantime, we encourage you to read our previous article on COST, which would help you better understand its position and market opportunities.
- Costco: Buy After The Blood Bath Is Over
So, Is COST Stock A Buy, Sell, Or Hold?
COST 5Y EV/Revenue and P/E Valuations
S&P Capital IQ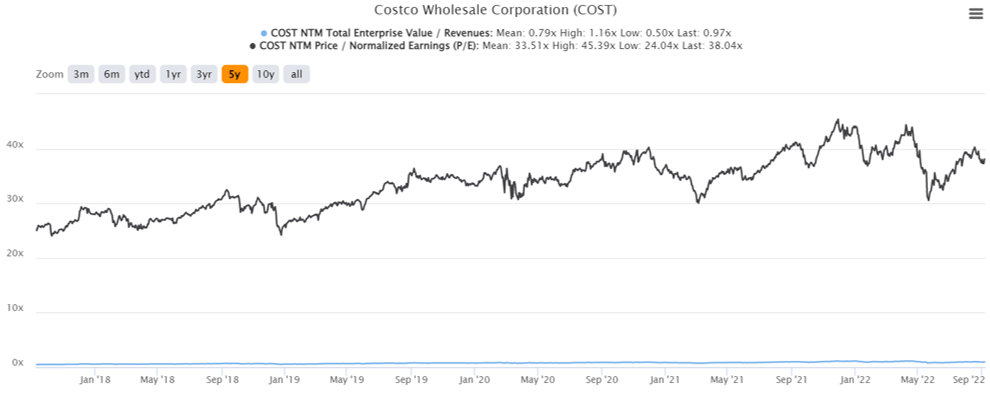
COST is currently trading at an EV/NTM Revenue of 0.97x and NTM P/E of 38.04x, higher than its 5Y mean of 0.79x and 33.51x, respectively. The stock is also trading at $529.32, down 13.5% from its 52-week high of $612.27, though at a premium of 30.2% from its 52-week low of $406.51.
COST 5Y Stock Price
Seeking Alpha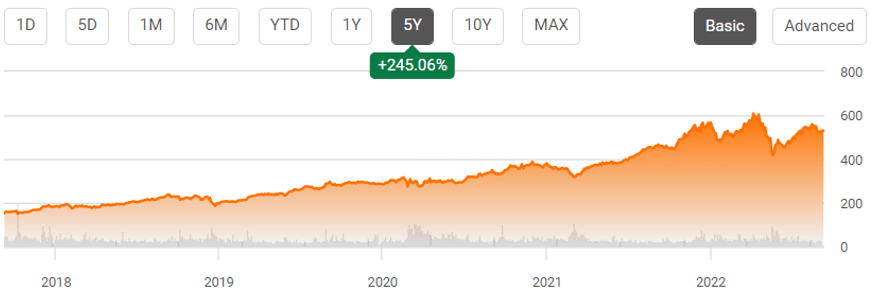
Despite the consensus estimates’ attractive buy rating, the price target of $562 indicates a minimal upside of 6.21% from current prices. In addition, the COST stock is starting to show signs of weakness, with a -4% fall post the Fed’s hawkish commentary on 26 August. Therefore, we may potentially see further stock declines ahead, as we near the Fed’s upcoming meeting on 20 September.
COST’s FQ4’22 earnings call on 22 September would also be critical to its stock performance, since Walmart (WMT) and Target (TGT) still reported elevated inventories of $59.92B and $15.32B in their latest quarter. It represents a massive increase of 25.5% and 36.1% YoY, similar to COST’s at 26% YoY in FQ3’22 as consumers globally tighten their belts. As a result, we encourage investors to wait for a deeper retracement and more clarity from the two upcoming events before adding to their portfolio.
Therefore, we rate COST stock as a Hold for now.
Be the first to comment