

Pgiam/iStock via Getty Images
COT Data
Every Tuesday the CFTC (Commodity Futures Trading Commission) compiles trading positions of five different classes of futures traders and publishes the report on Friday. The investor classes are named dealers, asset managers, leveraged traders, reportable and nonreportable traders. The report lists the number of long, short and spread contracts of each investor class.
The “Commitment of Traders” (COT) data has been around for 60 or 70 years and over the years has been very useful at forecasting market direction. The COT data makes wonderful “contrary opinion” indicators because the greater short selling in the futures market gives clearer insight into what investors are expecting price wise.
The S&P E-Mini Futures
The best futures market to follow for stock market forecasting is the CME E-mini S&P futures market. COT data became available on the CME E-mini S&P futures in 2006. In this market, the largest investor class are the “asset managers,” which account for 40% of all positions. The asset managers are institutional investors, including pension funds, endowments, insurance companies, mutual funds and those portfolio/investment managers whose clients are predominantly institutional. History shows that stock future asset managers are overly “short” at the bottom of the stock market and overly “long” near the top.
Note: It is a common misconception that the theory of contrary opinion only applies to small, unsophisticated investors; that there are classes of sophisticated investors who are usually right at tops and bottoms of the market. This is not true. History generally shows all classes of traders, unless forced to take opposite positions by their trading duties, are overly “long” at market tops and overly “short” at the bottom.
E-mini % Short Future Asset Managers (Michael McDonald)
“Overly” Short or “Overly” Long
So, when are asset managers “overly” long or “overly” short the stock market? History has an answer to this question. Since 2006, the average short position of asset managers has been 29.5%. The red curve in the graph above plots this percent back to 2006. The ratio ranges from a low of 6.6% to a high of 46%. Any ratio over 40% means asset managers are “overly short” the market; they have too high an expectation for lower prices. Stocks will go opposite. The current ratio is 44.4%
The table below shows the nine dates since 2006 when the short selling ratio exceeded 40%. The table includes the value of the Spider ETF on that date and its value two years later. (The date refers to the first time the ratio goes above 40% if there is a continuous period of it being over 40%). The results ranged from price gains of 6.1% per year to 32.1% per year over two years, with the average price gain being 17.1% per year (18.6% when dividends are included).
Study Results (Michael McDonald)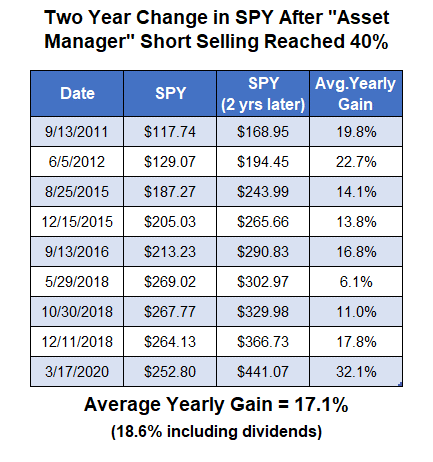
Take Away
Investor sentiment based on the “commitment of traders” data on the E-mini S&P futures, confirms the information in my SA article titled, “DOG, PSQ, And SH: 3 New Contrary Opinion Indicators Pointing To A Major Market Bottom,” published on 30 June 2022. That contrary opinion indicators are strongly suggesting that we are at an important “risk-on” moment in the stock market.
Investors should buy (or continue to hold) any broad-based stock fund or ETF for at least a two-year investment.
Be the first to comment