

DNY59/iStock via Getty Images
Investment Thesis
Micron Technology, Inc. (NASDAQ:MU) has slipped by -24.6% in the past three weeks, together with the semiconductor industry in general. Other big names, such as Intel (INTC), Nvidia (NVDA), and AMD (AMD), have also fallen by -15.8%, -15.4%, and -22.8% since 02 June 2022, respectively. Despite the return to pre-pandemic stock price levels and its excellent historical execution, we are concerned about MU’s trajectory, given the potential recession reducing consumer and enterprise demand for the short term.
Due to the mixed signals and potential volatility, we encourage caution among MU investors about adding more during the dip. Instead, it would be advisable to wait for its upcoming earnings call and make an informed decision on your investments.
MU Proved To Be More Than Capable In Navigating Temporary Headwinds
MU Revenues, Net Income, Net Income and Gross Margin
S&P Capital IQ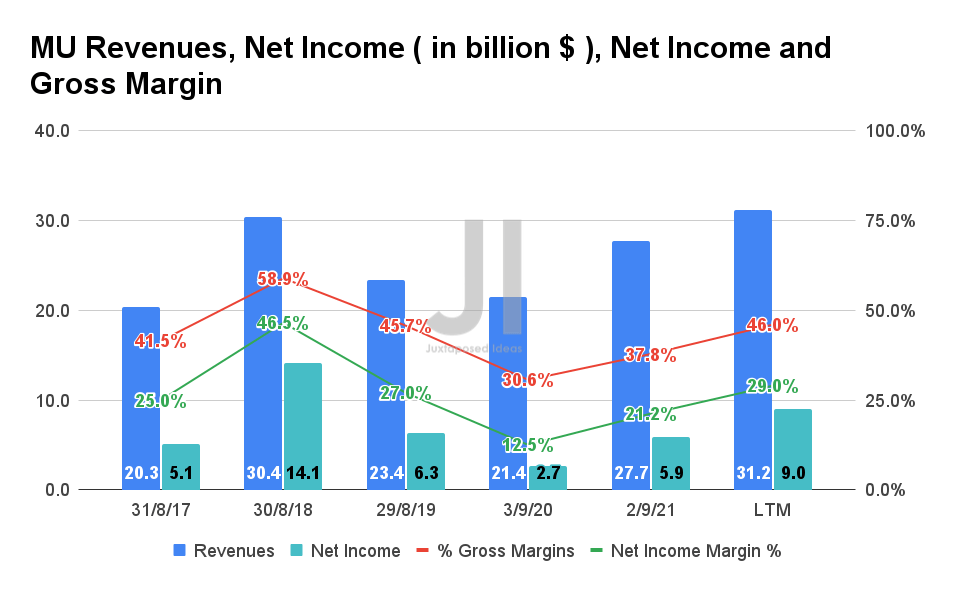
MU is finally reaping the rewards of its investments, given the steady increase of its revenues and net income, while also improving its margins over time. In the LTM, the company reported revenues of $31.2B with a net income of $9B, representing an increase of 33% and 31.8%, respectively, from FY2019’s levels. In addition, the company managed to restore and improve its gross and net income margins to 46% and 29%, respectively, despite the ongoing macro issues, China’s Zero COVID Policy, and the Ukraine war. Therefore, it is evident that MU’s management has been more than capable of navigating the temporary headwinds.
MU Cash/ Equivalents, FCF, and FCF Margins
S&P Capital IQ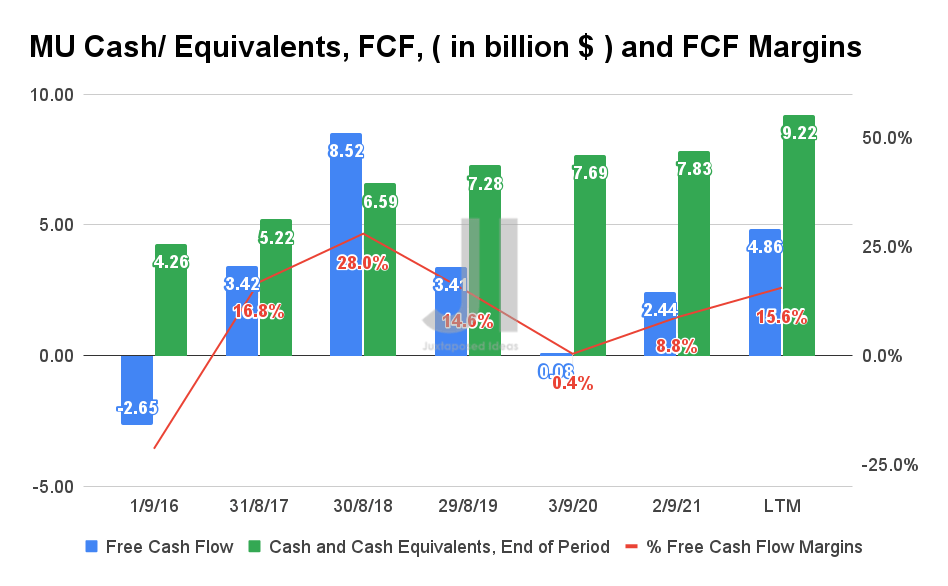
MU has also reported robust Free Cash Flow (FCF) profitability in the LTM, with FCF of $4.86B and an FCF margin of 15.6%. We are also encouraged to see its growing war chest of cash and equivalents of $9.22B in the LTM, thereby ensuring more than sufficient capital for the company’s R&D efforts and future expansion in manufacturing capacities.
MU Operational Expense
S&P Capital IQ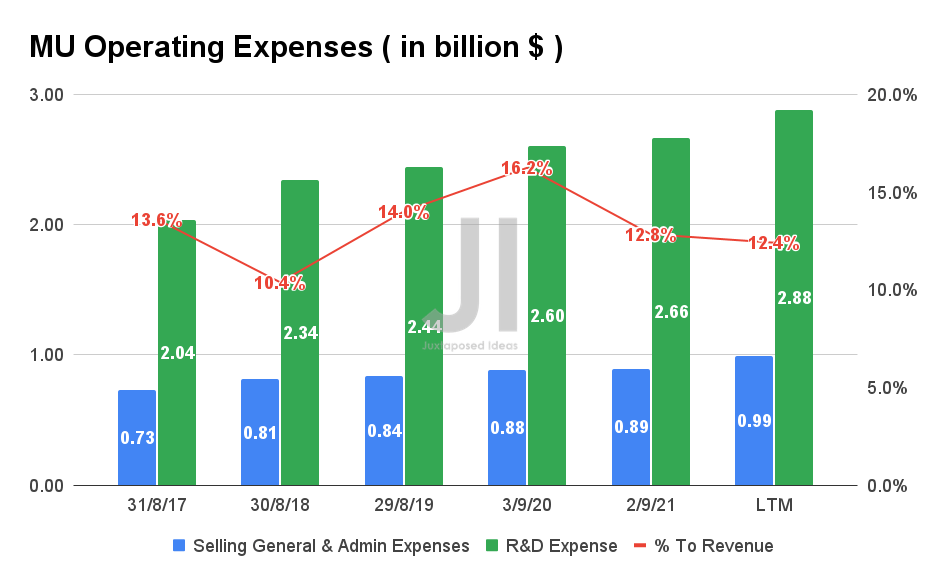
It is evident that MU has been re-investing into the business over the years, with total operating expenses of $3.87B in the LTM, with an increased emphasis on the R&D segment at a 74.4% weightage. However, we would also like to highlight that the company has been rather prudent in its expenses thus far, given that its operating costs are sustained at an average of 13.4% relative to its revenues in the past five years.
MU Net PPE, Capex, and Long-Term Debt
S&P Capital IQ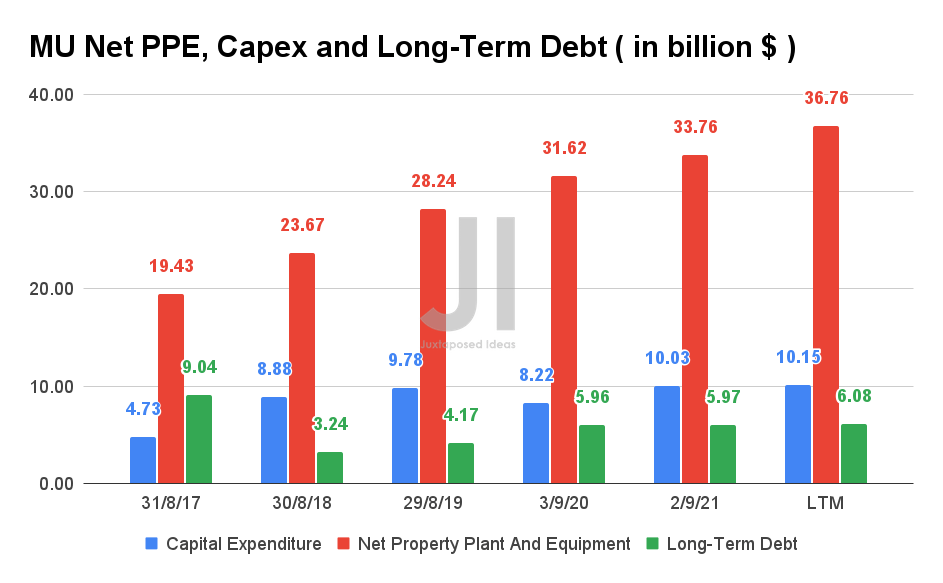
In addition, MU has been ramping up its production capacity over the years with increased capital expenditure over the years. In the LTM alone, the company reported $10.15B in capex, with FY2022 guidance of up to $12B, representing an increase of 19.6% YoY. In the longer term, MU is also expecting to invest over $150B by 2031 to support its R&D processes and increase its DRAM manufacturing capacity, potentially in the US and Asia.
Therefore, combined with its cleanroom expansions, it is no wonder that MU is able to deliver record revenues in the data-center SSD, cloud DRAM, and auto segments in FQ2’22, while also providing cost reductions for both DRAM and NAND in FQ3’22. In addition, the company was able to offer its industry-leading 1-alpha DRAM and 176-layer NAND technology node ramps, which have proven to be a robust revenue driver in FQ2’22, especially in the data center market. As a result, we may potentially see MU report a notable improvement in its gross margins for the upcoming quarter.
Nonetheless, it is also essential to note that MU has been increasing its reliance on debt leveraging with a total of $6.08B in long-term debts in the LTM. Furthermore, the company had spent a total of $395M in stock-based compensation (SBC) expenses in FY2021, with $235M already accumulated by H1’22. Assuming a similar rate, MU would report a projected $470M in SBC expenses in FY2022, representing an increase of 18.9% YoY. Nonetheless, we are not concerned at all, given the company’s robust net income and FCF profitability.
MU Projected Revenue and Net Income
S&P Capital IQ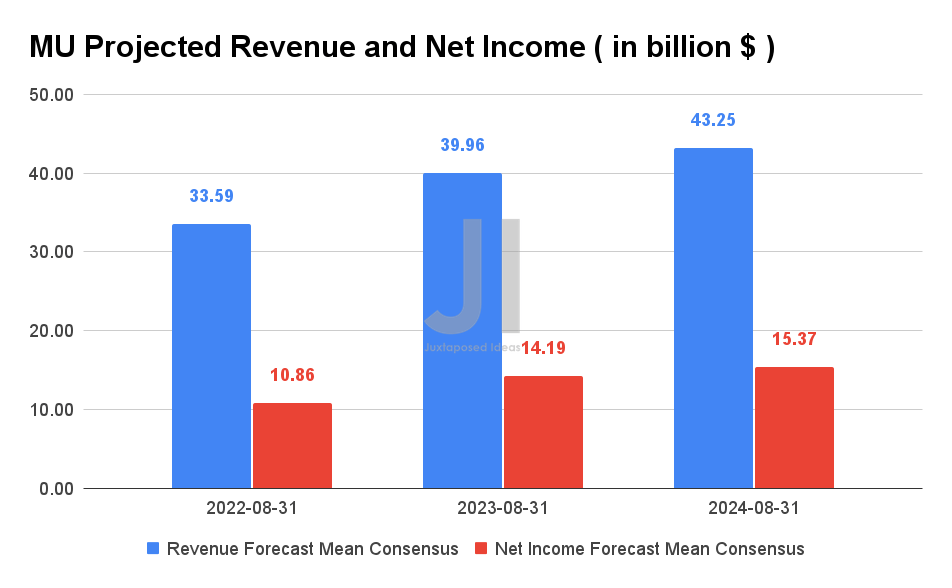
Since our previous analysis, MU’s revenue and net income growth have remained relatively unchanged, thereby indicating the market’s confidence in its future execution. Analysts will be looking forward to its performance in FQ3’22, given its previous revenue guidance of up to $8.9B with gross margins of up to 48%. The revenue would represent an excellent increase of 14.3% QoQ and 20.2% YoY, though it is also essential to note that the MU stock had irrationally declined by -28.2% since its stellar FQ2’22 earnings call.
Nevertheless, MU’s guidance for FQ4’22 would be crucial, since the semiconductor market has been hit hard by the potential recession and the Fed’s hike in interest rates, possibly triggering a decline in consumer and enterprise demand for the next few quarters. We shall see.
In the meantime, we encourage you to read our previous article on MU, which would help you better understand its position and market opportunities.
- Micron Stock: Undervalued With Massive Potential – Here’s Why
So, Is MU Stock A Buy, Sell, or Hold?
MU 5Y EV/Revenue and P/E Valuations
S&P Capital IQ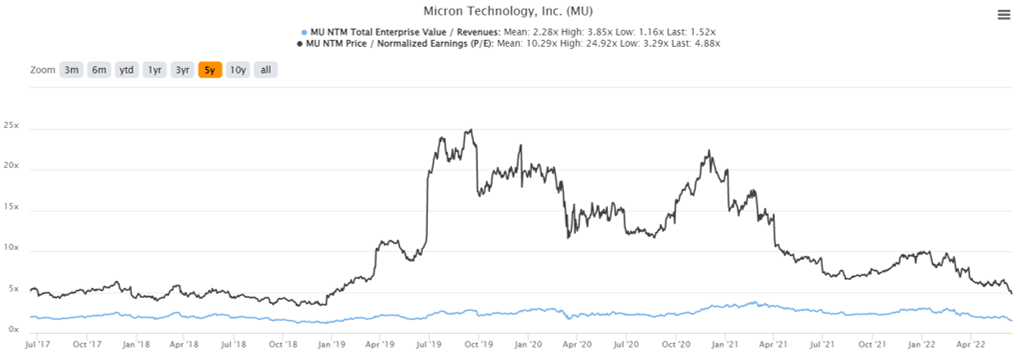
MU is currently trading at an EV/NTM Revenue of 1.54x and NTM P/E of 3.93x, lower than its 5Y mean of 2.28x and 10.29x, respectively. The stock is also trading at $56.8, representing a -26.14% decline since our previous analysis in April 2022, nearing its 52 weeks low of $53.60 as well. It is apparent that the bearish sentiments have yet to recover, since the S&P 500 index has also fallen by -17.22% at the same time.
MU 5Y Stock Price
Seeking Alpha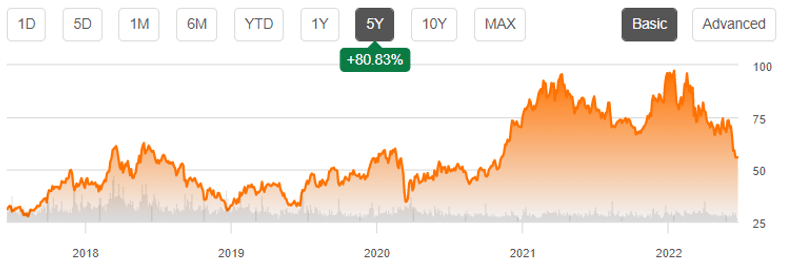
Despite the attractive buy rating from the consensus estimates with a price target of $105.79, the 86.25% upside seems rather exaggerated now, since MU has always plunged once it nears the resistance level of over $90s. In addition, it is also apparent that MU has lost all of its pandemic gains, similar to other stocks in the semiconductor market. Combined with the slowing demand for PCs and smartphones, the stock could potentially retrace further to that in early 2019, assuming that the company issues softer FQ4’22 guidance, similar to NVDA. We shall anticipate the company’s earnings call on 30 June 2022 for more clarity.
Therefore, we rate MU stock as a Hold for now.
Be the first to comment