

S&P 500 – Talking Points
- S&P 500 begins week on the backfoot, rallies above 3900 continue to fail
- Evening star on the daily chart paints ominous picture for S&P 500
- The analysis contained in article relies on price action and chart formations. To learn more about price action or chart patterns, check out our DailyFX Education section.
{{GUIDE_EQUITIES}}
Stocks look set to begin the week with noticeable declines as the S&P 500 fails to gain traction above the 3900 area. Risk performed well last week, as S&P 500 futures briefly traded up to 3920. We are set to enter a major period for risk assets with inflation data and corporate earnings dotting the near-term economic calendar. Market participants will look to CPI and PPI data, as well as commentary from major bank CEOs on the state of the economy for clues on how to trade in the near-term. The significance of upcoming risk events as well as continued uncertainty could see a rise in volatility over the next few weeks.
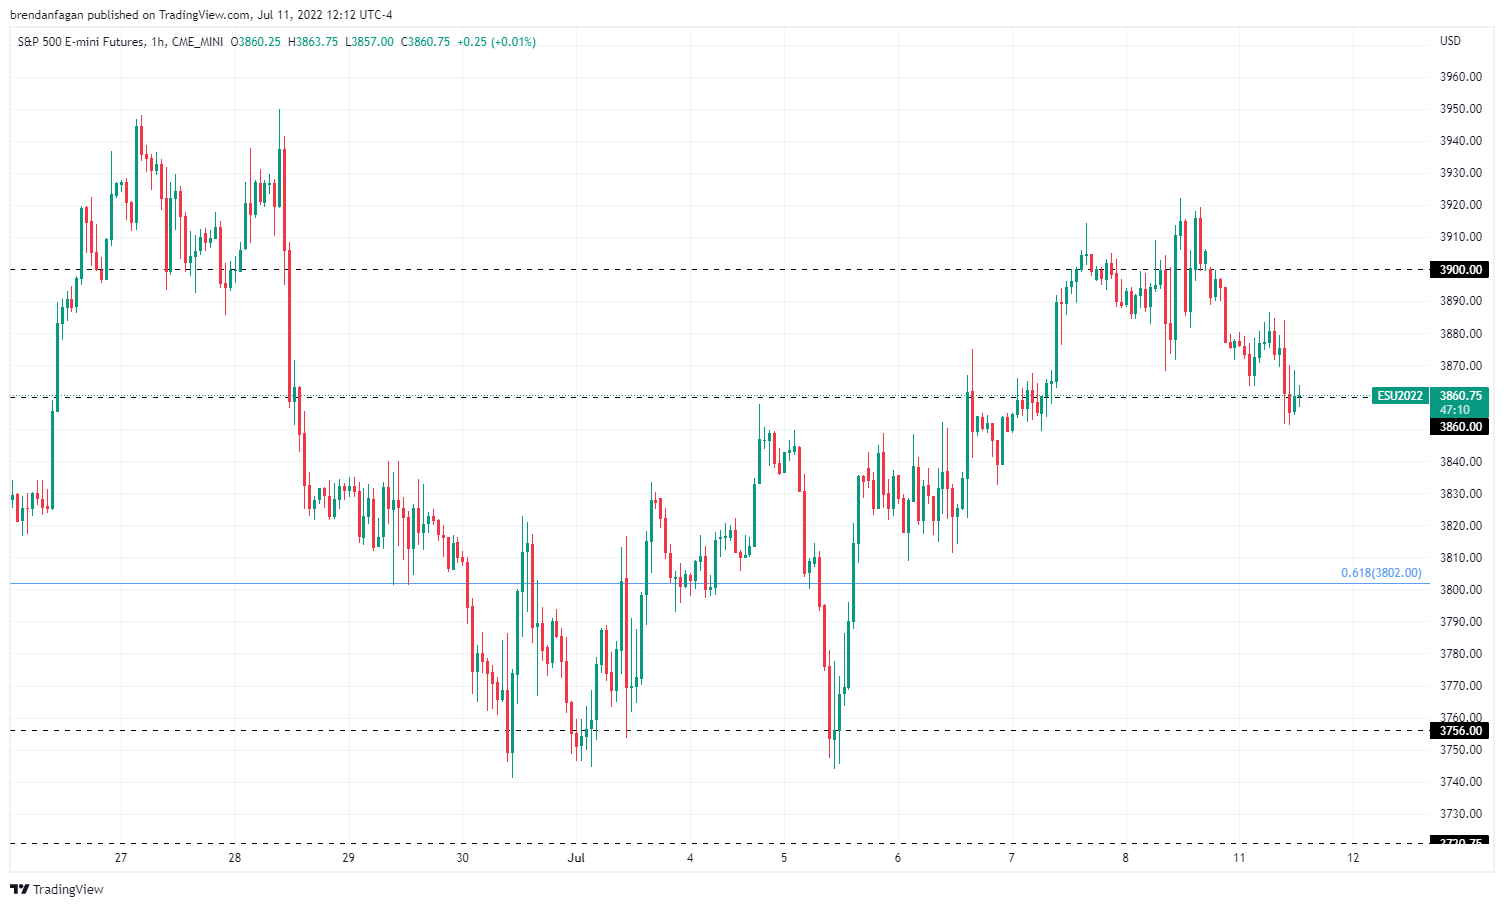
S&P 500 Futures (ES) 1 Hour Chart
Chart created with TradingView
Thanks to a strong rally last week, S&P 500 futures were able to trade through the key 3900 level. Despite the upbeat mood on Friday, markets declined into the open in NY on Monday. 3900 has been a solid level for bears to enter shorts of late, with all rallies ultimately fading to lower prices. So far, price has been able to hold itself at the key pivot of 3860. Markets may continue to gyrate into Wednesday’s CPI print, as last month’s data release was the catalyst for a major move in risk. Should bears take price below current support at 3860, traders may look to major Fib support at 3802.
S&P 500 Futures (ES) Daily Chart
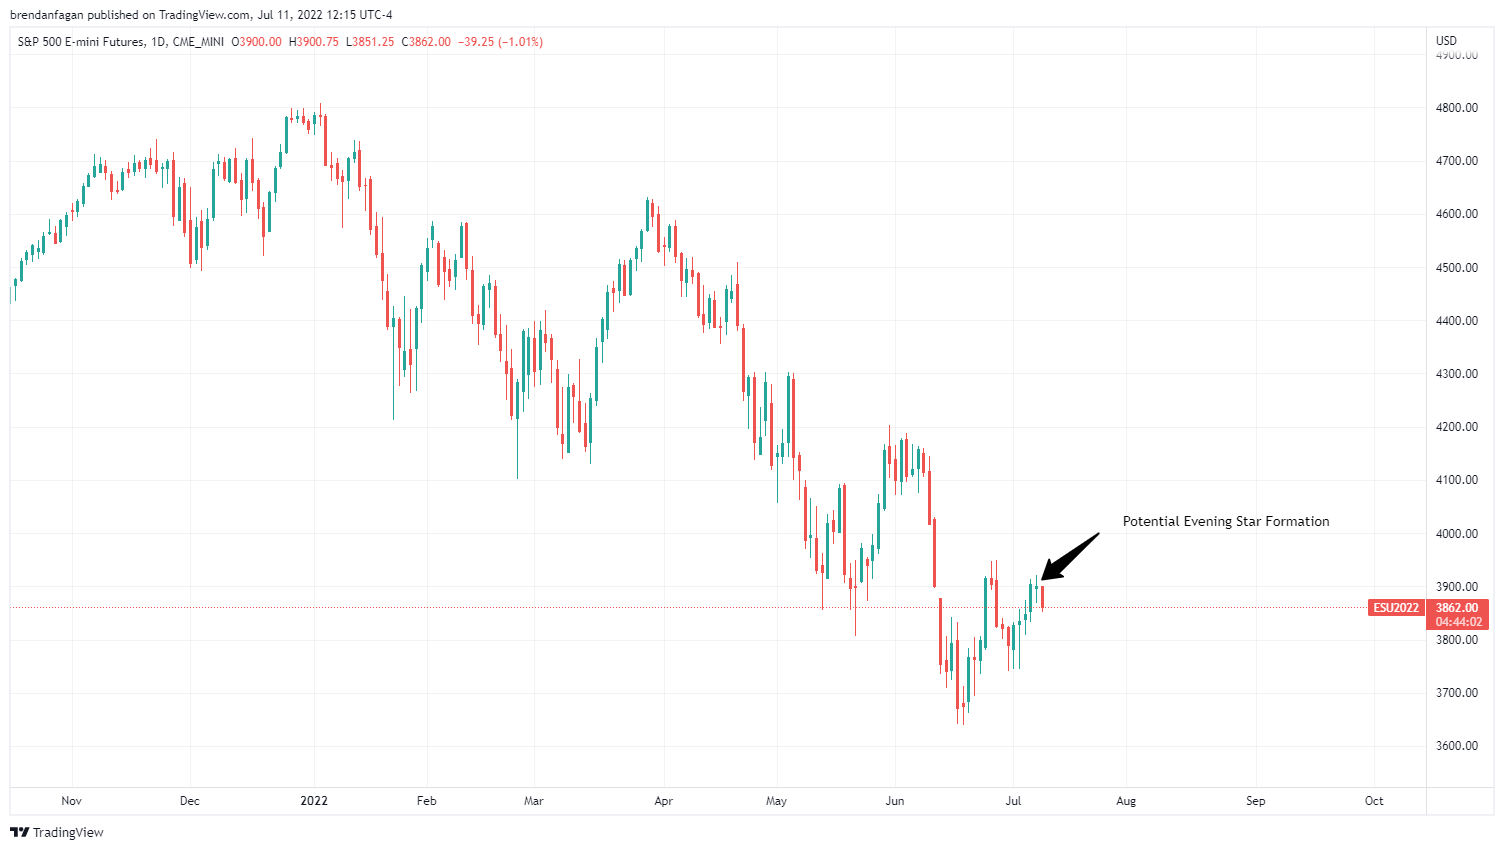
Chart created with TradingView
When we zoom out to the daily timeframe, the picture becomes much clearer. Despite last week’s decent rally, price was unable to revisit the late-June swing highs around 3950. With this rally making a lower high, it would make sense to retain a bearish outlook on the index. When looking at the price action of the last few days, we can see the formation of a potential evening star candle pattern. This formation is often used as a bearish trend reversal pattern, often spotted at the end of an uptrend. If we see follow through from here in the form of lower prices, ES could make a quick return to YTD lows below 3700.
Resources for Forex Traders
Whether you are a new or experienced trader, we have several resources available to help you; indicator for tracking trader sentiment, quarterly trading forecasts, analytical and educational webinars held daily, trading guides to help you improve trading performance, and one specifically for those who are new to forex.
— Written by Brendan Fagan, Intern
To contact Brendan, use the comments section below or @BrendanFaganFX on Twitter
Be the first to comment