

PonyWang
The Clough Global Opportunities Fund (NYSE:GLO) relies heavily on its ‘star manager’ to make differentiated macro calls. Unfortunately, those calls proved to be wrong in 2022, leading to abysmal short-term performance. Although the yield looks attractive at 19.8%, there is a significant risk the distribution may be cut, as it is clearly unsustainable judging by investment performance.
Fund Overview
The Clough Global Opportunities Fund is a closed-end fund (“CEF”) that seeks to provide a high level of total returns through investments in equity, equity-related securities, and fixed income securities. The fund has approximately $250 million in assets.
Strategy
The GLO fund primarily invests in a mix of U.S. and global equity and debt securities using the manager’s fundamental research driven investment process. The fund’s investment mandate is flexibly managed such that it can opportunistically invest anywhere in the world where the manager sees good risk/reward opportunities.
Star Manager Driving The Bus
The GLO fund is lead managed by Charles Clough, an all-star investment strategist with over 50 years of experience. Prior to founding Clough Capital, Mr. Clough was the Chief Global Investment Strategist for Merrill Lynch & Co. from 1987 to 1999. During his tenure at Merrill, Mr. Clough was named to the Institutional Investor All-American Research Team for 12 years and was the top ranked strategist on 3 separate occasions.
Portfolio Holdings
As of September 30, 2022, the GLO portfolio was heavily levered, with a leverage ratio of 42% (Figure 1).
Figure 1 – GLO key facts (cloughglobal.com)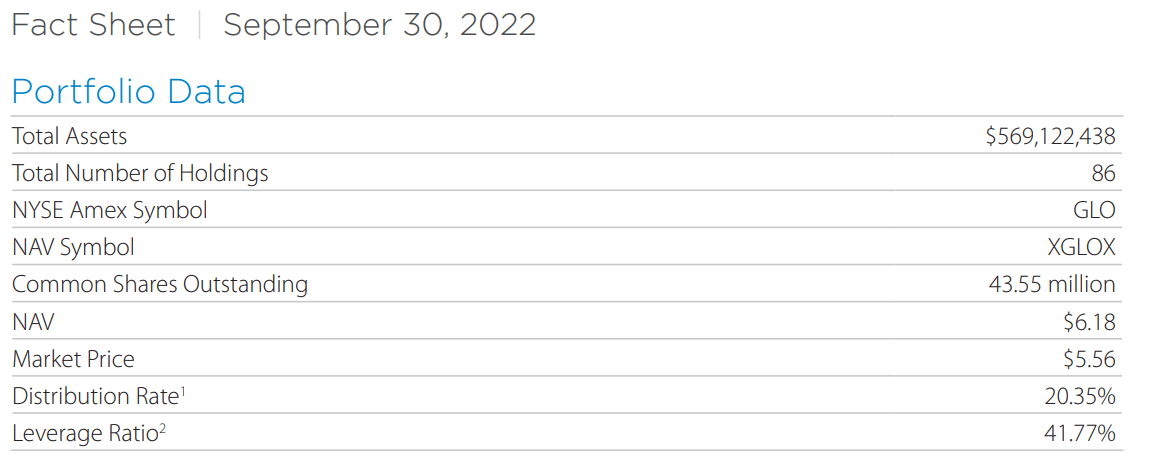
In terms of the total investment portfolio, GLO is 43% invested in equities and 51% invested in fixed income (Figure 2).
Figure 2 – GLO asset allocation (GLO September 2022 factsheet)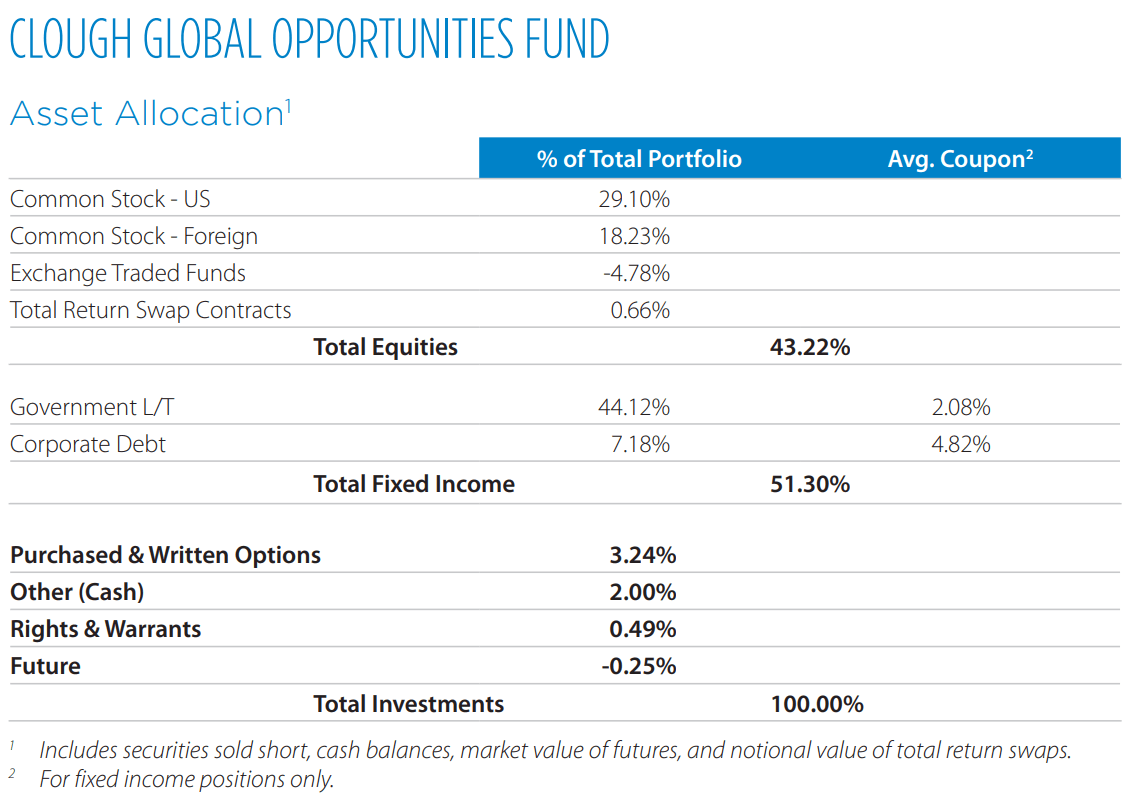
GLO’s equity portfolio sector allocation is shown in Figure 3.
Figure 3 – GLO equity portfolio sector allocation (GLO September 2022 factsheet)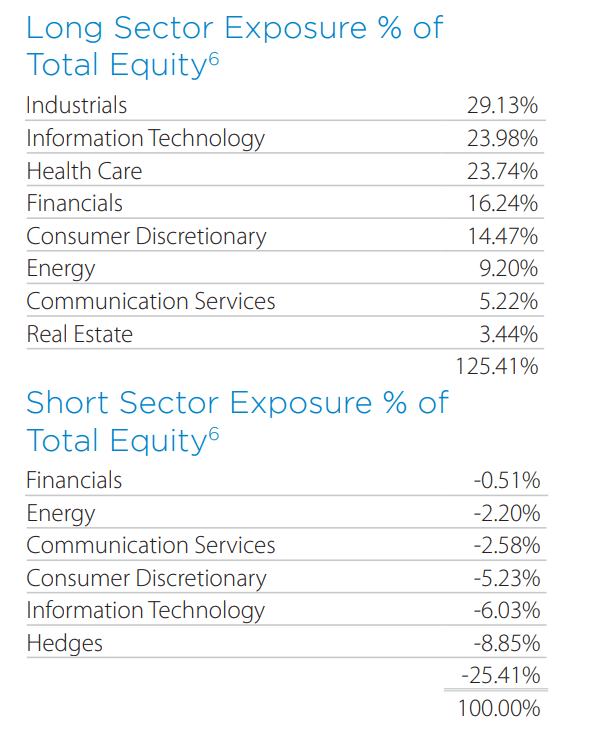
The fund is currently heavily overweight industrials (29.1% net long vs. 10.4% in the MSCI World Index) and healthcare (23.7% net long vs. 14.0%). The fund has no materials or utilities exposure. The iShares MSCI World ETF’s (URTH) sector allocation is shown in figure 4 for reference.
Figure 4 – URTH sector allocation (ishares.com)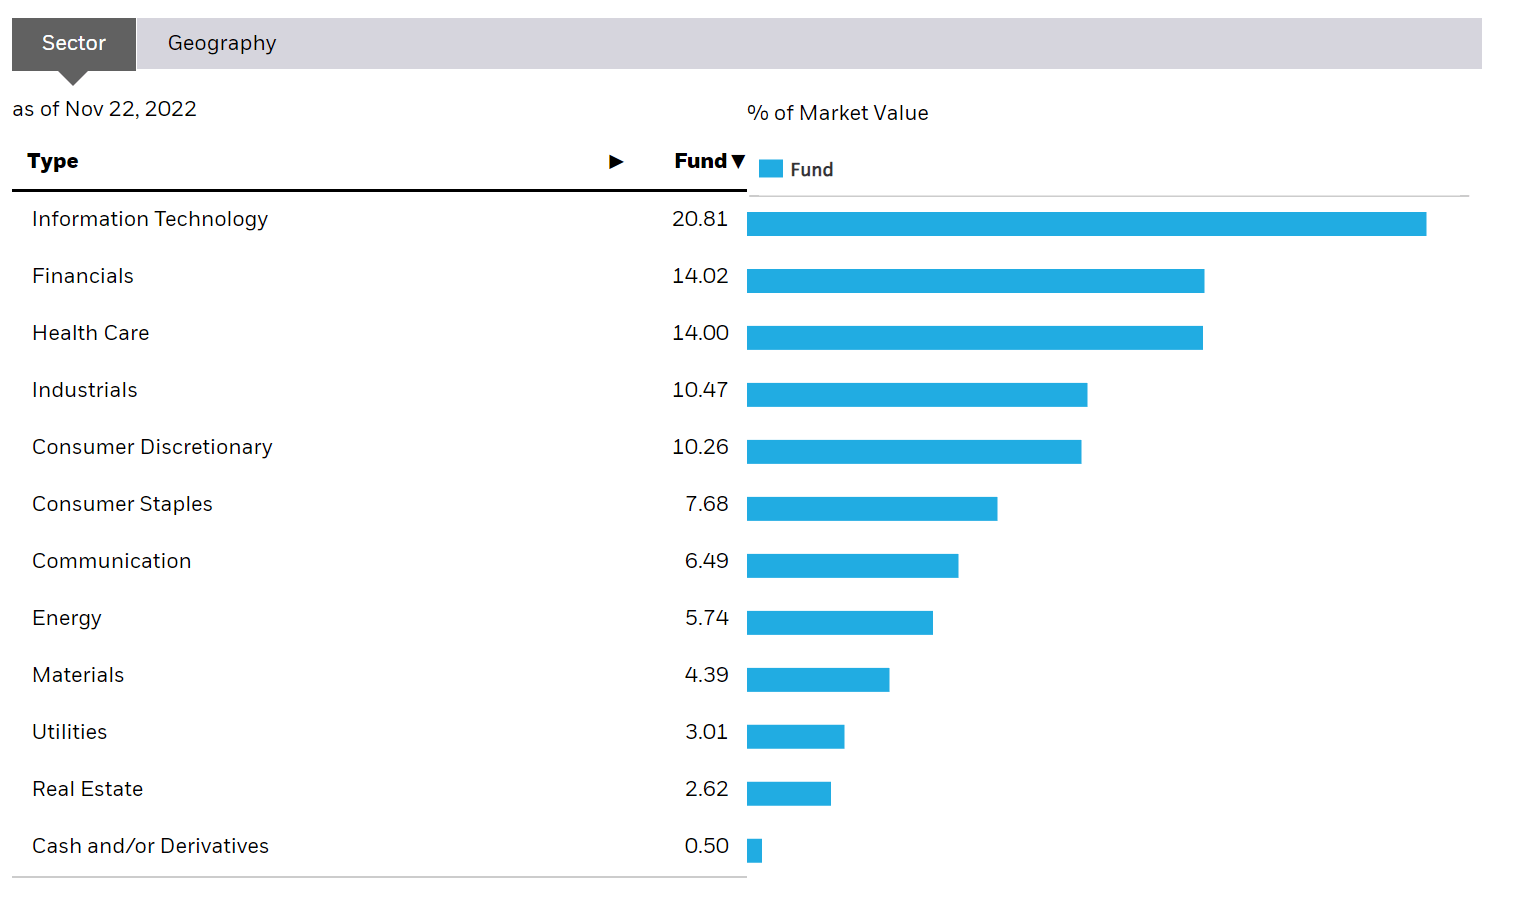
Returns
GLO has had a disastrous year, with 1 Year return of -39.8% on a NAV basis to September 3, 2022 (Figure 5). This has dragged down its long-term performance, with 3/5/10Yr average annual total returns of -3.5%/-0.7%/3.7% respectively.
Figure 5 – GLO returns (cloughglobal.com)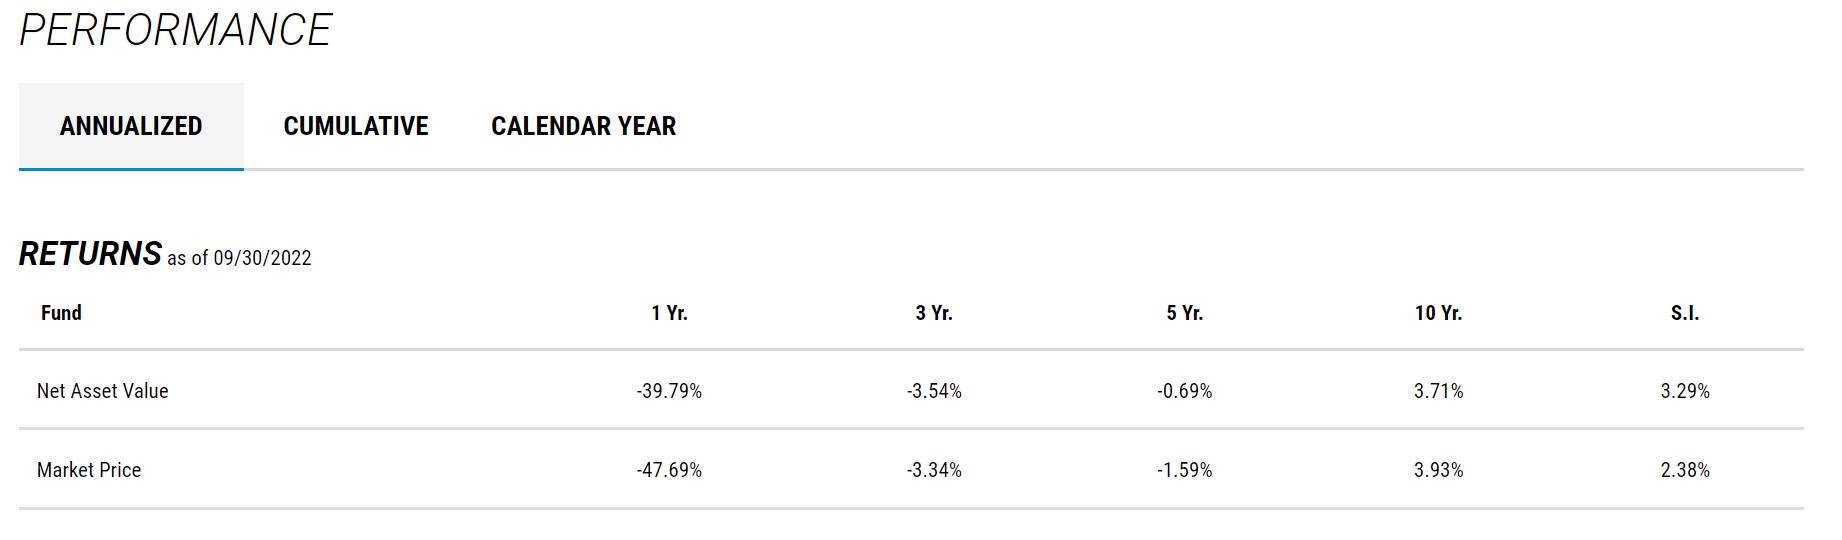
GLO Returns Usually Follow The World
Looking at GLO’s returns on an annual basis, we can see GLO had historically performed directionally in line with the world, as represented by the URTH ETF’s returns. Figure 6 shows GLO’s annual returns overlaid on URTH’s annual returns.
Figure 6 – GLO returns vs. URTH (GLO annual returns from cloughglobal.com and URTH returns from ishares.com)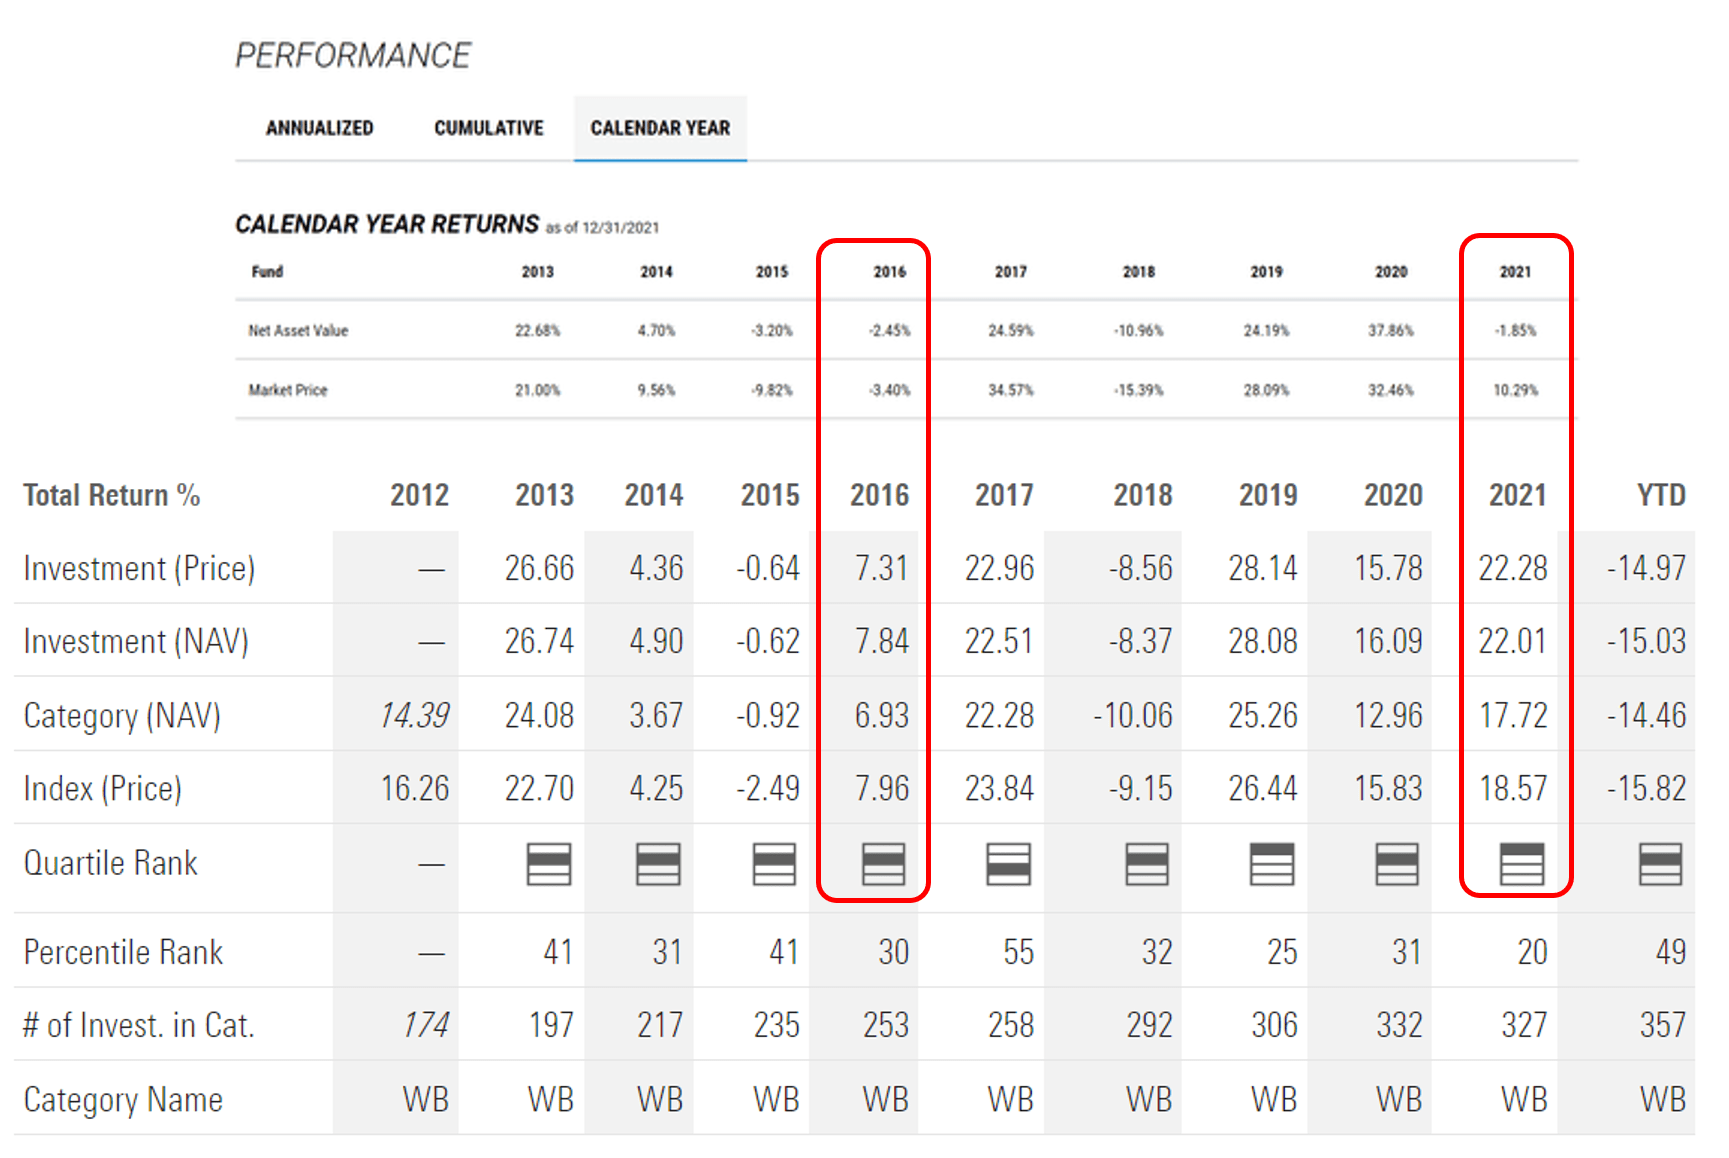
When the world zigs, GLO usually zigs, and when the world zags, GLO usually zags. The key divergences were in 2016 and 2021, when the MSCI world rallied while GLO performed poorly.
What Happened In 2021?
Interestingly, if we go through the fund’s annual report, the year to October 31, 2021 was a fantastic year, with GLO returning 34.7% on a 1-Year basis (Figure 7).
Figure 7 – GLO returns to October 31, 2021 (GLO 2021 annual report)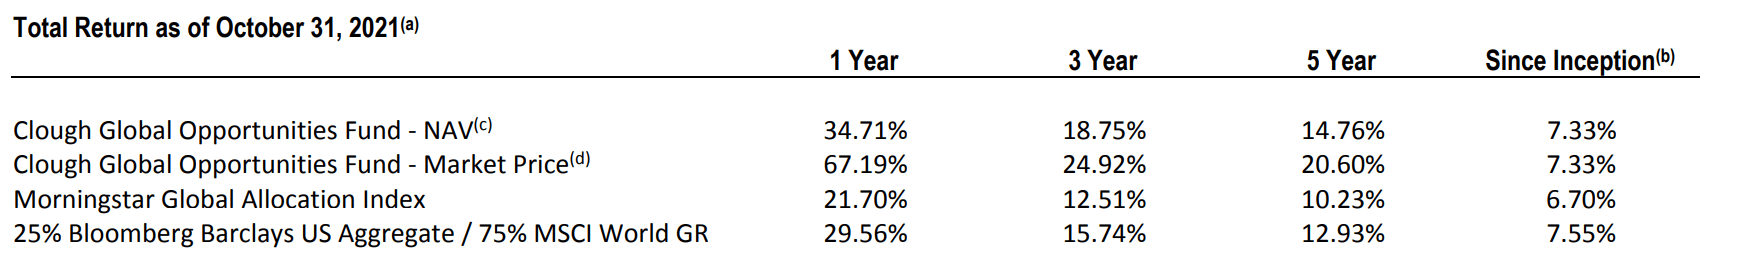
How did the fund go from +34.7% to -1.9% by a shift of 2 months in the measurement period? More importantly, how was the fund positioned, heading into 2022, that have led to the abysmal YTD performance?
Annual Report Provide Some Clues
GLO’s 2021 annual report provide some clues to answer the questions above. GLO had a differentiated view on inflation, expecting it to be transitory. The fund was also bullish on electric vehicles and China. Below are some quotes from the annual report:
If goods and labor shortages are pandemic‐induced, that suggests the stagflation thesis, which calls for weak growth accompanied by uncontrollable price increases, is unlikely.
That is possibly the reason the ten‐year U.S. Treasury yield is struggling to get to 2%.
The positive to all this is slower demand growth will give the U.S Federal Reserve (the “Fed”) room to slow the move to tapering.
While the Fund holds Tesla Inc., largely because of the company’s scale and technology lead, our holdings also include two China‐based companies, Contemporary Amperex Technology Co. Ltd. and BYD Co Ltd., both large battery manufacturers.
And the China internet stocks are cheap.
That suggests China’s housing market is too big to fail and government will intervene to avoid debt liquidation, and the likelihood of any systemic collapse has a low probability.
we would argue China’s housing stock will always need investment, as much of China’s housing was built for a 20‐year life and many of the cranes you see in city centers are to replace construction made 20‐30 years ago.
Sometimes All-Stars Strike Out
In essence, GLO’s star manager got the macro calls wrong. With the benefit of hindsight, it is clear that all three calls mentioned in the annual report went horribly wrong.
Inflation was not transitory and the U.S. 10-year treasury yield climbed to over 4%, causing the worst bond selloff since the 1940s. While electric vehicles continue to be adopted by consumers, EV and related company stocks have been horrible investments, with by CATL and BYD both declining by ~50% from 2021 highs. And everybody knows what happened with Chinese housing related stocks and bonds.
The weakness in GLO’s strategy is its reliance on the star manager to make differentiated macro calls. Unfortunately, nobody gets the macro calls right all the time (even the greats like Stanley Druckenmiller only get 6 out of 10 calls right), and in this case, GLO got all the major calls wrong at the same time.
The problem is, if we look at figure 7, at the best of times, it performs on par with a passive index fund like the URTH ETF. However, if you include the poor 2022 performance, GLO’s long-term 10 Yr average annual return of 3.7% to September 30, 2022 vastly underperforms the passive URTH ETF’s 8.3% (Figure 8).
Figure 8 – URTH average annual returns (ishares.com)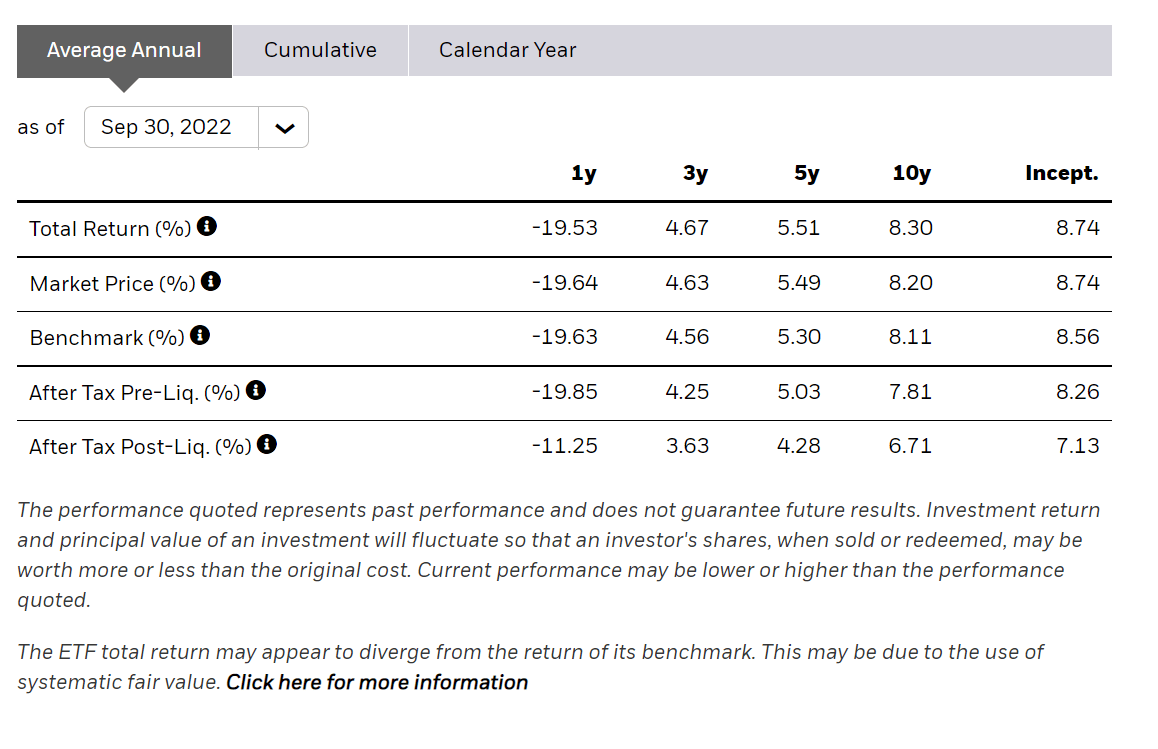
Distribution & Yield
GLO pays a very high distribution of $0.0943 per month, which annualizes to a 19.8% forward yield. However, investors should note that GLO’s 2022 distribution is being paid out of realized gains (Figure 9).
Figure 9 – GLO section 19.a report (cloughglobal.com)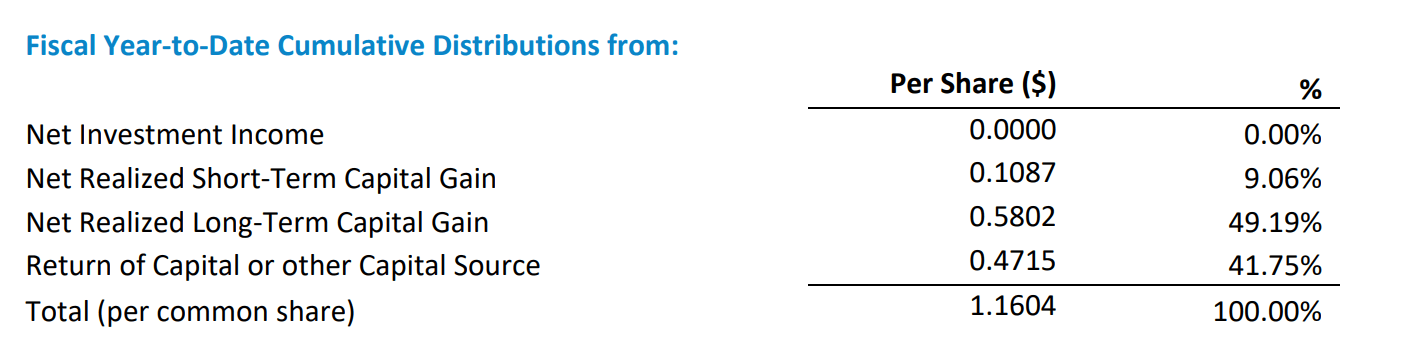
This is not a one-time occurrence, as historically, a significant portion of the distribution is paid out of realized gains or return of capital (Figure 10).
Figure 10 – GLO historical financial highlights (GLO 2021 annual report)
The monthly distribution has been decreased from $0.1087 in 2021. With the poor investment performance in 2022, the distribution looks unsustainable and may be cut further for 2023.
Fees
GLO charged total expenses of 2.78% in fiscal 2021.
Conclusion
The GLO fund relies heavily on its ‘star manager’ to make differentiated macro calls. Unfortunately, those calls proved to be wrong in 2022, leading to abysmal short-term performance. Although the yield looks attractive at 19.8%, there is a significant risk the distribution may be cut, as it is clearly unsustainable judging by investment performance.
Be the first to comment