

David Gyung/iStock via Getty Images
A Quick Take On Clearwater Analytics
Clearwater Analytics (NYSE:CWAN) went public in September 2021, raising approximately $540 million in gross proceeds from an IPO that was priced at $18.00 per share.
The firm provides automated investment data aggregation, accounting, compliance, risk and reporting functionalities to financial institutions.
Although CWAN is essentially at operating and EPS breakeven, its stock isn’t cheap compared to a broader SaaS index, and the company’s growth rate will likely face pressures in the period ahead.
I’m, therefore, on Hold for CWAN in the near term.
Clearwater Analytics Overview
Boise, Idaho-based Clearwater was founded to develop a SaaS platform to simplify investment accounting and analysis for asset managers, insurance companies and large corporations.
Management is headed by Chief Executive Officer, Sandeep Sahai, who has been with the firm since September 2016 and was previously CEO of Solmark, an investment partnership.
The company’s primary offerings include:
-
Data aggregation
-
Investment accounting and reporting
-
Performance measurement
-
Compliance monitoring
-
Risk analysis
The firm pursues client relationships with asset managers, insurance companies and large corporations via a direct sales and marketing force that is focused on the United States.
Clearwater Analytics’ Market & Competition
According to a 2021 market research report by Market Primes, the global investment management software market was an estimated $3 billion in 2019 and is forecast to reach nearly $4.5 billion by 2025.
This represents a forecast CAGR of 10.2% from 2019 to 2025.
The main drivers for this expected growth are a desire by users to automate repetitive tasks so they can focus on maximizing portfolio performance and creating more sophisticated approaches.
Also, assessing risks and exposures and being able to efficiently report and share the information with stakeholders will drive demand for more capable solutions.
Major competitive or other industry participants include:
-
SS&C
-
State Street
-
SAP
-
BNY Mellon (Eagle)
-
Simcorp
-
BlackRock
-
FIS
-
Northern Trust
-
Others
Clearwater Analytics’ Recent Financial Performance
-
Total revenue by quarter has risen according to the following chart:
9 Quarter Total Revenue (Seeking Alpha)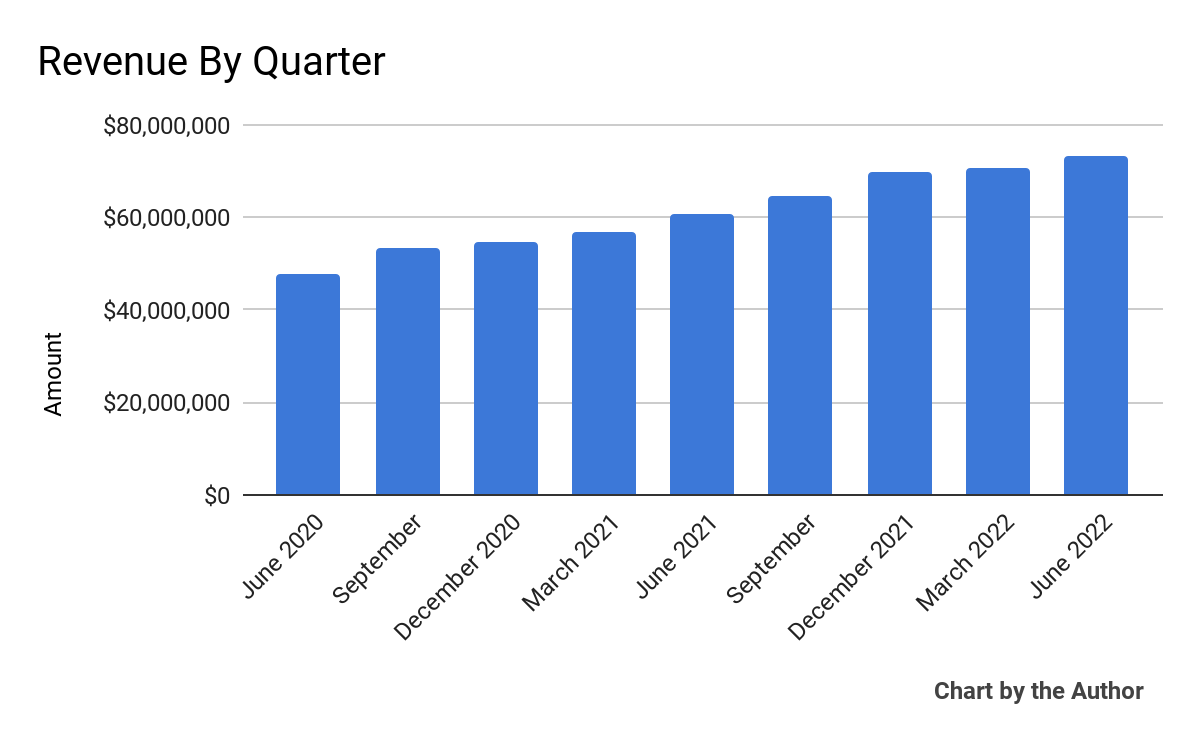
-
Gross profit by quarter has grown in a similar trajectory:
9 Quarter Gross Profit (Seeking Alpha)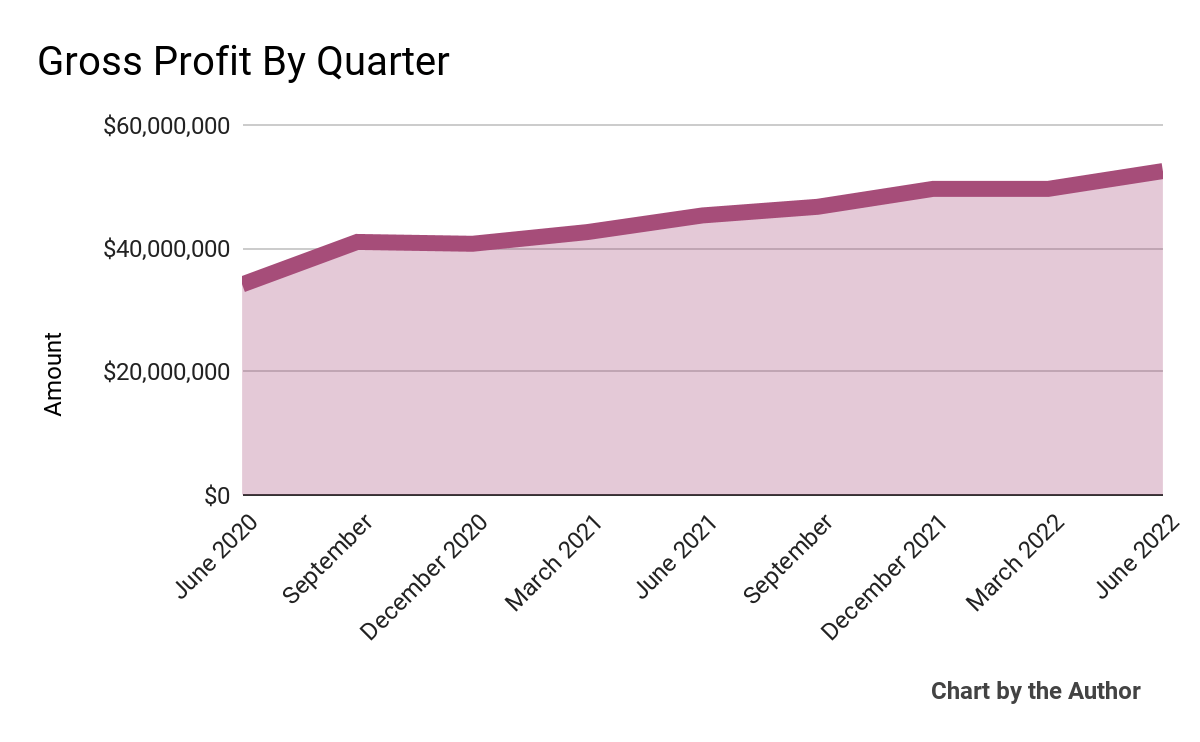
-
Selling, G&A expenses as a percentage of total revenue by quarter have increased in recent quarters:
9 Quarter Selling, G&A % Of Revenue (Seeking Alpha)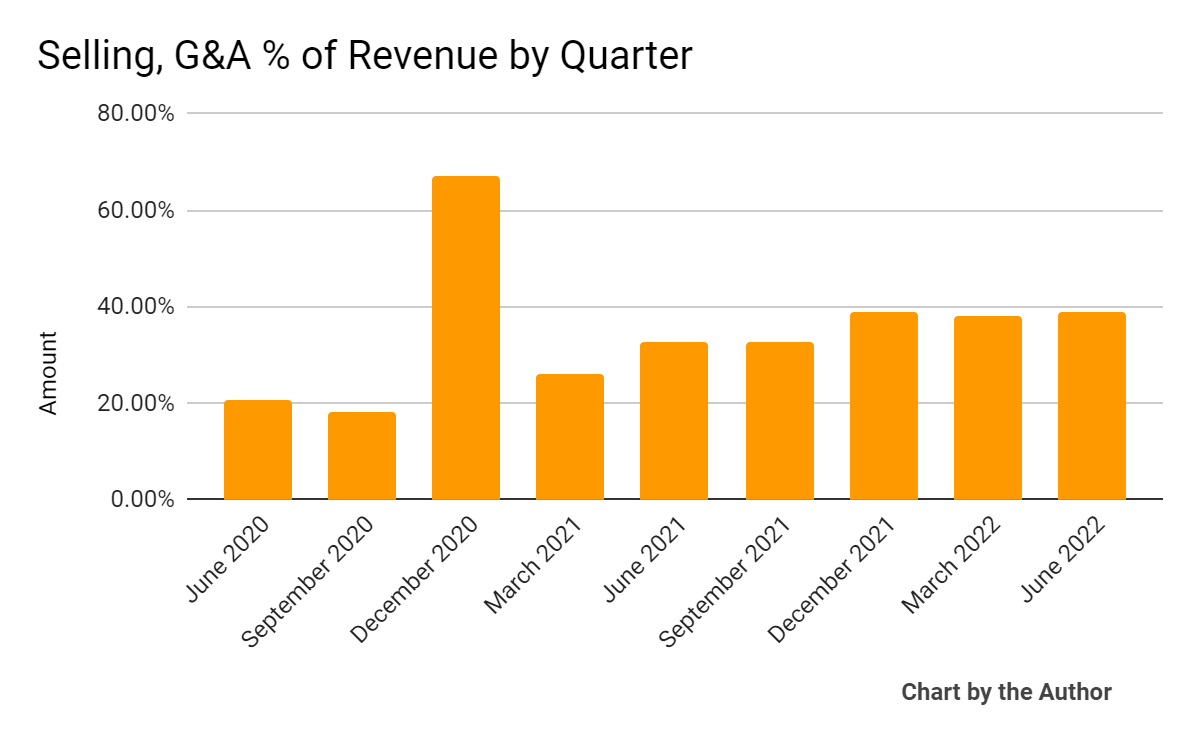
-
Operating income by quarter has remained negligible recently:
9 Quarter Operating Income (Seeking Alpha)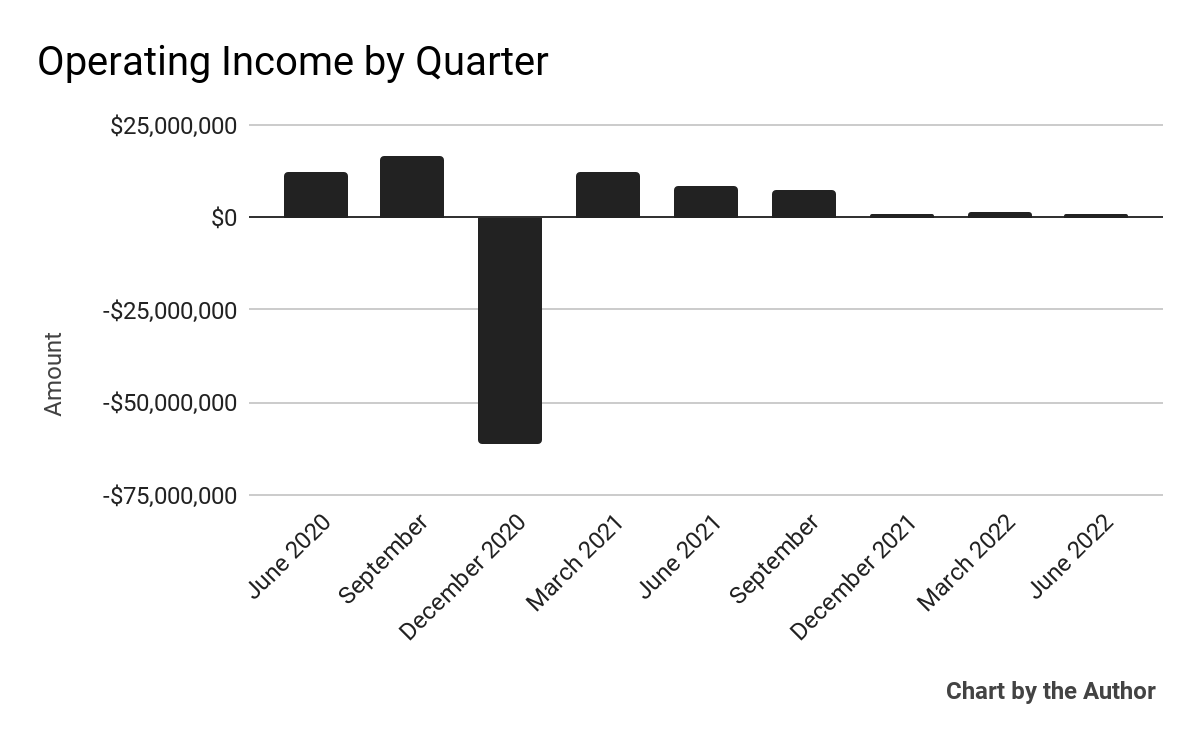
(All data in above charts is GAAP)
Over the past 12 months, CWAN’s stock price has fallen 30.3% vs. the U.S. S&P 500 Index’s drop of around 17.4%, as the chart below indicates:
52 Week Stock Price (Seeking Alpha)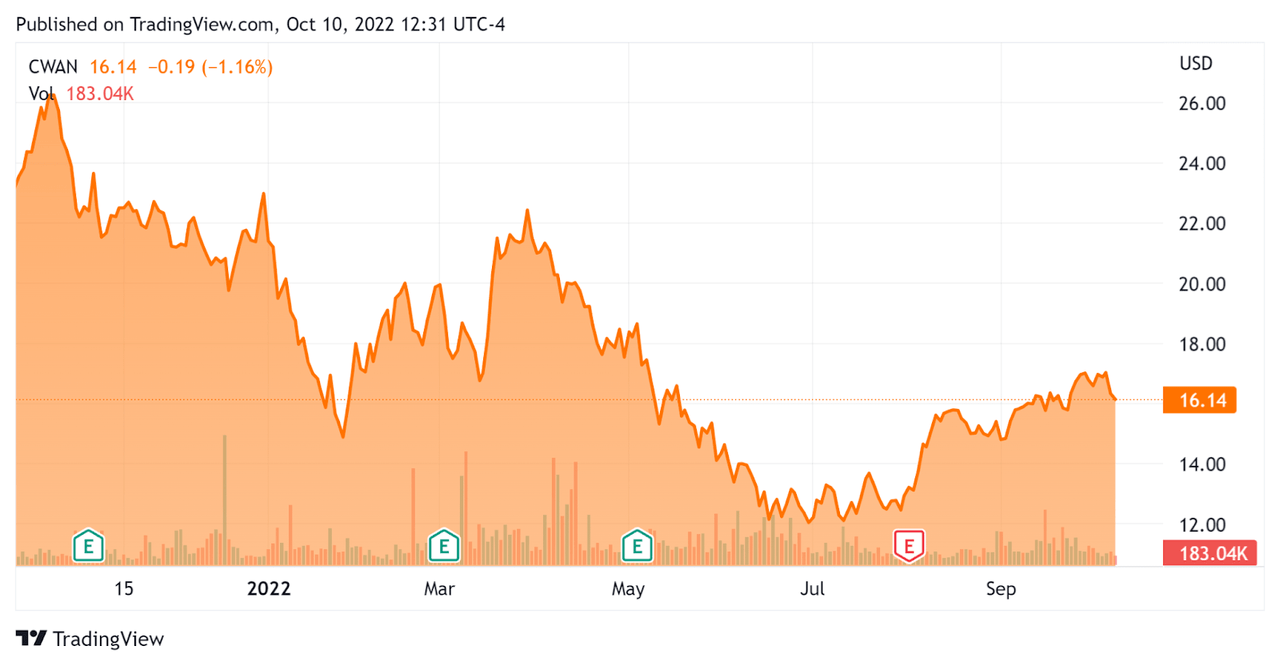
Valuation And Other Metrics For Clearwater Analytics
Below is a table of relevant capitalization and valuation figures for the company:
|
Measure (TTM) |
Amount |
|
Enterprise Value/Sales |
10.50 |
|
Revenue Growth Rate |
23.3% |
|
Net Income Margin |
-4.8% |
|
GAAP EBITDA % |
5.2% |
|
Market Capitalization |
$3,880,000,000 |
|
Enterprise Value |
$2,920,000,000 |
|
Operating Cash Flow |
$44,880,000 |
|
Earnings Per Share (Fully Diluted) |
-$0.05 |
(Source – Seeking Alpha)
The Rule of 40 is a software industry rule of thumb that says that as long as the combined revenue growth rate and EBITDA percentage rate equal or exceed 40%, the firm is on an acceptable growth/EBITDA trajectory.
CWAN’s most recent GAAP Rule of 40 calculation was 28.5% as of Q2 2022, so the firm needs some improvement in this regard, per the table below:
|
Rule of 40 – GAAP |
Calculation |
|
Recent Rev. Growth % |
23.3% |
|
GAAP EBITDA % |
5.2% |
|
Total |
28.5% |
(Source – Seeking Alpha)
Commentary On Clearwater Analytics
In its last earnings call (Source – Seeking Alpha), covering Q2 2022’s results, management noted that its AUM-based revenue model has come under pressure during recent periods of decreasing asset values in the markets in which its customers operate.
In response, the firm has instituted a ‘fixed annual fee’ for its core platform that is based on the ‘size and complexity of the clients’ portfolio.’
Management believes this revenue model change will reduce volatility in its revenue growth trajectory and provide ‘a more predictable NRR (Net Revenue Retention) metric.’
As to its financial results, total revenue rose 21% year-over-year with bookings the highest in corporate history.
The company’s net dollar retention rate dropped from 107% to 104%, due to a decrease in AUM values as a result of its aforementioned pricing structure which is now undergoing a change.
The firm’s Rule of 40 results have been in need of some improvement. Gross margin was 75.7% while adjusted EBITDA margin was 26%.
SG&A expenses as a percentage of total revenue rose year-over-year, in part due to additional public company expenses, and earnings per share dropped into negative territory.
For the balance sheet, the firm finished the quarter with $281.6 million in cash equivalents and short-term investments and $49.8 million in long-term debt.
Over the trailing twelve months, free cash was $38.1 million, of which $6.8 was used for CapEx.
Looking ahead, management lowered its full year revenue guidance to around 19% year-over-year growth at the midpoint of the range while adjusted EBITDA is expected to be approximately $80 million at the midpoint.
Stock-based compensation over the past 12 months was $57.2 million.
Regarding valuation, the market is valuing CWAN at an EV/Sales multiple of around 10.5x.
The SaaS Capital Index of publicly held SaaS software companies showed an average forward EV/Revenue multiple of around 6.9x at September 30, 2022, as the chart shows here:
SaaS Capital Index (SaaS Capital)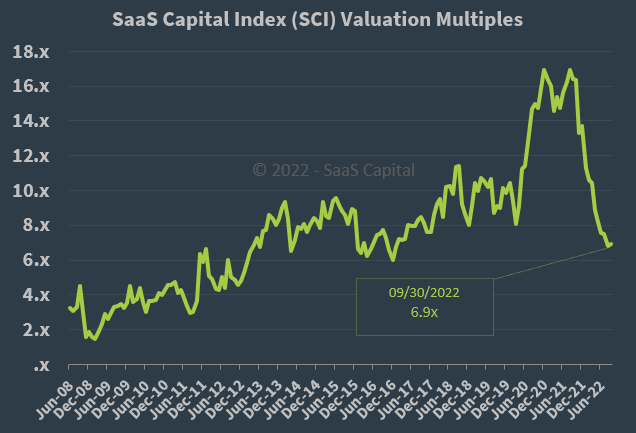
So, by comparison, CWAN is currently valued by the market at a significant premium to the broader SaaS Capital Index, at least as of September 30, 2022.
The primary risk to the company’s outlook is an increasingly likely macroeconomic slowdown or recession, which may slow sales cycles and reduce its revenue growth trajectory.
Potential upside catalysts to the stock could include a ‘short and shallow’ downturn or a pause in U.S. interest rate rises leading to a rallying stock market and increasing its AUM-based revenue results.
I’m not optimistic about the U.S. stock market in the face of rising interest rates and increasing cost of capital.
Although CWAN is essentially at operating and EPS breakeven, its stock isn’t cheap compared to a broader SaaS index, and the company’s growth rate will likely face pressures in the period ahead.
I’m, therefore, on Hold for CWAN in the near term.
Be the first to comment