

imaginima
Introduction
The Oklahoma City-based Devon Energy Corp. (NYSE:DVN) reported third-quarter earnings on November 1, 2022.
Also, on November 8, 2022, Devon Energy released its 2022 Sustainability Report.
2022 sustainability report which highlights the company’s efforts to deliver industry-leading results while being a responsible environmental steward, committed advocate for safety, reliable producer, valued and effective community partner, and supportive employer.
Important note: This article is an update of my preceding article, published on September 9, 2022. I have followed DVN on Seeking Alpha since 2017, with 7 articles published and counting.
Devon Energy is a pure E&P domestic player.
DVN Assets Map (DVN Presentation)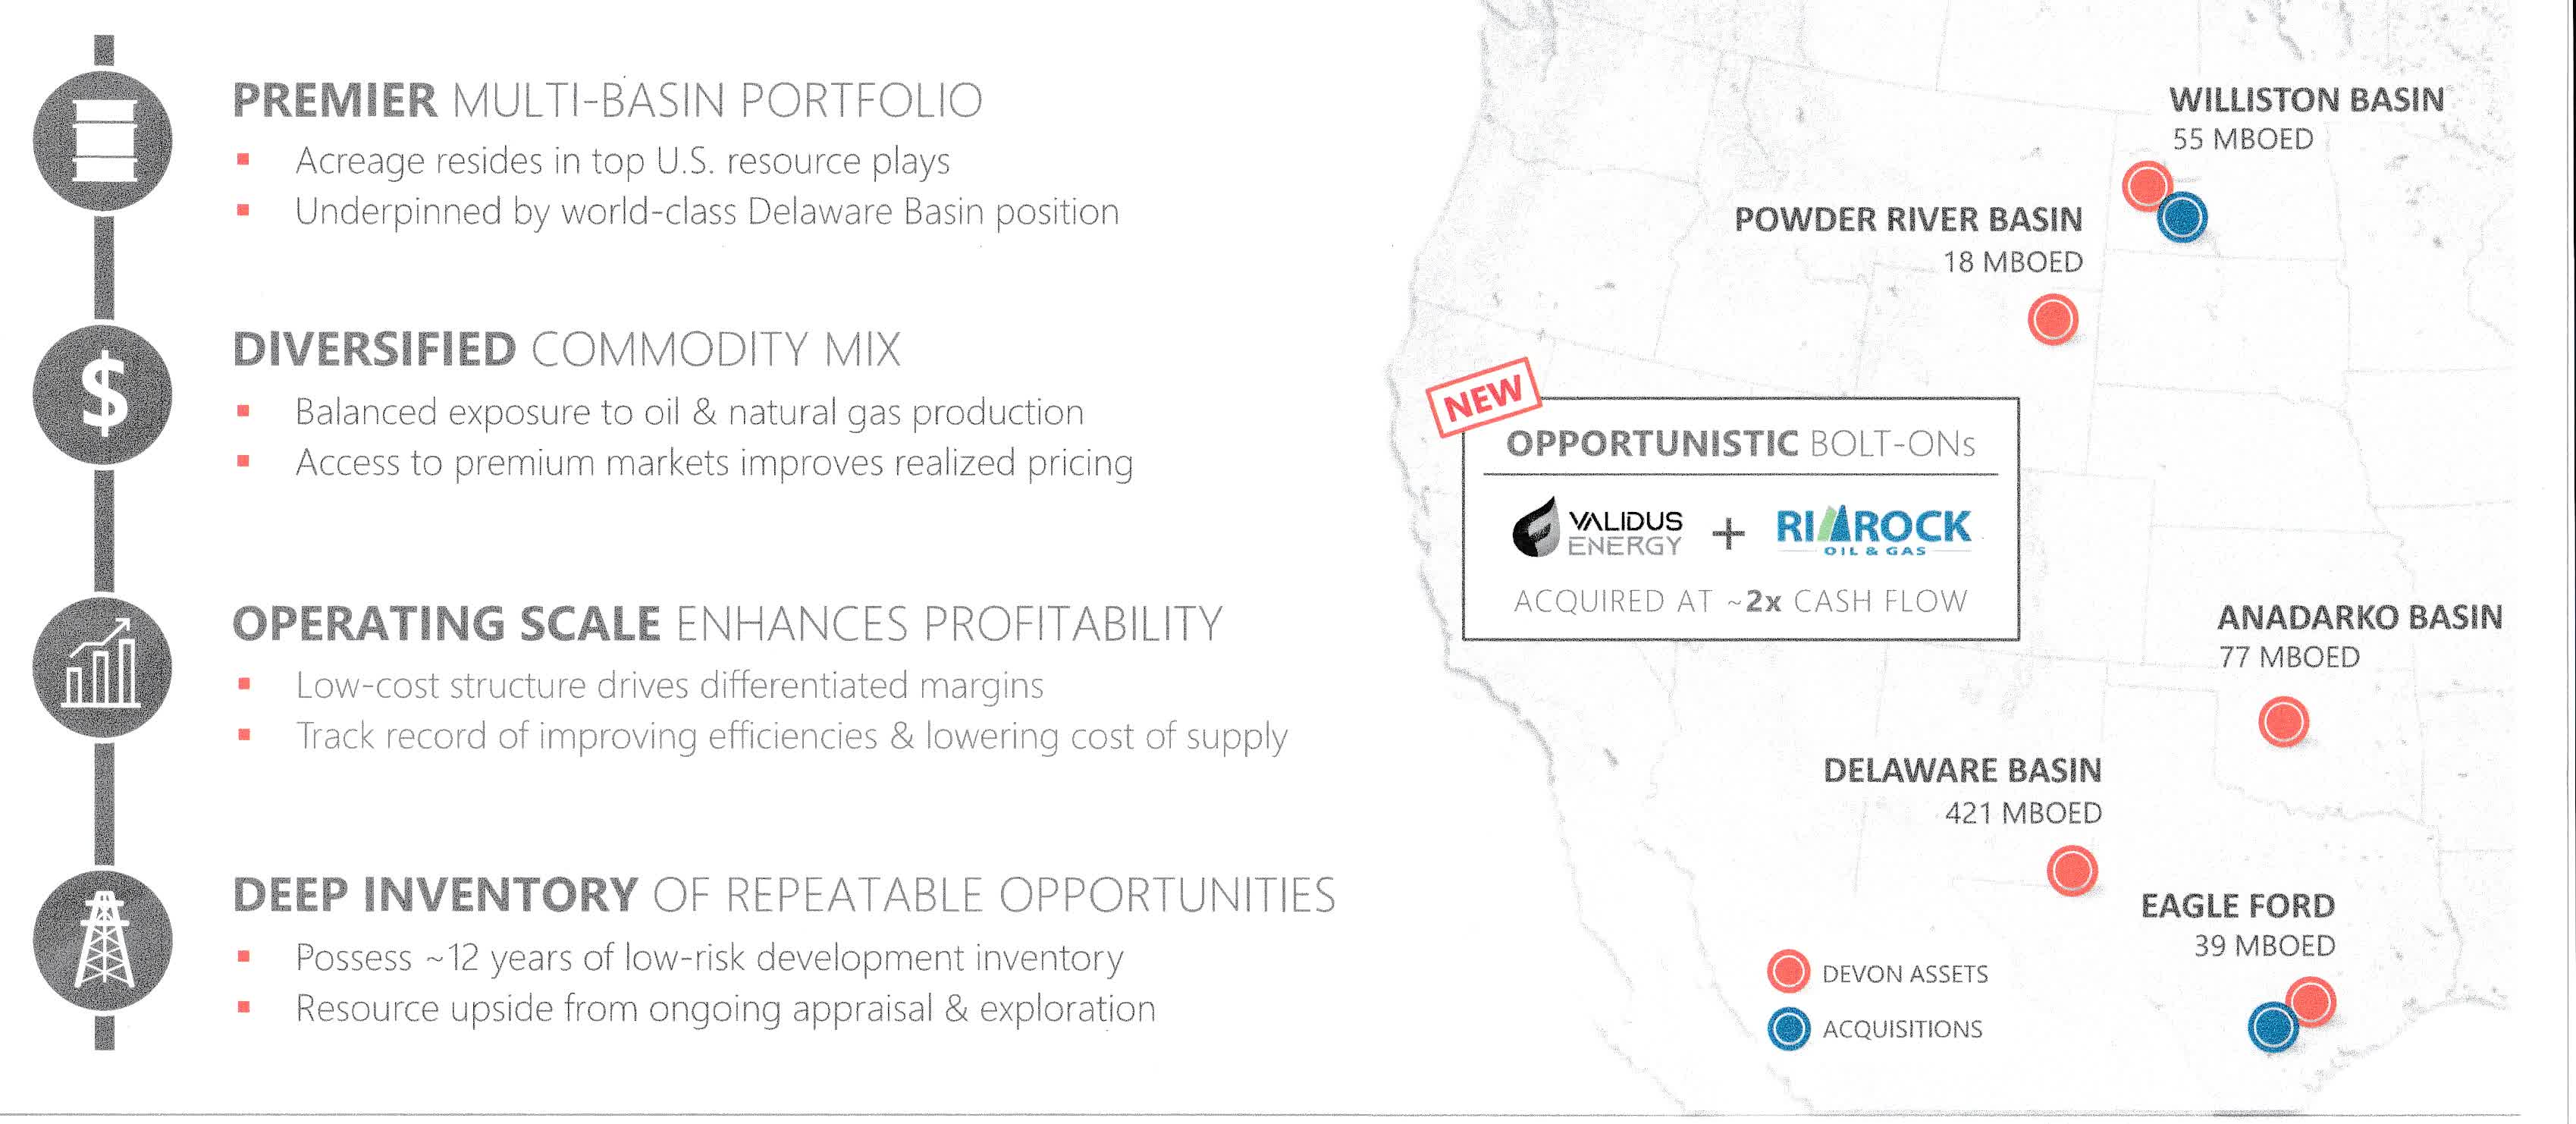
1 – 3Q22 results Snapshot
Devon Energy announced better-than-expected adjusted earnings of $2.18. GAAP earnings for the third quarter were $2.88 compared to $1.24 per share in the year-ago period.
The total revenues were $5,432 million, significantly higher than the same quarter a year ago ($3,466 million). The merger with WPX Energy has especially lifted results since January. The acquisition was completed on September 28, 2022.
The third-quarter production of 614.7K Boep/d is up from 608K Boep/d in 3Q21. Oil production averaged 294K Boep/d. The increase was due to solid contributions from Delaware Basin assets.
CEO Richard Muncrief said in the conference call:
…the third quarter was another high-quality performance that demonstrated the flexibility of our strategy to create value in multiple ways. The team’s disciplined execution of our operating plan advanced earnings and cash flow by healthy double-digit rates on a year-over-year basis. Free cash flow was bouldered by capital efficiencies and effective supply chain management that drove capital spending below forecast.
DVN 3Q22 performance (DVN Presentation)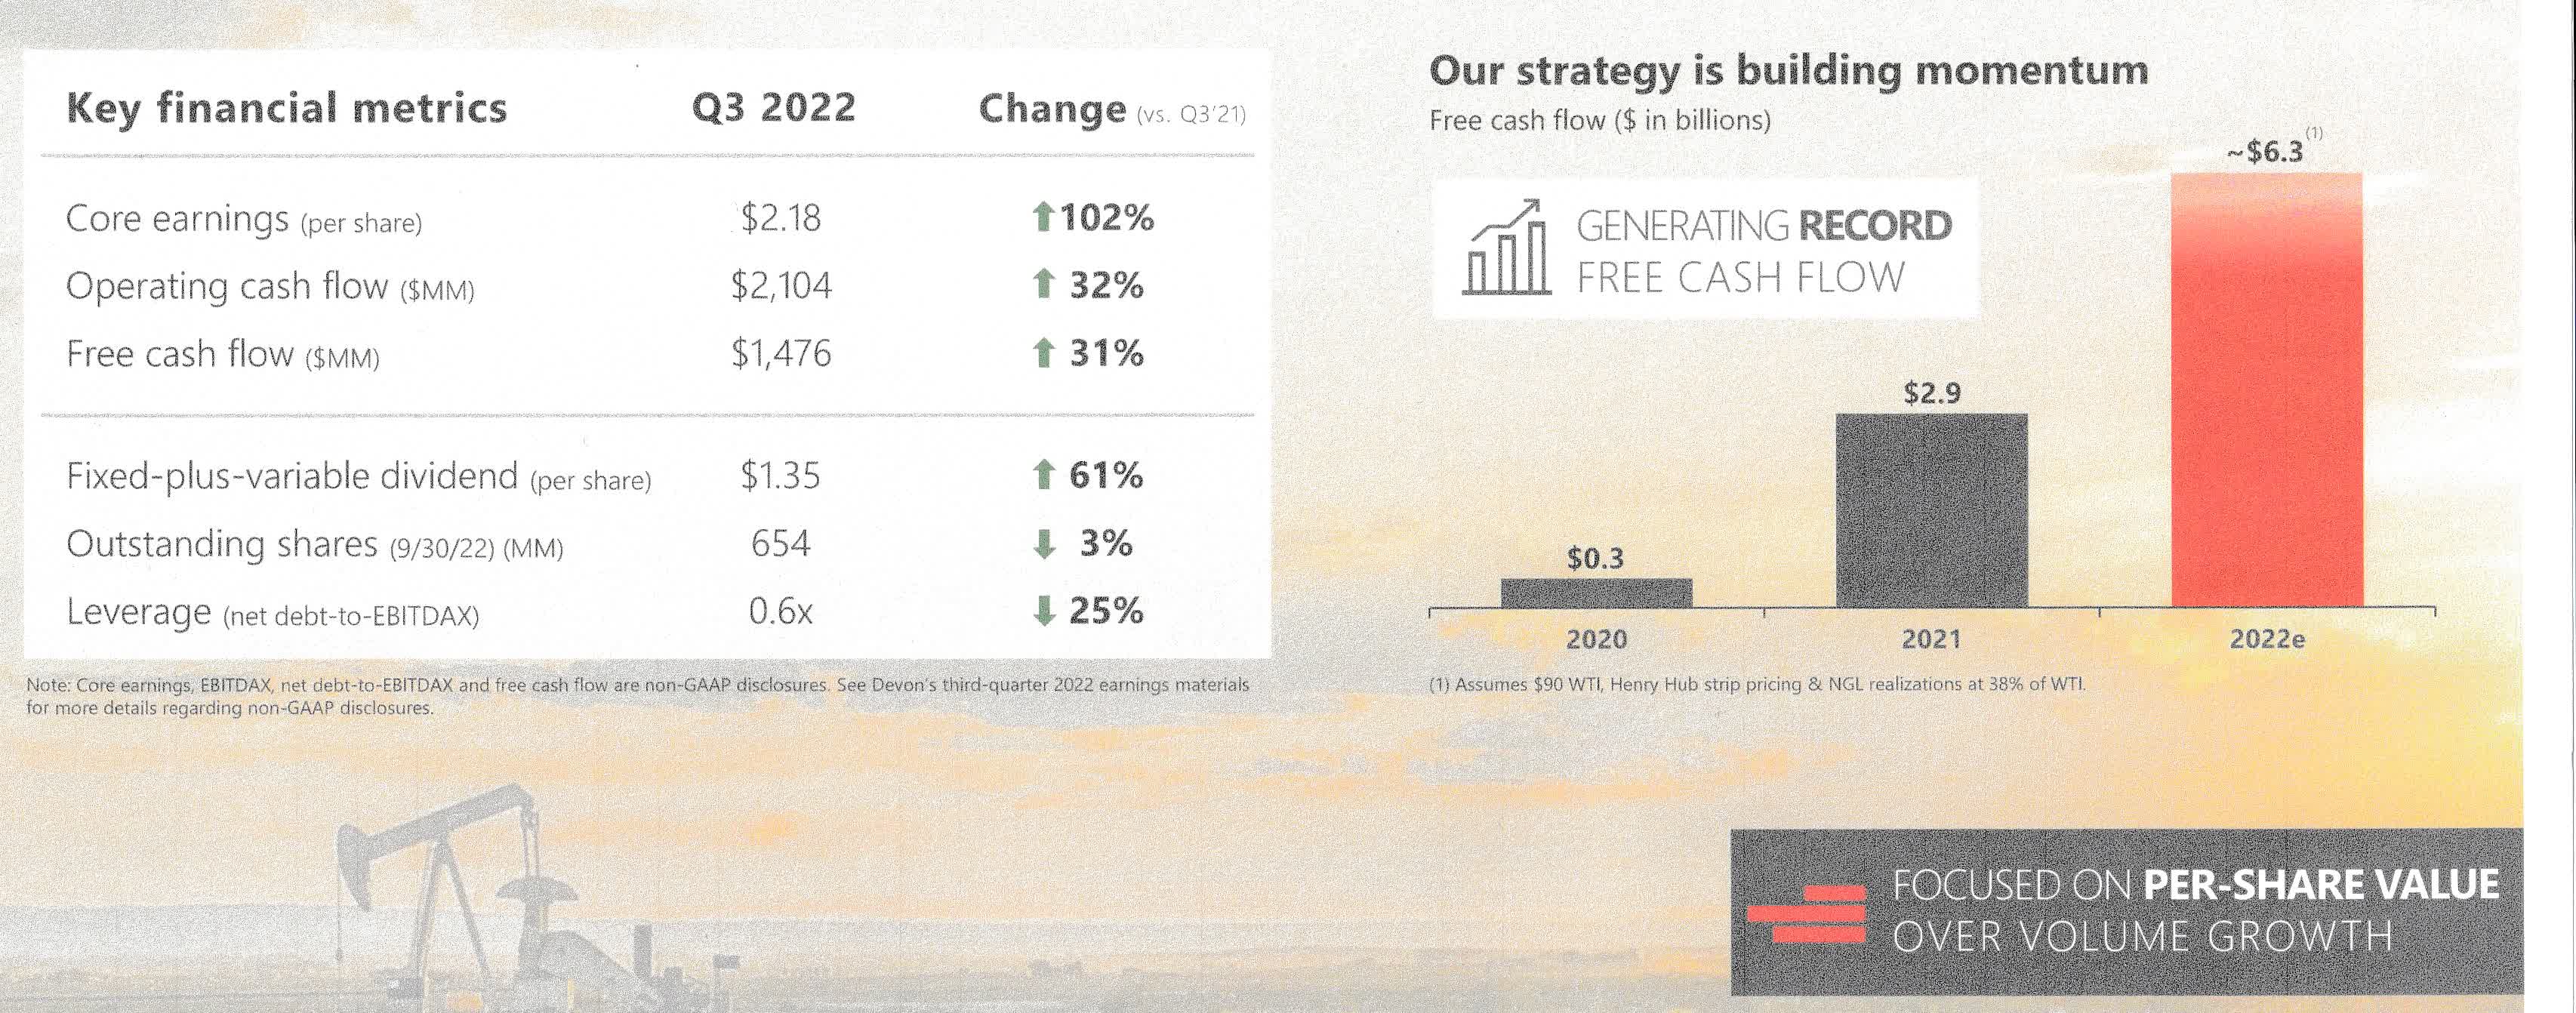
2 – Investment Thesis
The investment thesis has not changed since my preceding article, and I recommend DVN as a long-term opportunity to accumulate on weakness. It is especially true right now.
On a side note, the dividend policy is generous for long-term investors and reached a solid level in 3Q22 with a total quarterly dividend of $1.35 per share.
However, I anticipate a significantly lower dividend in the fourth quarter due to the rapid oil prices deterioration weakened by the Fed policy threatening the US economy and demand for oil. US crude oil tumbled to $77 today…
…as data showing a stronger than expected rise in U.S. service sector conditions amplified concerns that the Federal Reserve would continue its policy of aggressive interest rate increases.
Hence, I recommend allocating 35% to 45% of your position to short-term trading LIFO using technical analysis. Again, I do not recommend selling off your position and believe it is not a good idea.
This strategy protects you against sudden changes in the oil sector, lets you keep a core long-term position for much higher prices, and enjoy a sizeable and secure dividend.
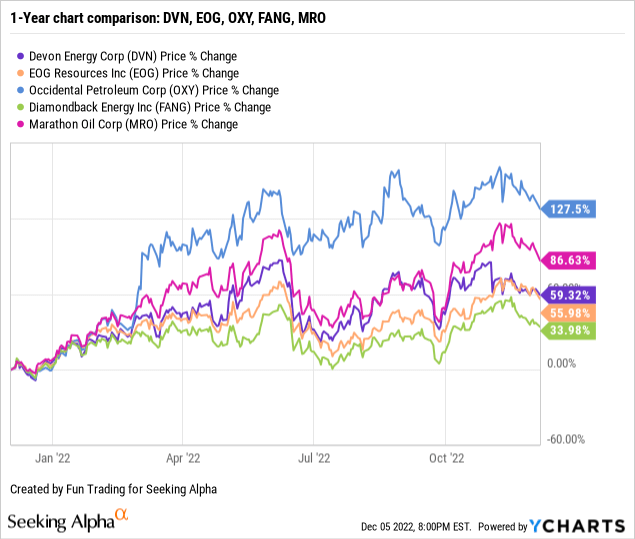
3 – Stock Performance
DVN’s performance is similar to most of its peers, put aside Occidental (OXY) boosted by Buffett, and is up 59% on a one-year basis.
Devon Energy Balance Sheet 3Q22: The Raw Numbers
Note: Total revenues include oil/gas and NGL sales, oil/gas and NGL derivatives, and marketing and midstream revenues.
| DVN (including WPX Energy) | 3Q21 | 4Q21 | 1Q22 | 2Q22 | 3Q22 |
| Oil and Gas Revenue in $ Million | 2,635 | 2,985 | 3,175 | 4,100 | 3,668 |
| Total Revenues incl. derivatives, midstream + others in $ Million | 3,466 | 4,273 | 3,812 | 5,626 | 5,432 |
| Net income in $ Million | 838 | 1,506 | 989 | 1,932 | 1,893 |
| EBITDA in $ Million | 1,635 | 2,331 | 1,843 | 3,116 | 3,138 |
| EPS diluted in $/share | 1.24 | 2.23 | 1.48 | 2,93 | 2.88 |
| Cash from operations in $ Million | 1,598 | 1,616 | 1,837 | 2,678 | 2,104 |
| Capital Expenditure in $ Million | 484 | 515 | 538 | 673 | 3,093 |
| Free Cash Flow in $ Million | 1,114 | 1,101 | 1,299 | 2,005 | -989 |
| Cash and cash equivalent $ Million | 2,321 | 2,111 | 2,475 | 3,317 | 1,185 |
| Total debt in $ Million | 6,492 | 6,482 | 6,471 | 6,461 | 6,451 |
| Dividend per share in $ | 0.84 | 1.00 | 1.27 | 1.55 | 1.35 |
| Share outstanding in millions | 673 | 662 | 658 | 654 | 651 |
| Liquids and NG Production | 3Q21 | 4Q21 | 1Q22 | 2Q22 | 3Q22 |
| Oil Equivalent Production in KBoepd | 608 | 611 | 575 | 616 | 614 |
| Price per Boe (composite) incl., including cash settlement | 40.48 | 44.34 | 54.75 | 64.70 | 58.48 |
| Price per Mcf | 2.77 | 3.26 | 3.15 | 5.06 | 5.83 |
Source: Devon Energy supplement filing and Fun Trading Analysis.
Trends, Charts, and Commentary: Revenues, Free Cash Flow, and Upstream Production
1 – Quarterly revenues: Revenues of $5,432 million in 3Q22
DVN Quarterly revenues history (Fun Trading)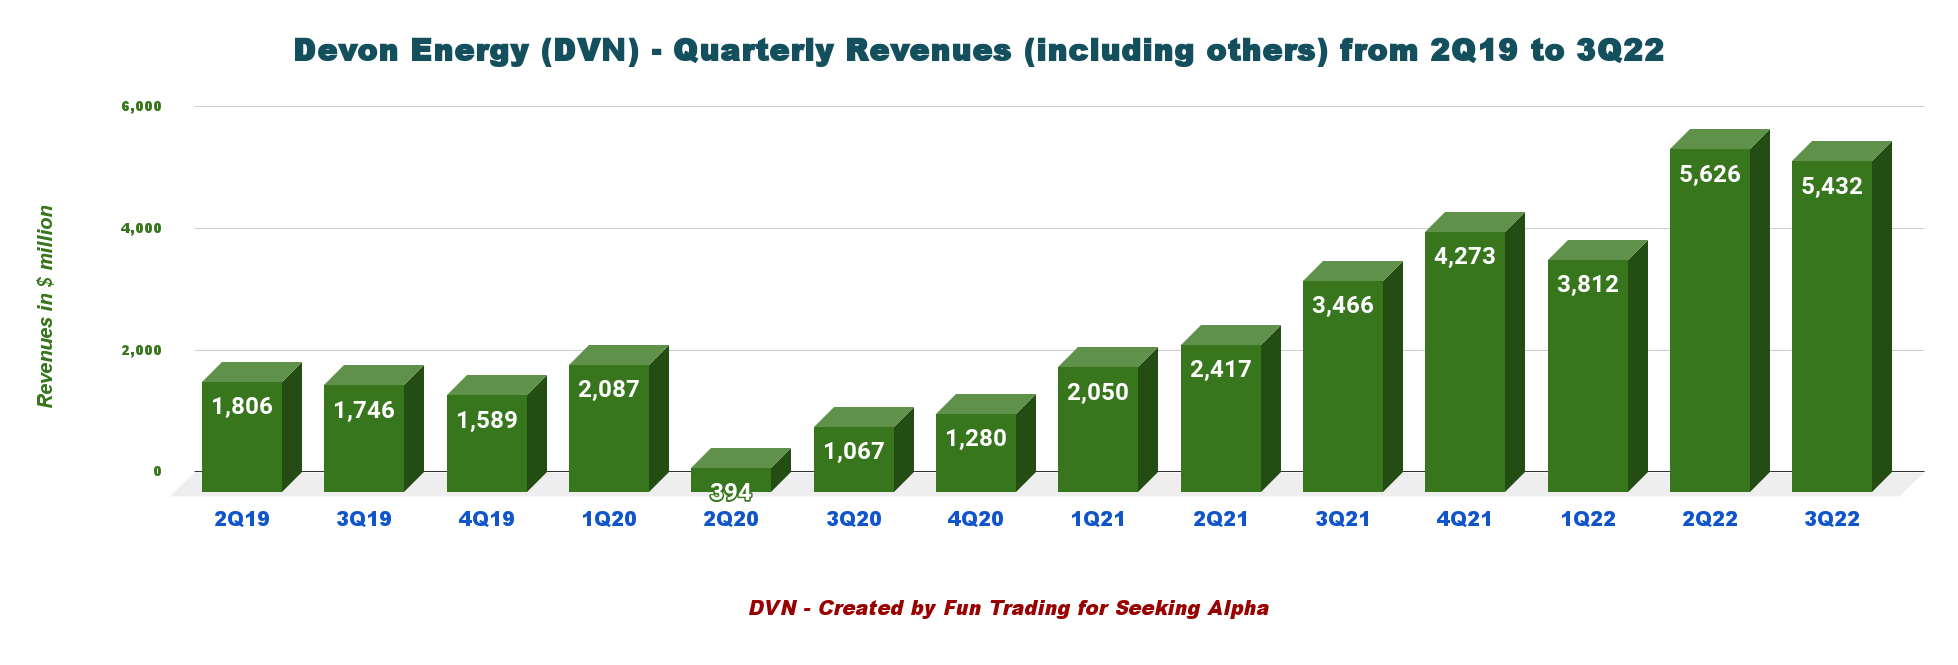
Devon Energy posted total revenue of $5,432 million in the third quarter of 2022, significantly higher than the $3,466 million posted in 3Q21. For more data, please look at the table above.
The net income for 3Q22 was $1,893 million, up from $838 million last year.
Operating cash flow of $2,104 million against $1,598 million last year.
The total production expenses for the third quarter were $2,967 million, from $2,502 million in 3Q21.
During the third quarter, Devon Energy closed the Williston Basin and Eagle Ford acquisition for $2.5 billion. Fourth-quarter production volume will increase by 35K Boep/d from the company’s Eagle Ford acquisition.
2 – Free cash flow was a loss of $989 million in 3Q22
DVN Quarterly Free cash flow history (Fun Trading)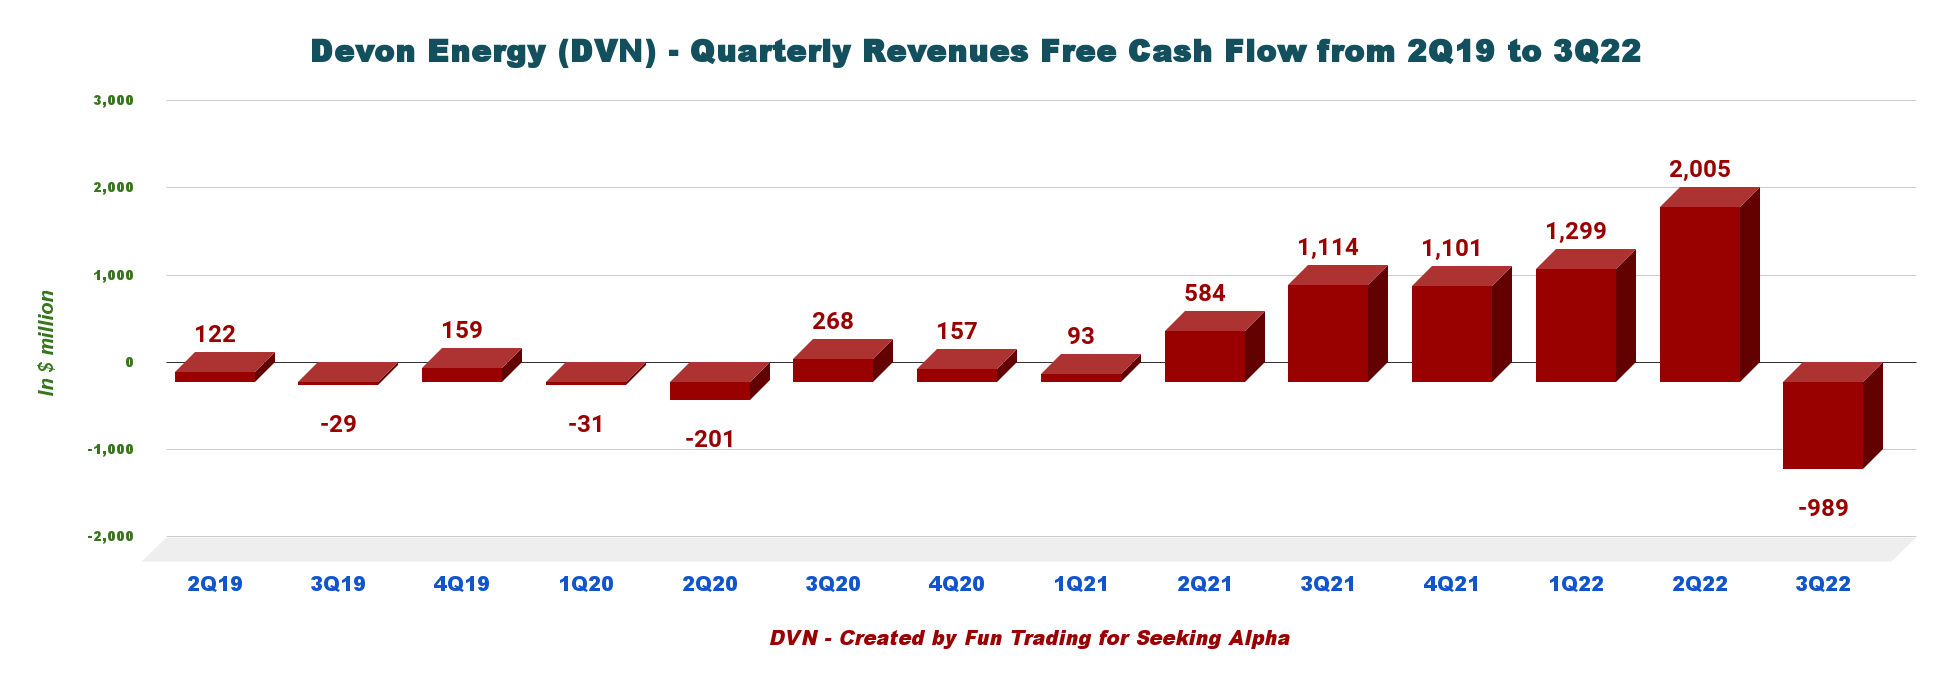
Note: The generic free cash flow is the cash from operations minus CapEx.
Trailing 12-month free cash flow was $3,416 million and a loss of $989 million for 3Q22. CapEx was $3,093 million this quarter due to the merger with WPX Energy.
The Fixed-plus-variable dividend increased 61% year over year to $1.35 per share. However, it is down from $1.55 per share in 2Q22. Furthermore, the share-repurchase program is on track to lower the share count by 5%.
The company is paying a variable dividend now based on free cash flow. The dividend consists of two parts:
- A fixed quarterly dividend of $0.18 per share.
- A variable payment ($1.17) based on excess free cash flow multiplied by a payout ratio determined by the board as high as 50%.
The yield is now 7.8%, which is still very high for such an E&P operator, and I expect a lower dividend in 4Q22.
DVN Free cash flow priority (DVN Presentation)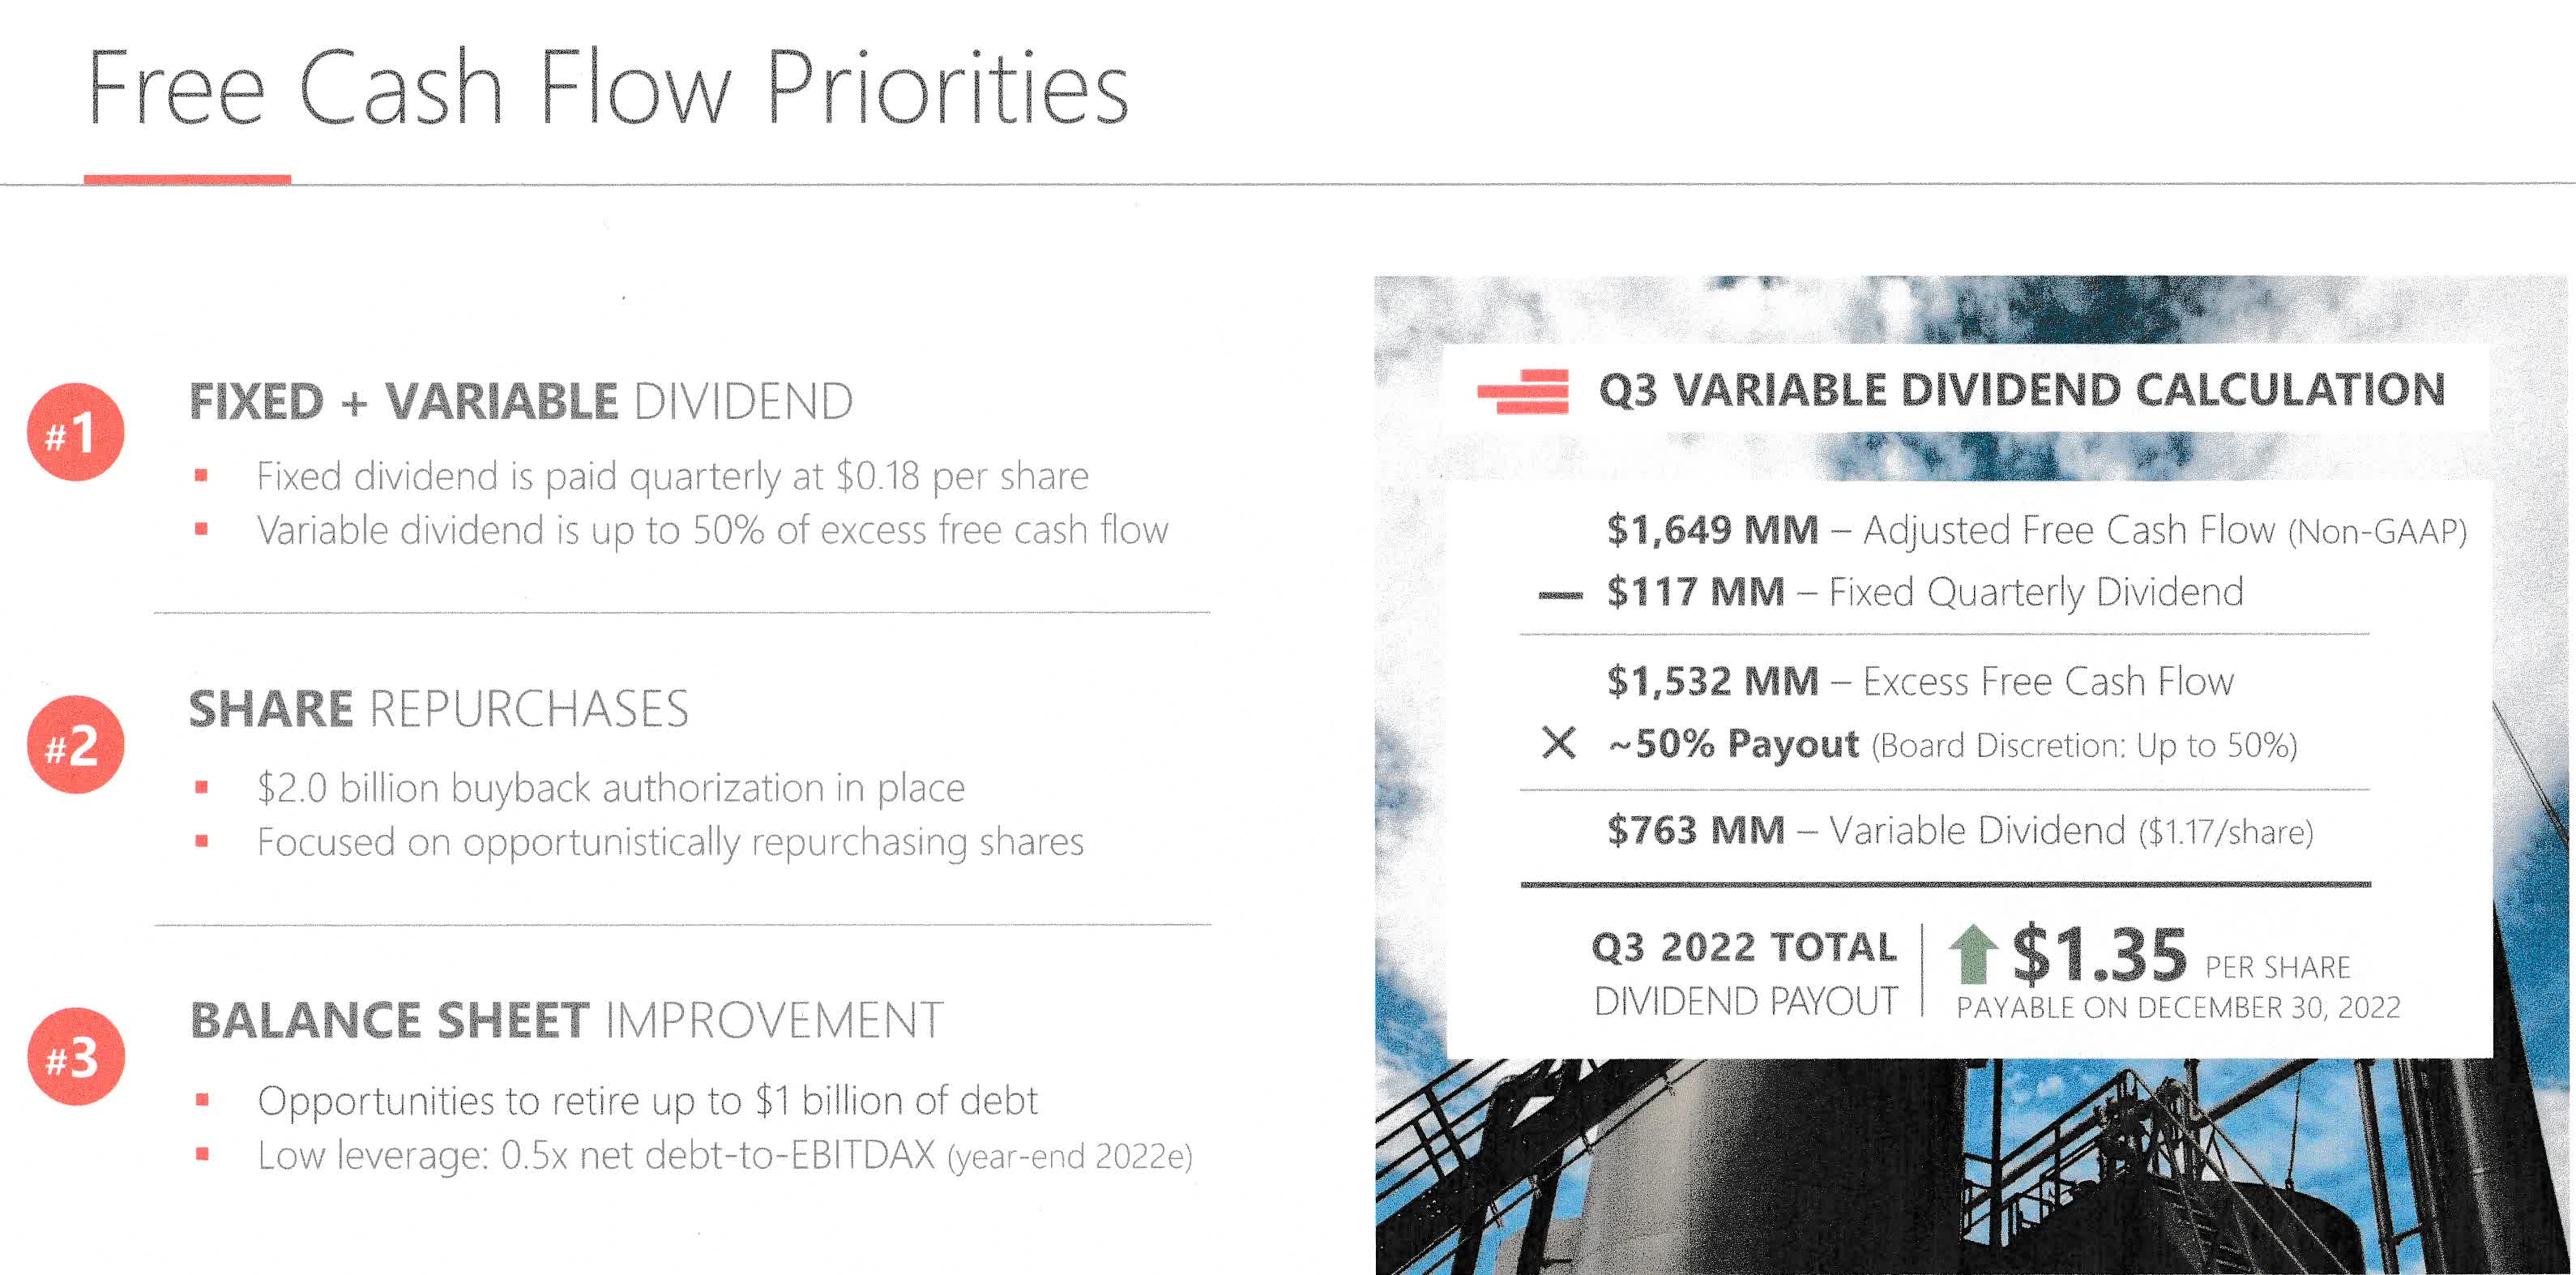
3 – Quarterly Production: Production was 614.7K Boep/d in 3Q22
DVN Quarterly oil equivalent production history (Fun Trading)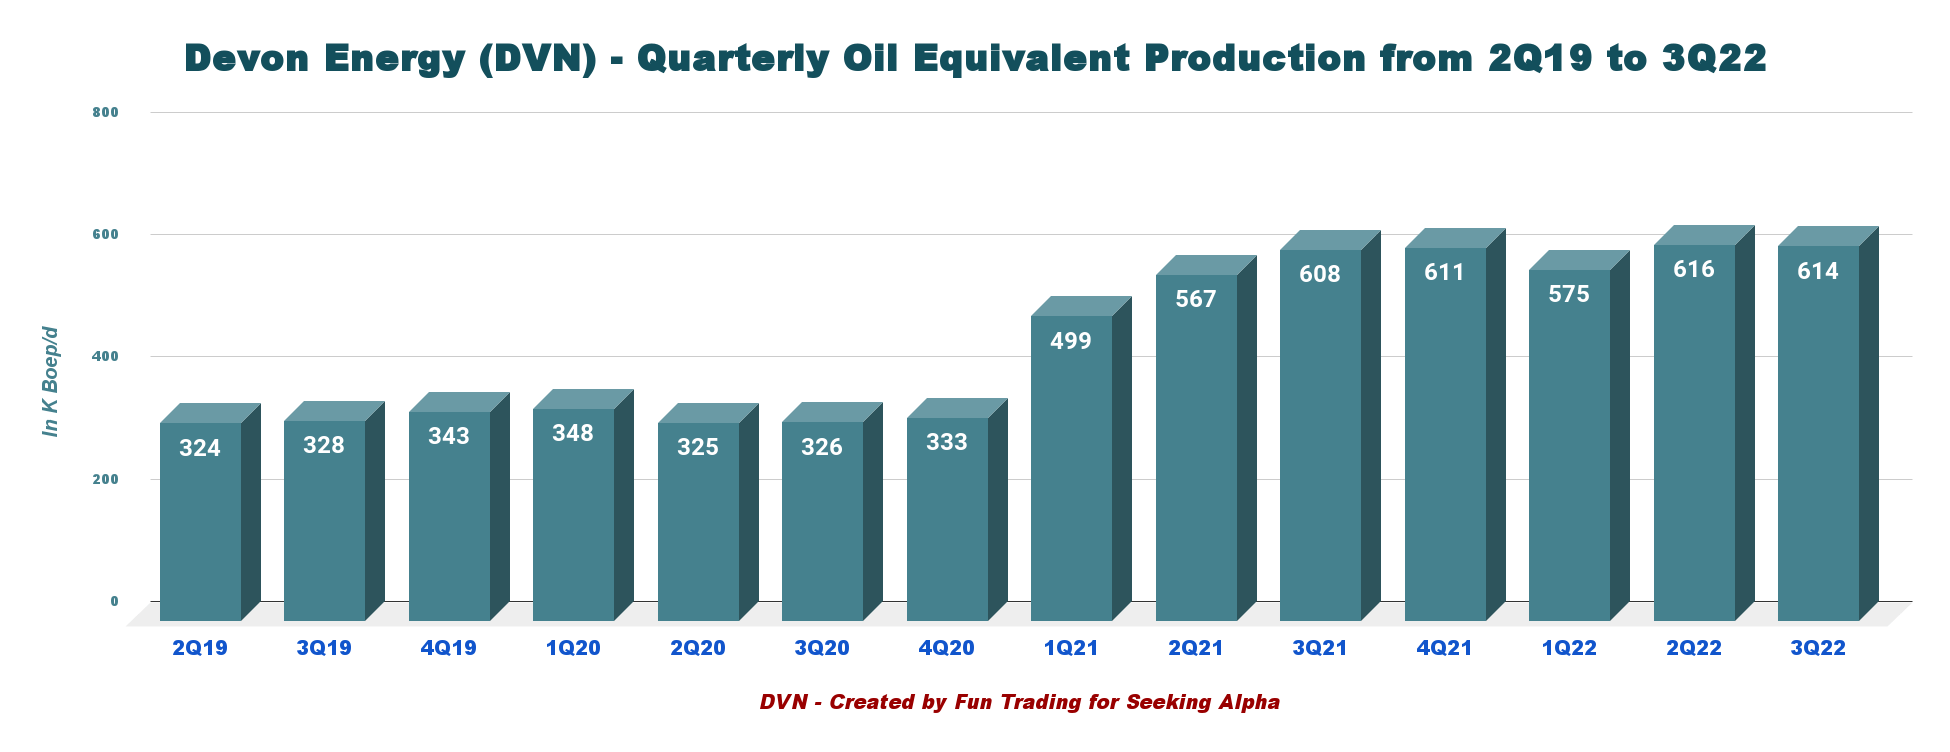
Devon Energy produced a record of 614.7K Boep/d in the third quarter, or 1.1% higher than the 3Q21.
Third-quarter production surpassed the company’s guidance of 593K-613K Boep/d. Total production for the quarter was driven by high-margin production growth in the Delaware Basin.
US Production repartition for the five prominent locations are as follows:
DVN Quarterly Production per basin (Fun Trading)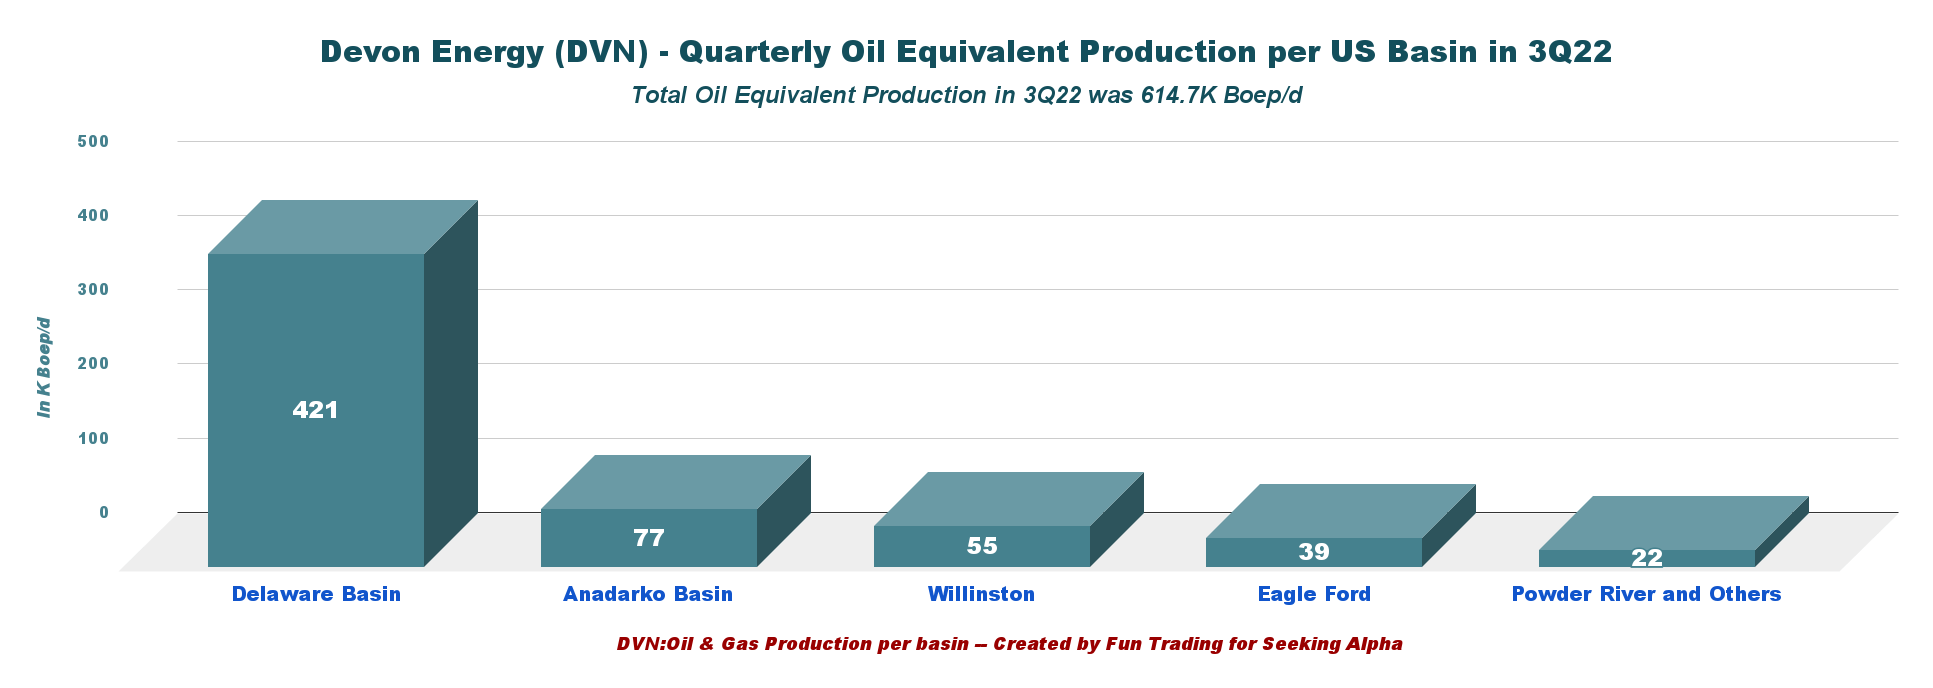
The Delaware Basin is the number one producing asset for Devon Energy, representing 68.5% of the total production. Liquids represented 74.1% of the total output.
DVN Quarterly Oil, NGL, NG production in 3Q22 (Fun Trading)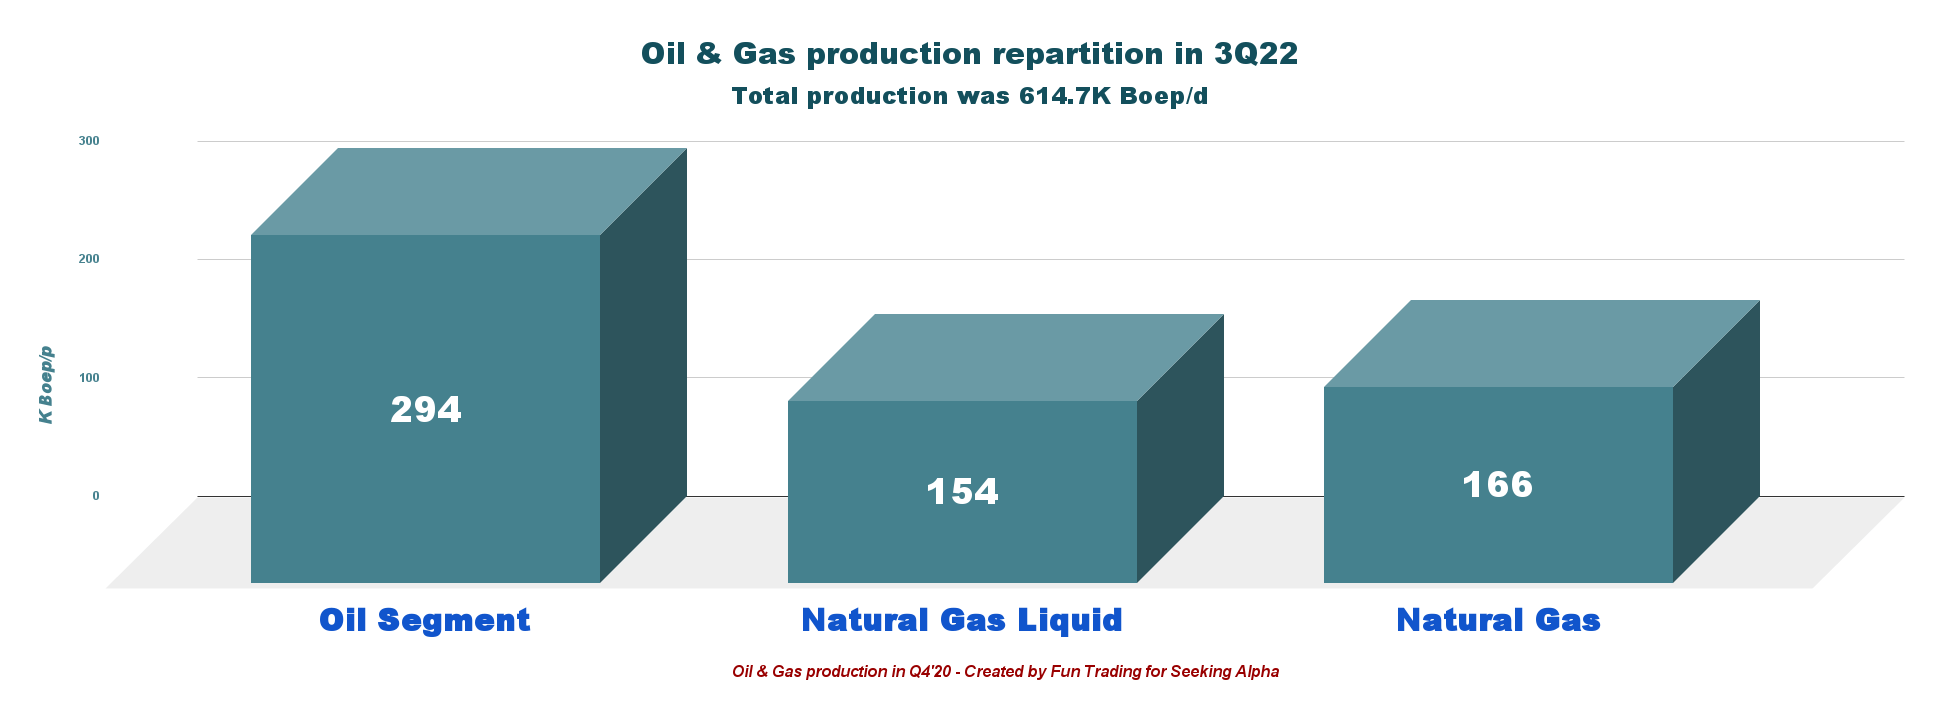
Total oil equivalent realized prices, including cash settlements, were $58.48 per Boe, and NG was $5.83 per Mcf. Below are the historical prices realized for Boe and NG.
DVN Oil and NG Prices history (Fun Trading)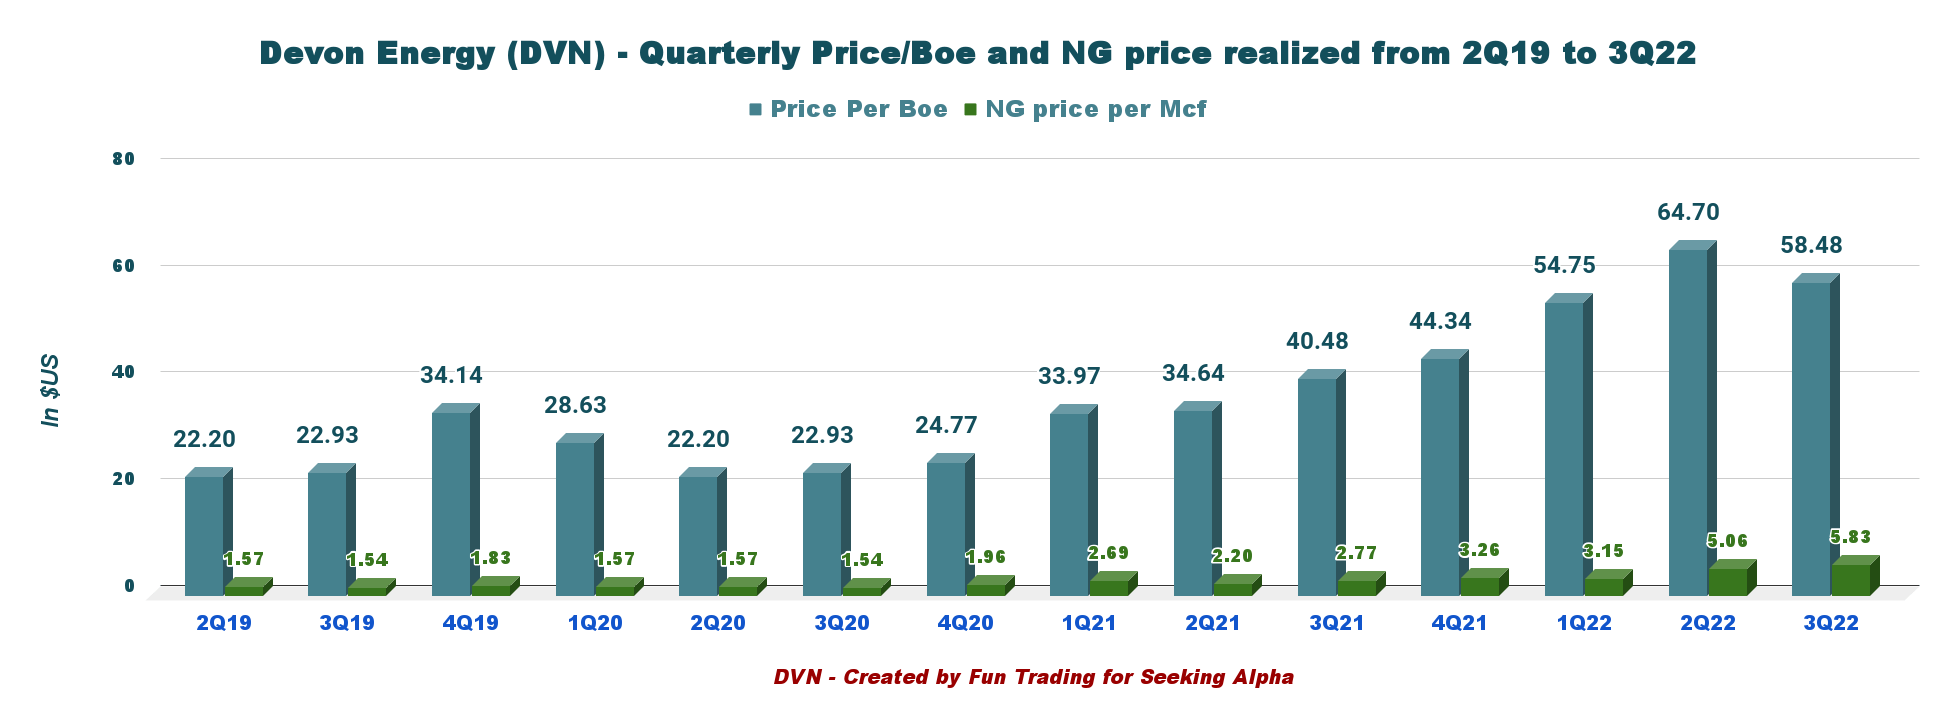
- Realized oil prices for the second quarter were $84.38 per barrel from $57.59 in the year-ago period.
- Realized prices for natural gas liquids were up to $34.44 per barrel from $30.80 in the prior-year quarter.
- Realized gas prices were up to $5.83 per thousand cubic feet from $2.77 in the prior-year quarter.
4 – 2022 Guidance
Devon Energy forecasts total production of 640K-660K Boep/d for the fourth quarter with the accretive acquisitions of Williston Basin and Eagle Ford. The fourth quarter’s output is expected to be 6% YoY.
Fourth-quarter capital expenditure is projected to be $845-$915 million.
5 – Debt situation, liquidity: No worry on this side
DVN Quarterly Cash versus Debt history (Fun Trading)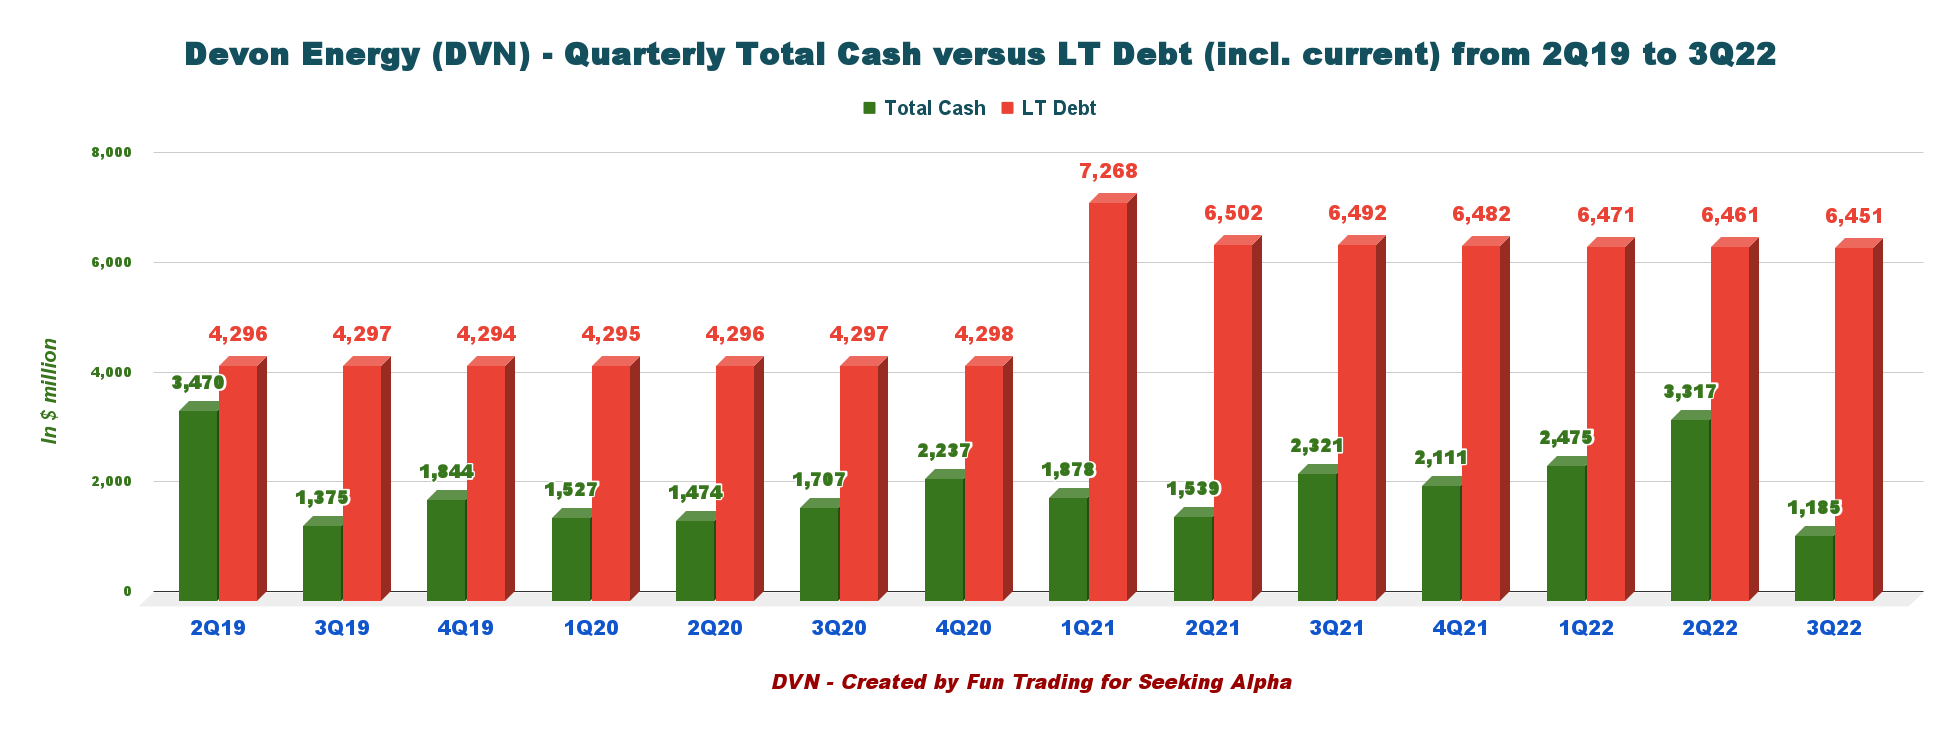
As of September 30, 2021, the company had cash and cash equivalents, including restricted cash, of $1,185 million, up from $2,321 million on September 30, 2021.
Devon Energy exited the third quarter with $4.3 billion of liquidity and no debt maturities till 2023. About 60% of the outstanding debt obligations mature after 2030. The company reduced debt by over $1.2 billion since the close of the Williston Basin and Eagle Ford acquisitions.
Long-term debt amounted to $6,451 million, up from $6,482 million on December 31, 2021.
Devon Energy’s net cash from operating activities for the third quarter of 2022 was $2,104 million compared with $1,598 million in the year-ago period.
The net debt is now $3.14 billion, with a net debt-to-EBITDAX of 0.5x.
DVN Balance sheet (DVN Presentation)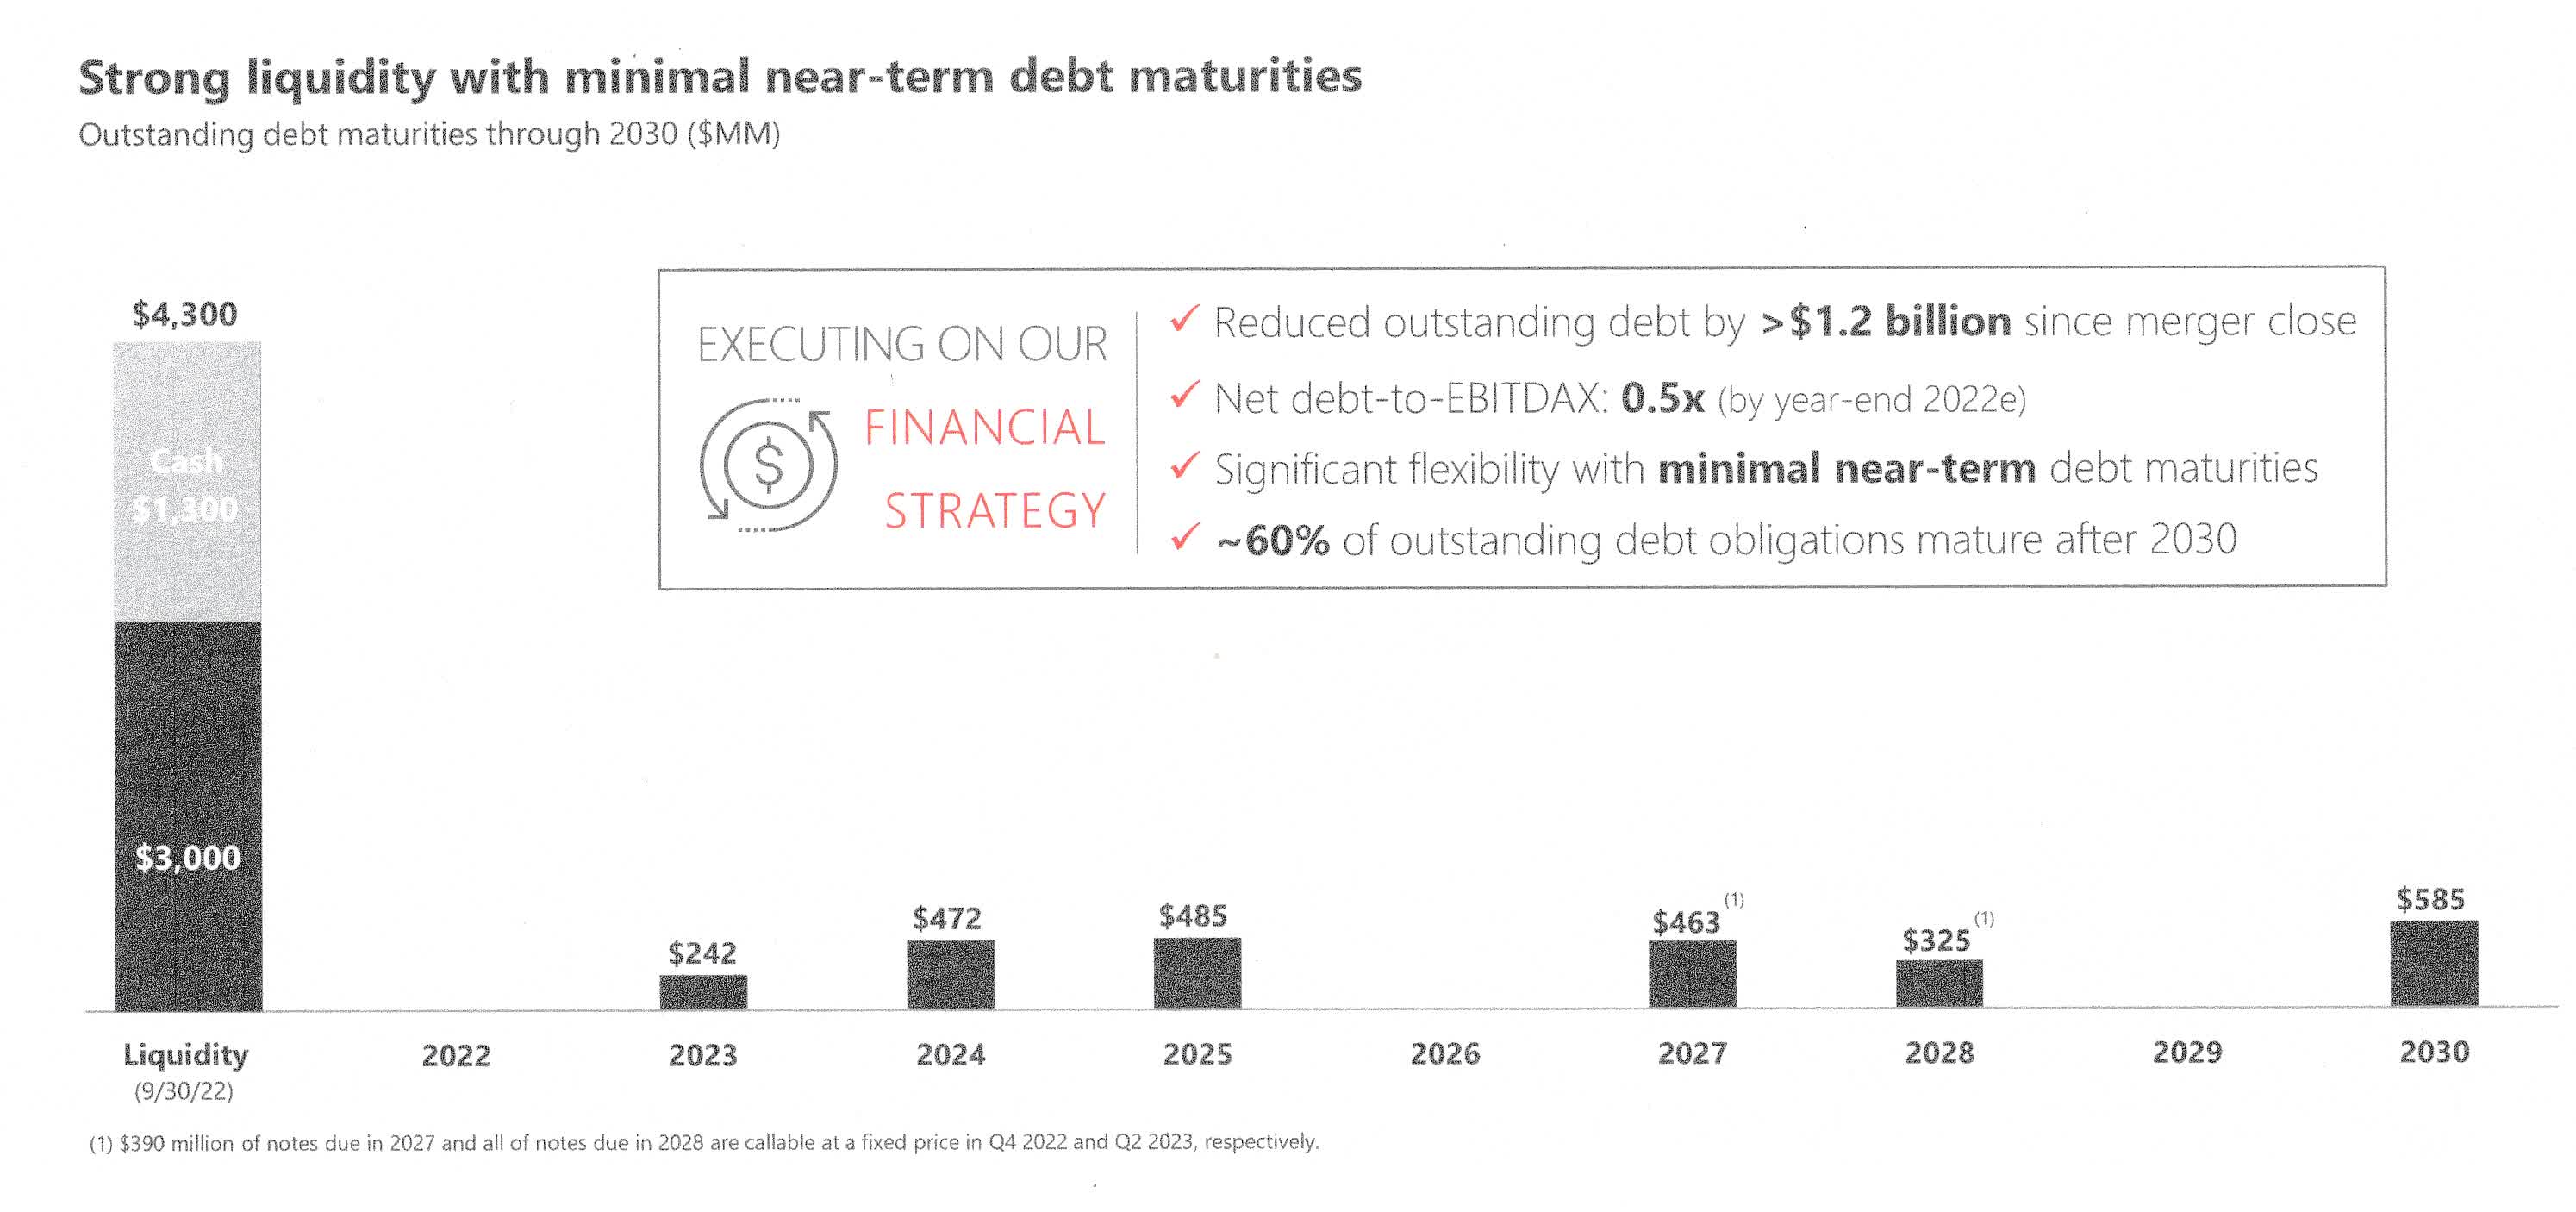
Technical Analysis and Commentary
DVN TA Chart short-term (Fun Trading StockCharts)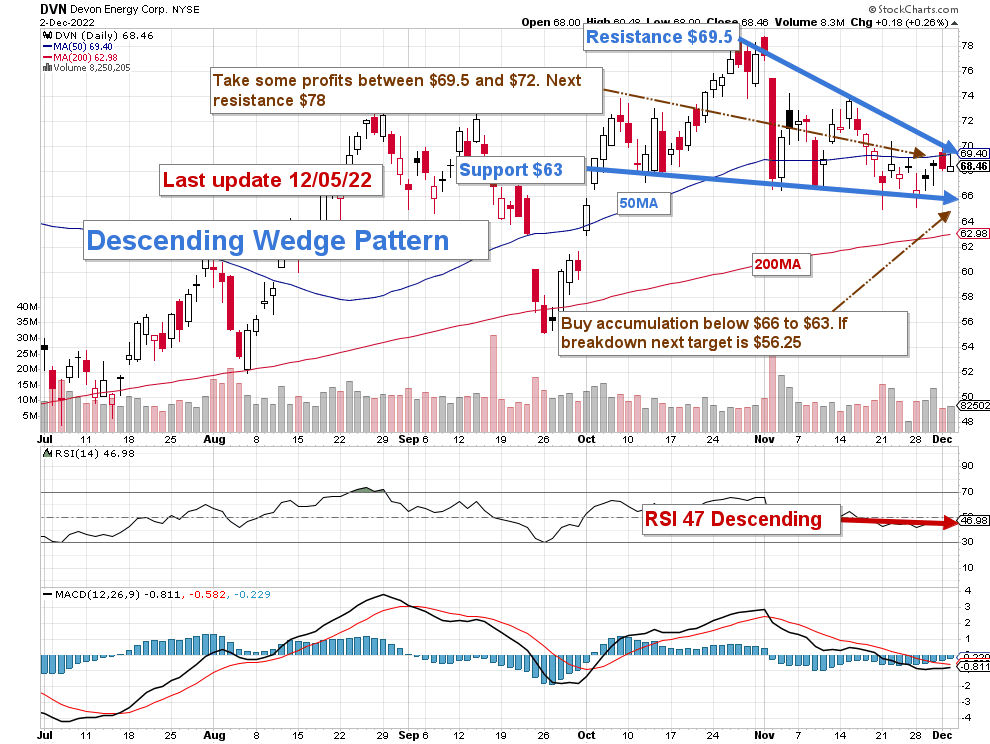
Note: The chart is adjusted from the dividend.
DVN forms a descending wedge pattern with resistance at $69.5 and support at $63. The descending wedge is a useful pattern that signals future bullish momentum. However, the RSI may indicate more downside before the bullish reversal can occur.
The short-term trading strategy is to trade LIFO about 35%-45% of your position and keep a core long-term position for a much higher payday. I suggest selling above $69.5 to $72 with higher resistance at $78 and/or waiting for a retracement between $66 and $63 with potential lower support at $56.25.
Above all, I do not recommend selling off your position but taking enough cash out to let you take full advantage of a possible retracement, which is more likely if we are heading to a recession in 2023.
Oil prices have dropped significantly since their peak in June and are showing no sign of support so far, while gas prices continue to be very volatile. Another reason to be cautious and trade a part of your position.
DVN Oil and gas prices 1-year (Fun Trading StockCharts)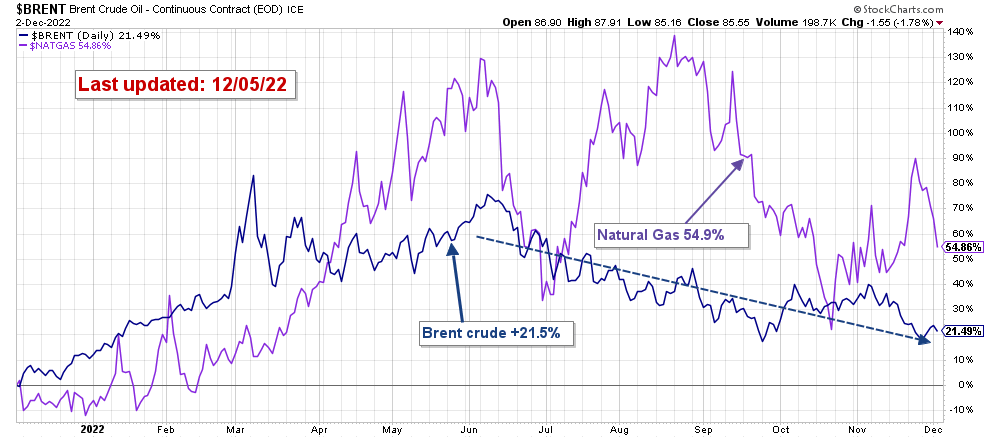
Warning: The TA chart must be updated frequently to be relevant. It is what I am doing in my stock tracker. The chart above has a possible validity of about a week. Remember, the TA chart is a tool only to help you adopt the right strategy. It is not a way to “know” the future. No one and nothing can.
Author’s note: If you find value in this article and would like to encourage such continued efforts, please click the “Like” button below as a vote of support. Thanks.
Be the first to comment