


master1305
Written by Nick Ackerman, co-produced by Stanford Chemist. This article was originally published to members of the CEF/ETF Income Laboratory on October 11th, 2022.
Calamos runs several closed-end funds, all with varying degrees of a convertible bond or preferred exposure. That leads to some overlap in their portfolios, but none seem more overlapped than Calamos Convertible and High Income Fund (NASDAQ:CHY) and Calamos Convertible Opportunities and Income Fund (NASDAQ:CHI).
Calamos labels both of these funds as U.S. Enhanced Fixed Income. They have heavy exposure to convertibles, but also, high-yield corporate bonds make up a fairly meaningful allocation. The similarities between these funds are quite extensive, as we will soon highlight.
CHY Basics
- 1-Year Z-score: -0.47
- Premium: 0.85%
- Distribution Yield: 11.18%
- Expense Ratio: 1.29%
- Leverage: 42.34%
- Managed Assets: $1.302 billion
- Structure: Perpetual
CHY “seeks total return through a combination of capital appreciation and current income.” They attempt to achieve this through “investing in a combination of convertibles and high yield bonds.” They highlight that it “provides an alternative to funds that invest exclusively in investment-grade fixed-income instruments, and it seeks to be less sensitive to interest rates by investing in lower duration asset classes.”
When including leverage expenses, the fund’s expense ratio comes to 2.01%. Higher interest rates will increase leverage expenses for both of these funds. CHY had $435.4 million outstanding in notes payable at the end of April 30th, 2022. They are charged at the Overnight Bank Financing Rate plus 0.80%. That was an average interest rate of 0.61% in that previous semi-annual report.
That being said, they also had another $181.5 million in leverage that comes from Mandatory Redeemable Preferred Shares with fixed dividends. $36.5 million of this passed the term redemption date of September 6th, 2022.
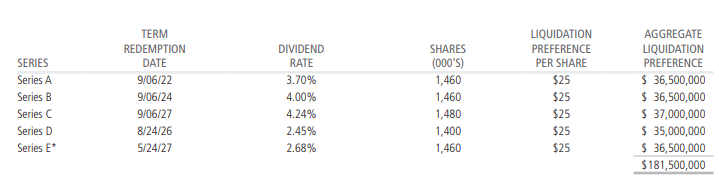
CHY Preferred Leverage (Calamos)
CHI Basics
- 1-Year Z-score: -0.83
- Discount: -0.40%
- Distribution Yield: 11.32%
- Expense Ratio: 1.29%
- Leverage: 42.08%
- Managed Assets: $1.209 billion
- Structure: Perpetual
CHI states its objective as “seeks total return through capital appreciation and current income by investing in a diversified portfolio of convertible securities and high yield corporate bonds.” This is fairly straightforward but can also be beneficial to retail investors.
The fund’s expense ratio comes to 1.29%; when including leverage, it comes to 2%. Interestingly, that is one basis point below CHY’s, even though the fund is somewhat smaller. Both are fairly large in the CEF universe, though.
For CHI’s leverage, they had $399.4 million in notes payable that were outstanding at the end of April 30th, 2022. They also pay at a rate of OBFR plus 0.80%, where the average interest rate came to 0.62%.
They had another $166.25 million in Mandatory Redeemable Preferred Shares. They also had a Series A come up to its term redemption on September 6th, 2022.
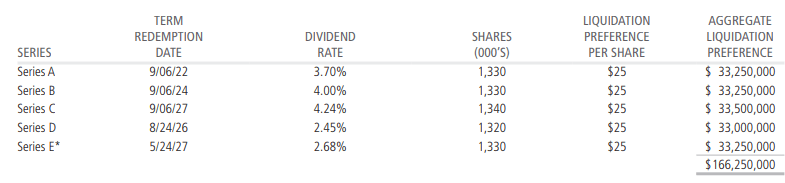
CHI Preferred Leverage (Calamos)
As we can see, all the metrics are the same except for the amount outstanding.
One thing I noticed is that at the end of each respective semi-annual period, CHI was running at about 92.9% of its borrowing capacity. CHY was a bit lower at 90.7%. Both have a commitment fee of 0.10% on any unused portion.
Since CHI used more of their borrowings, at least what was reported on the final day of the period, that could be why the one basis point difference in borrowing costs.
I’d also note that each started out with fairly high leverage, but it became even more elevated as both have suffered some deep losses this year. Their focus on more growth-oriented company convertible issues has had a negative impact on the fund.
Total Net Asset Value Returns Comparison
We can look no further than the total NAV return over the last decade to highlight how similar they are on a single metric. I’ve also included the total share price return for the entire group of Calamos funds.
I’ve excluded Calamos Long/Short Equity & Dynamic Income Trust (CPZ) because it has a vastly different strategy and hasn’t been around that long. CPZ has some small allocations to convertible securities at times but isn’t as weighted in that area as the other Calamos funds. It would have meant not being able to go back very far. I believed it was important to go back a decade to highlight the similar results that CHY and CHI have produced during this period. They are the closest two results we see on that total NAV return basis.
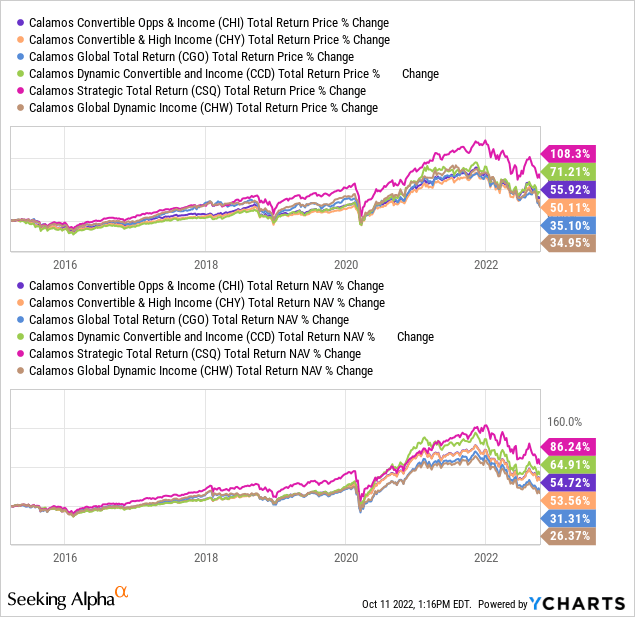
Ycharts
Looking at the YTD comparison, we also continue to see this mirrored performance between the two funds. It also shows how hard these funds have been hit YTD. Thus, the reasoning behind the rapid increase in the leverage ratios noted above.
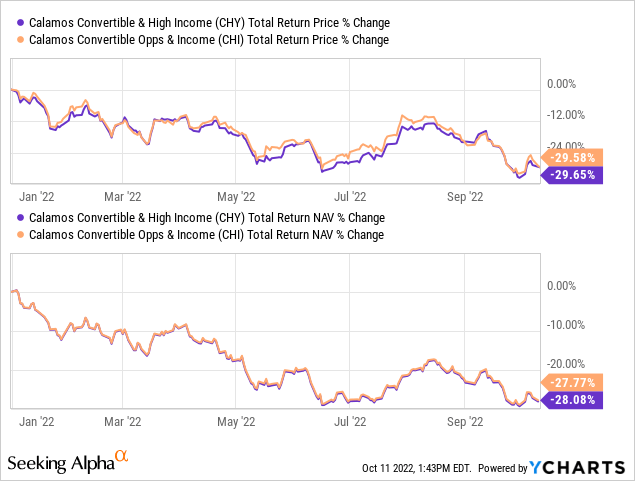
Ycharts
Valuations
For valuations, both of these funds have often traded near parity with their NAV if we looked at their average discounts.
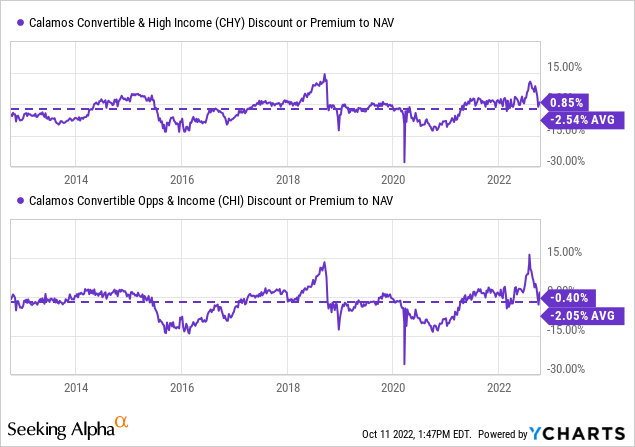
Ycharts
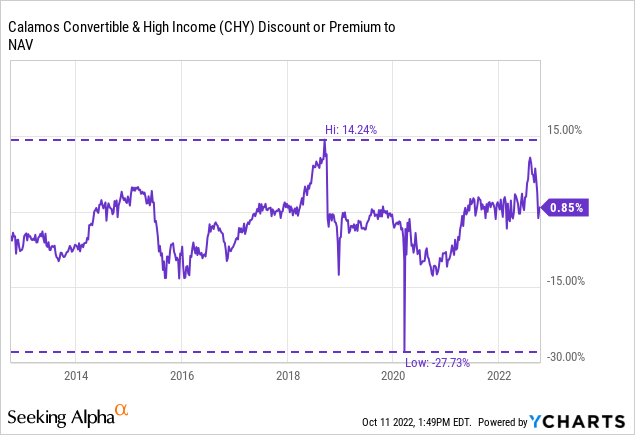
However, it has been a bit volatile regarding when they go to discounts; they seem to really go to some wide discounts. Looking at just CHY as an example, over the last decade, the fund had a high premium of 14.24% and a trough discount of 27.73%. Of course, those two points were hit only briefly.
Still, we can see where the fund has traded at a premium for a while. Conversely, there has been plenty of times the fund has pushed around a 10% discount.
Ycharts
At this point, both of these funds are trading on the higher end. That is despite CHI showing a slight discount compared to CHY. What makes it a more difficult call to rule these funds out is just how much everything has sold off already on a broad market basis.
A Look At The Portfolios
CEFs are simply a wrapper for other assets. Things such as discounts/premiums and leverage can make them more volatile, but at the end of the day, they will tend to follow their NAV performance – at least over longer periods. That means it is important to look at what they hold to understand why they are performing so poorly.
I noted above that they are both oriented towards more growth-positioned companies. This is often the case with convertibles because that is what makes them attractive to issue convertible bonds and preferred stock in the first place.
It is the idea that the underlying stock price will appreciate, and that’s when the returns are made on these convertible securities. They can pay little or no yield, so for some convertibles, appreciation is the only return.
Here’s a look at the sector weightings and the asset allocation of each fund. While there are some minor differences, we already know that given the performance similarities, it hasn’t meant a great deal in the end.
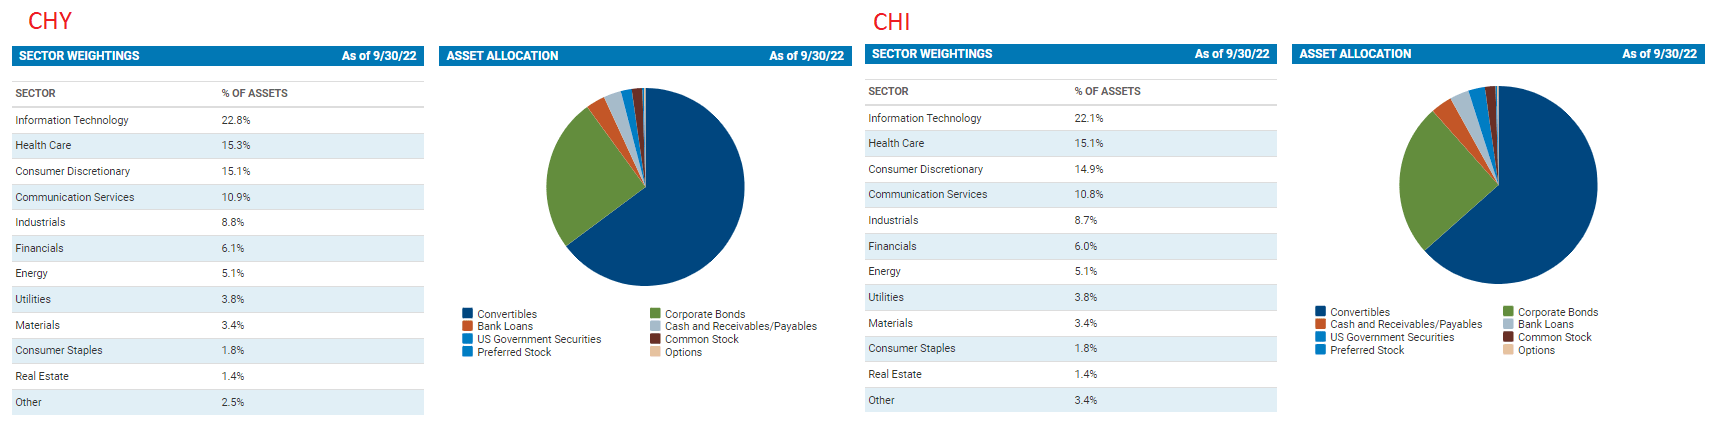
CHY/CHI Positioning (Calamos)
One might point out the healthcare exposure in each fund as being fairly heavily weighted. It is true that they should be naturally more defensive, but it isn’t your Johnson & Johnson (JNJ) or Merck (MRK) type of holdings.
Instead, it is companies such as Acadia Healthcare (ACHC), Bausch Health Companies (BHC) and Teva Pharmaceuticals (TEVA). ACHC has done really well, but TEVA has been weaker over the last year. BHC has fallen off a cliff as defaults seem quite possible.
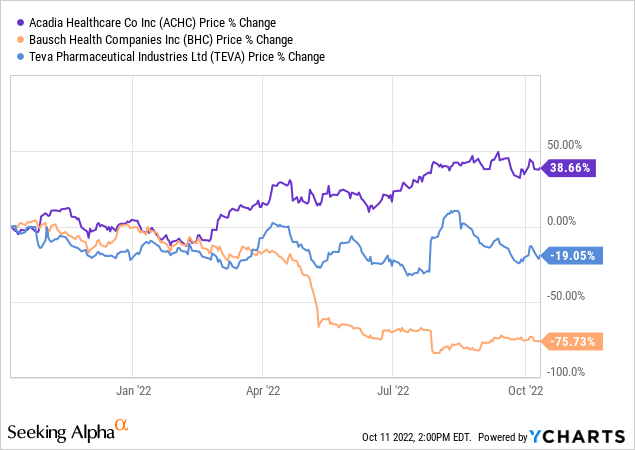
Ycharts
That being said, those that I chose to highlight as a random sampling are paying some yields on their bonds. 5% for Acadia, 7.25, 5 and 6.125% for the Bausch Health Companies holdings and 6, 4.75, 7.125 and 3.15% for the Teva Pharma holdings.
These positions are also near or already under the principal amount they are carrying for the Calamos funds. That means that they still have a good chance of receiving par back at maturity. That’s another similarity between convertible bonds and regular bonds. However, it depends on what valuation they bought them at if it will result in a realized gain or loss. Also, if a company such as BHC defaults or goes bankrupt, then only a fraction is likely to be recovered.
There are several names that show up in each of the portfolios with low or even 0% interest rates. Airbnb 03/1526 comes at a rate of 0.000%, Chegg 09/01/26 also at 0.000% and Etsy 09/01/27 at 0.125%, to name a few. Those are some sweet terms for each of those companies. All three of these names show up in both CHY and CHI.
Now here’s a look at the performance of the common shares, (ABNB)(CHGG) and (ETSY), over the last year. All three of the convertibles’ valuation is below the principal amount.
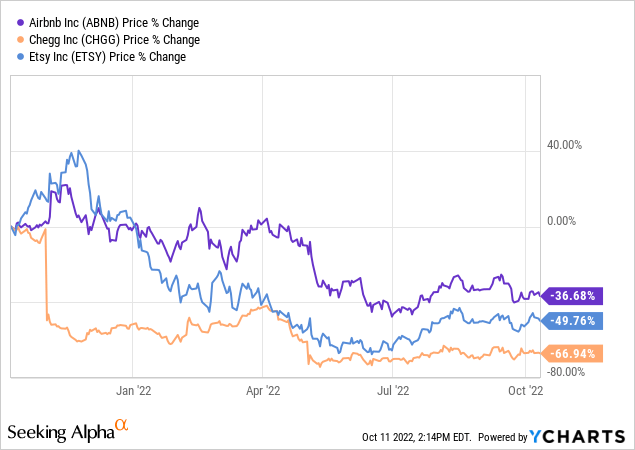
Ycharts
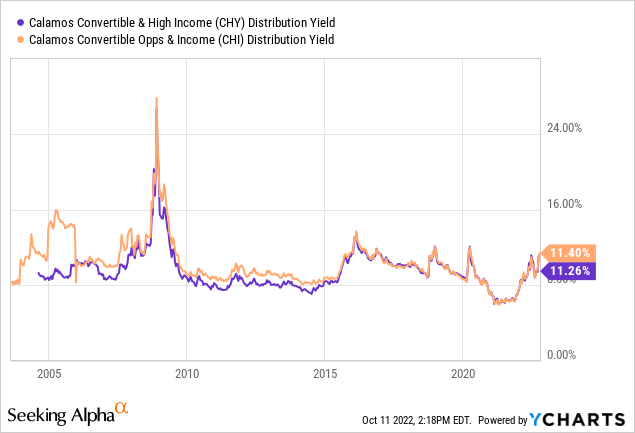
Distributions
After a very strong 2020 for the types of holdings that CHY and CHI invest in, both funds were able to boost their distributions. They were paying back to their pre-2018 levels. That was around the time when they last cut.
Here’s a look at CHY.
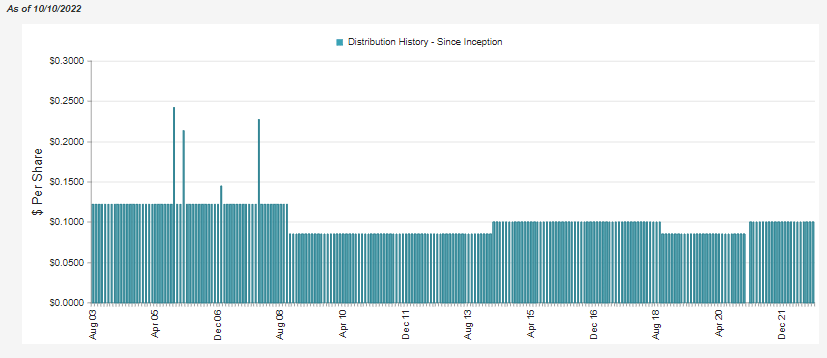
CHY Distribution History (CEFConnect)
Here’s a look at CHI.
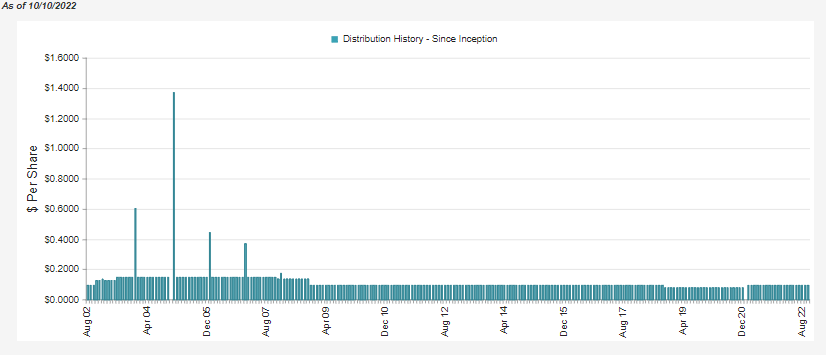
CHI Distribution History (CEFConnect)
Both were still below the pre-GFC levels they had been paying out. That seems to be a function of permanent damage sustained in GFC that they’ve never recovered from and lower rates now than pre-GFC.
One of the things that really highlights the change over the years is the net investment income ratio found in the financial highlights. Fiscal 2005 showed an NII to net asset ratio of 9.55% for CHY and 9.59% for CHI. In fiscal 2020, these NII ratios reached 4.45% and 4.36%, respectively. That was a significant change, highlighting how much yields had changed and why capital gains are required to continue each fund’s payout.
I’m referencing fiscal 2020 instead of 2021 because the amortization of investment securities started to show up. That pushed the NII to net asset ratio negative, but has since slowed in the latest report to allow NII to go positive once again.
With the distribution yields rising once again and with a down market, that could mean more difficulty coming across capital gains. I believe that the current distributions aren’t safe. They could be cut with continued weakness in the overall market.
Ycharts
The Calamos Global Dynamic Income Fund (CHW) and Calamos Global Total Return Fund (CGO) have already been cut. I sent out the yellow flag for CGO earlier this year as I became cautious about the distribution. Now, I am doing the same for both CHY and CHI.
Conclusion
Neither CHY nor CHI have provided any safety relative to the broader market. They have been hit hard as their growth-oriented portfolios full of convertible issuances have declined in value. That said, both have still held up relatively well on a discount/premium basis. CHY is at a slight premium, and CHI is only at a slight discount. In other previous rocky periods, the discounts on these funds have widened. At this point, neither seems overly attractive unless you also believe that the overall market can start to make a recovery. With CHI at a slight discount, that would appear to be the more worthwhile fund, but it is quite close.
Be the first to comment