

ponsulak/iStock via Getty Images
Beyond any doubt, one of the most iconic names in entertainment is Cedar Fair (NYSE:FUN). As one of the largest regional amusement park operators on the planet, the company has a large reach and has a solid operating history if you exclude the COVID-19 pandemic era. Since bottoming out during the pandemic, the company’s top and bottom lines have recovered nicely. Recent data provided by management suggests that the firm is on track to its best year ever. If this comes to fruition, it wouldn’t be hard to imagine significant upside for investors moving forward. But the company doesn’t need such a strong year in order to be a valuable prospect. Even if we see financial performance completely revert back to what it was in 2019, shares would have some nice upside potential moving forward. Because of this, I have decided to rate the business a ‘buy’ at this time.
Fantastic performance
The last time I wrote an article about Cedar Fair was in December of 2021. At that time, I acknowledged that the business had suffered significantly as a result of the COVID-19 pandemic and the associated economic shutdowns. After all, what worse place to go to than a packed theme park. At that same time, however, I also said that the company was exhibiting signs of a strong turnaround and that shares would be attractively priced if they reverted back to the kind of performance the business achieved in 2019. Because of this, I ultimately rated the business a ‘buy’, indicating my belief that the firm would outperform the market over an extended timeframe. So far, the company has disappointed in the sense that investors who bought in at the time of my article would be down. But relative to the market, I would consider this a modest win. While the S&P 500 has seen a drop of 19.2%, shares of Cedar Fair have generated a loss for investors of just 13%.
Author – SEC EDGAR Data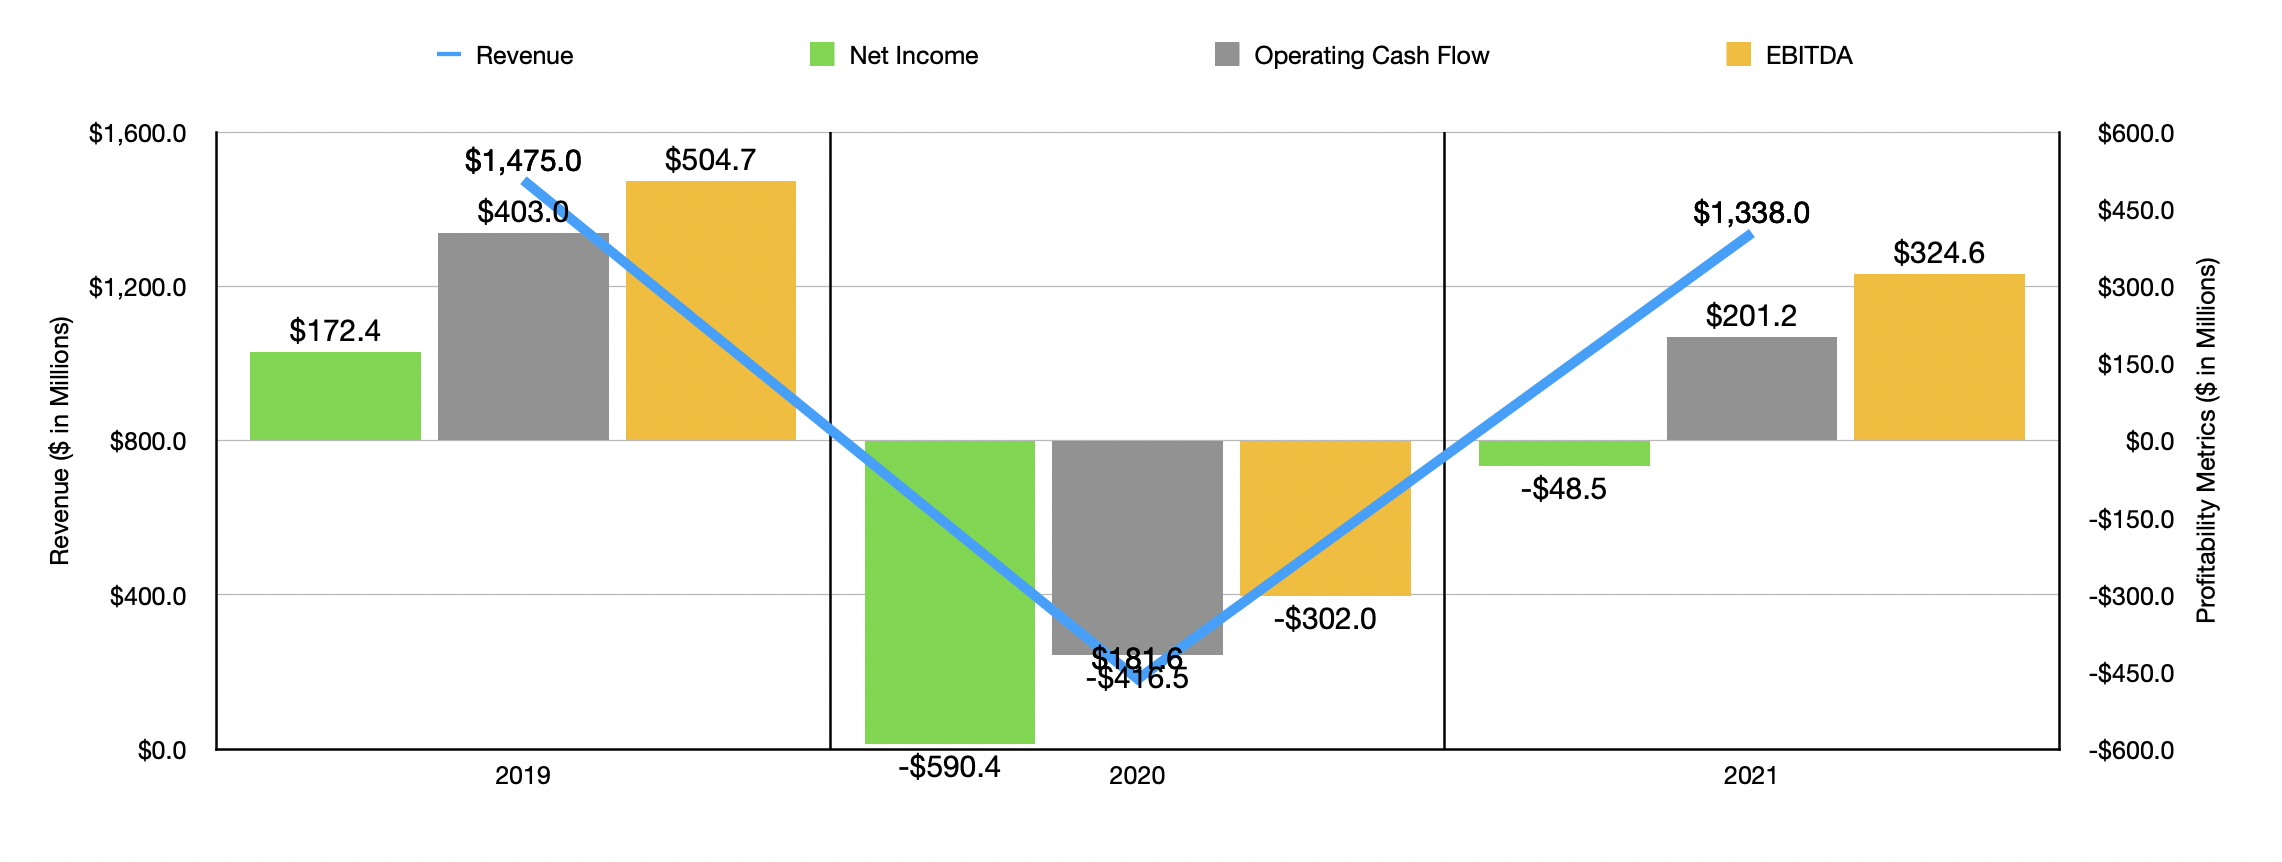
This disparity is not without cause. When I last wrote about the firm, we only had data covering the first three quarters of the company’s 2021 fiscal year. Today, we now have data covering through the first quarter of 2022. To begin with, it’s worth noting that overall financial performance for 2021 came in quite strong. Revenue of $1.34 billion beat out the $181.6 million experienced in 2020. On the other hand, it was still lower than the $1.47 billion achieved in 2019. This increase in revenue from 2020 to 2021 was due to a combination of factors. First and foremost, the company saw the attendance at its theme parks rise from 2.6 million to 19.5 million during that timeframe. In addition to that, the in-park spending, per-capita, also increased, jumping from $46.38 to $62.03.
Profitability for the company was, in general, mixed. However, it definitely came in stronger than it did in 2020. The net loss of $48.5 million that the company achieved in 2021 was small compared to the $590.2 million loss achieved in 2020. Operating cash flow of $201.3 million represented a significant improvement over the negative $416.5 million seen just one year earlier. Meanwhile, EBITDA for the company went from a negative $302 million to a positive $324.6 million in just one year.
Author – SEC EDGAR Data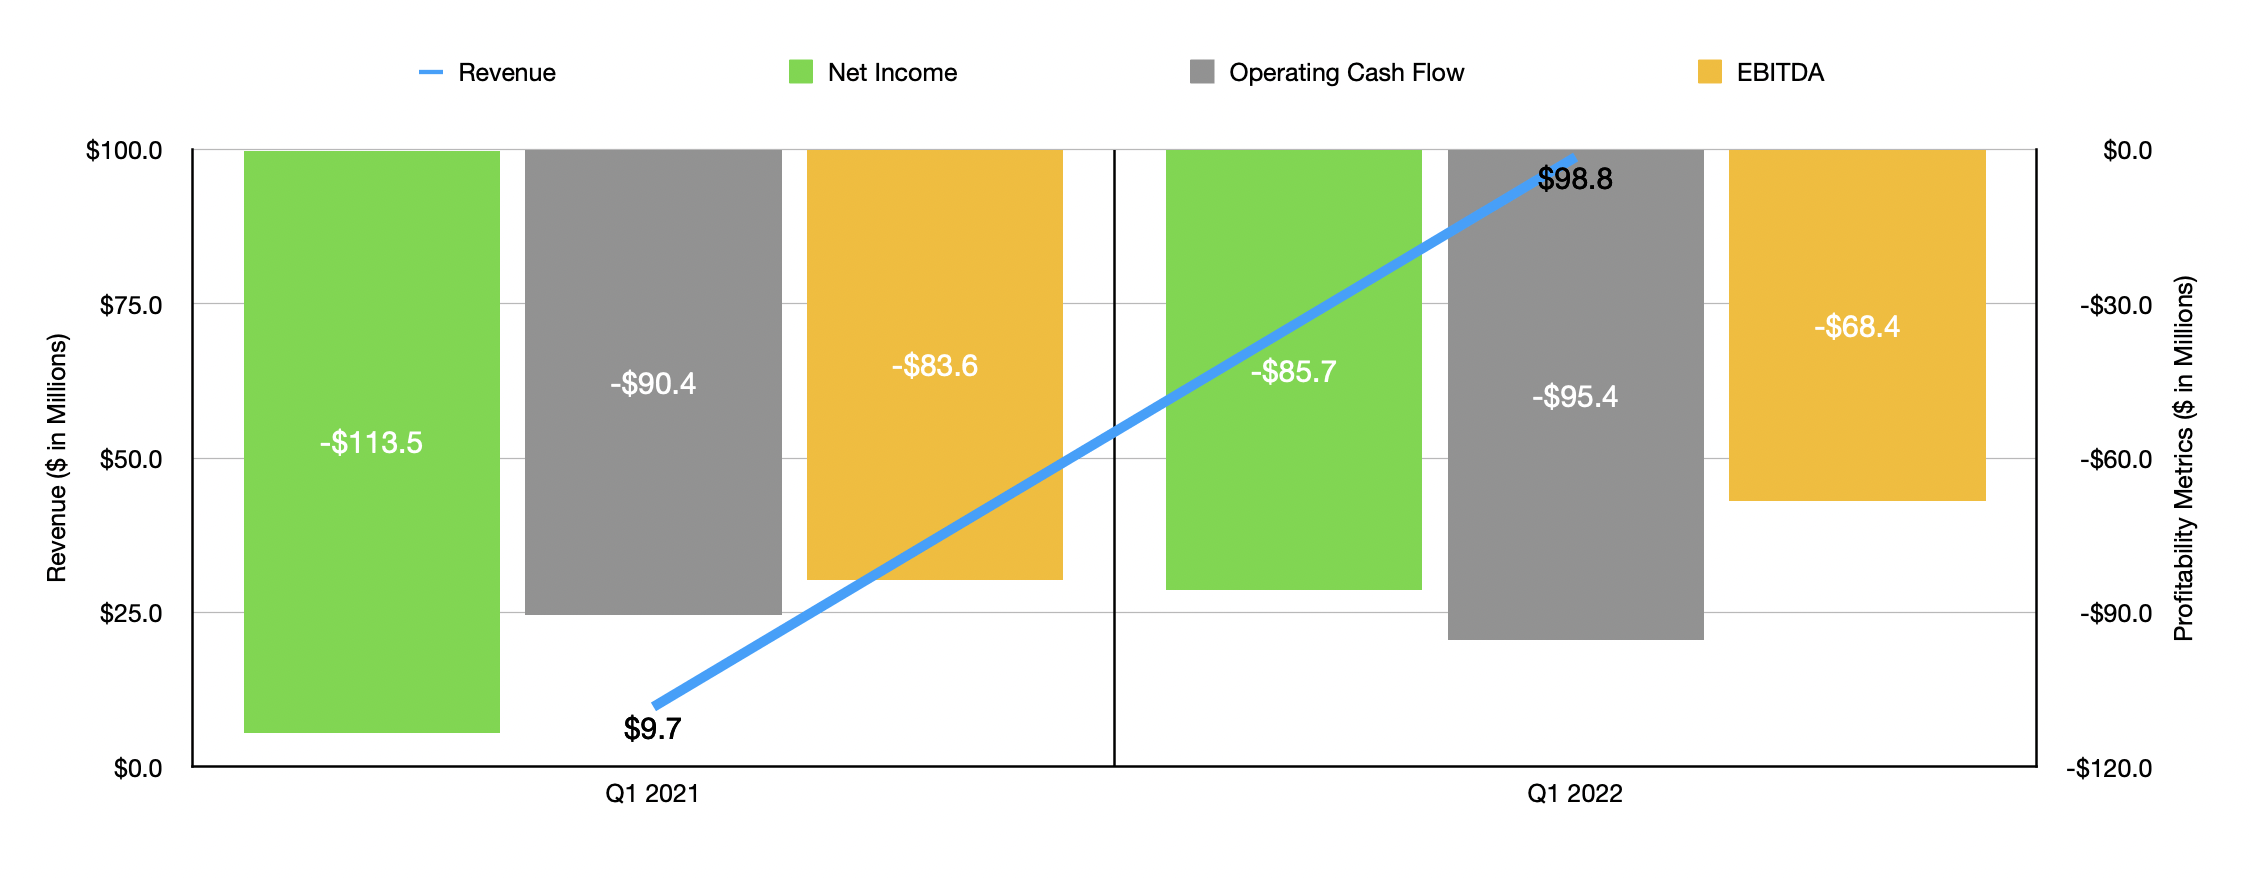
When it comes to the 2022 fiscal year so far, the picture for the business has been quite robust. Revenue in the first quarter was $98.8 million. That’s over 10 times the $9.7 million achieved just one year earlier. The company had 1.49 million visitors at its theme parks compared to zero in the first quarter one year earlier. And in-park per-capita spending of $58.86 was higher than what the company achieved at any point in its operating history. The company still generated a loss of $85.7 million for the quarter. But considering the first quarter is generally weaker anyways because of inclement weather and considering the $113.5 million loss achieved one year earlier, I consider this a win for the company. Operating cash flow did worsen, going from negative $90.4 million to negative $95.4 million. But EBITDA managed to improve, turning from a negative $83.6 million to a negative $68.4 million.
Subsequent to the end of the latest quarter, management did reveal some additional information. For the first five months of the 2022 calendar year, sales have risen to total $343 million. That’s $60 million, or 21%, above what the company achieved in the same five-month window of 2019. For context, the 2019 fiscal year was the single best year for the company from a revenue perspective. This came as the total number of visits actually fell from that time in 2019 to the same time this year by 210,000, dropping to 5.2 million for the window as a whole. However, management attributed that to 14 fewer operating days this year. What made up for this was in-park per-capita spending of $59.70. That is 27.6% above the $46.77 reported the same time of 2019.
Given the volatility we are likely to see this year in the broader economy, and the cyclical nature of theme park visits, I think it’s too early to forecast out what financial results might look like for 2022 as a whole. Management has also not provided any detailed guidance for the year. Clearly though, the firm is on track to beat financial performance achieved in 2019. But it’s important to note that the company doesn’t need this in order to justify further upside. Using our 2019 results, the business is trading at a price to operating cash flow multiple of 6.5. That’s down from the 7 I calculated in my prior article. The EV to EBITDA multiple also dropped slightly, declining from 10.4 to 10.3. Even if financial performance were to come in weaker like what we saw in 2021, these multiples would still be 13 and 16.1, respectively. In that case, I could see the business being more or less fairly valued.
Author – SEC EDGAR Data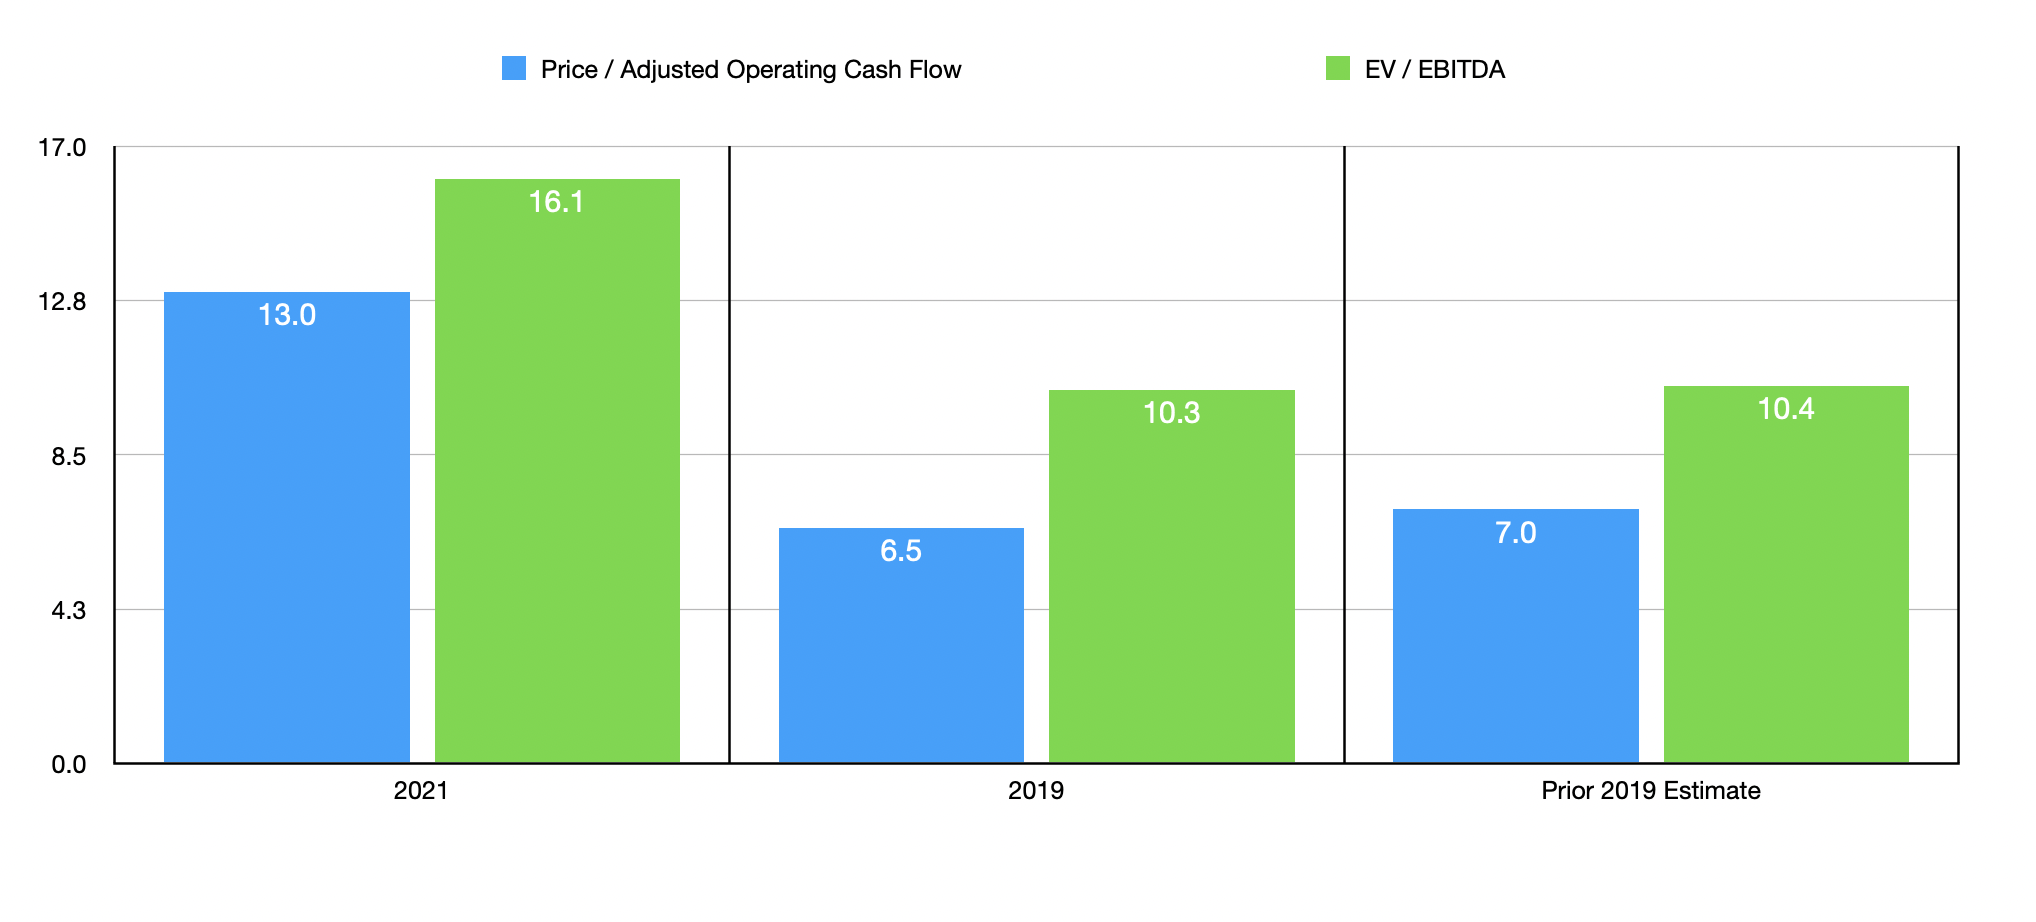
To put the pricing of the company into perspective, I decided to compare it to two similar theme park operators. Using the 2021 results, these companies were cheaper than Cedar Fair, with operating cash flow multiples of 5.7 and 6.5, respectively, and with EV to EBITDA multiples of 9.8 and 8.9, respectively. If, however, we looked at it through the lens of the 2019 fiscal year as a more normal year for the business, shares look rather cheap. The price to operating cash flow multiples of these other two firms are 7.4 and 9.3, while the EV to EBITDA multiples are 10.7 and 10.9. In both of these cases, Cedar Fair is the cheapest of the group.
| Company | Price / Operating Cash Flow (2021) | EV / EBITDA (2021) | Price / Operating Cash Flow (2019) | EV / EBITDA (2019) |
| Cedar Fair | 13.0 | 16.1 | 6.5 | 10.3 |
| SeaWorld Entertainment (SEAS) | 6.5 | 9.8 | 7.4 | 10.7 |
| Six Flags Entertainment (SIX) | 5.7 | 8.9 | 9.3 | 10.9 |
Takeaway
Right now, I have a difficult time understanding why shares of Cedar Fair are as cheap as they are. I understand the market’s concerns about the economy more broadly. But when you think about it from a long-term perspective, shares of the business look rather cheap. This is true on both an absolute basis and relative to similar players. And it ignores the recently strong financial performance that could represent a new normal for the company once economic issues have passed us by. Because of all of this, I have decided to retain my ‘buy’ rating on the stock at this time.
Be the first to comment