

Diy13/iStock via Getty Images
Q2 recap and thesis
Palantir Technologies Inc. (NYSE:PLTR) reported a mixed Q2. Topline growth is very healthy in my view, although the firm’s updated guidance disappointed consensus expectations. Q2 revenues dialed in at $473M, a 26% YoY growth and also slightly exceeding consensus expectation of $471.72M. Looking ahead, PLTR updated its Q3 sales to be between $474M and $475M, compared to consensus estimates of $508M. For full-year 2022, its new guidance is now $1.9B of total revenue, just short of analysts’ estimates of $1.98B.
To me, what is more concerning is the bottom line. It spent another quarter in the red, reporting a negative $0.01 adjusted EPS. Furthermore, I also anticipate a full-year loss of $0.20 a share given the business conditions to be detailed next. Looking further out, assuming a favorable business climate, I am hoping that it would report a small positive profit (say a few cents to a dime per share) in 2023.
As such, in the article, I will focus on analyzing its cash burn rates in the near term based on the Q2 earnings release (“ER”). The firm currently has $2.4 billion in cash and no debt. And my conclusion is that it ought to have no trouble meeting its working capital requirements, CAPEX needs, and OPEX needs in the near term.
Q2 highlights
Before we dive into the issues, let’s first go over the bright spots. As aforementioned, topline continued its robust growth in my view. Q2 revenues grew to $473M, a 26% YoY growth. At the same time, the firm maintains a very healthy contract pipeline both in the government and commercial segments, as its Chief Operating Officer Shyam Sankar commented (abridged and emphases added by me):
The contracts we have in our pipeline are key to facing the challenges in front of the West. Our government business grew to $263 million in revenue in Q2, rising 9% quarter-over-quarter. More broadly, across the commercial and government sectors, health care has become a substantial and rapidly growing business, generating approximately $153 million in revenue in the first half of 2022, up from $42 million in the first half of 2020 at the onset of the pandemic. That represents a 91% compounded annual growth rate.
PLTR Q2 ER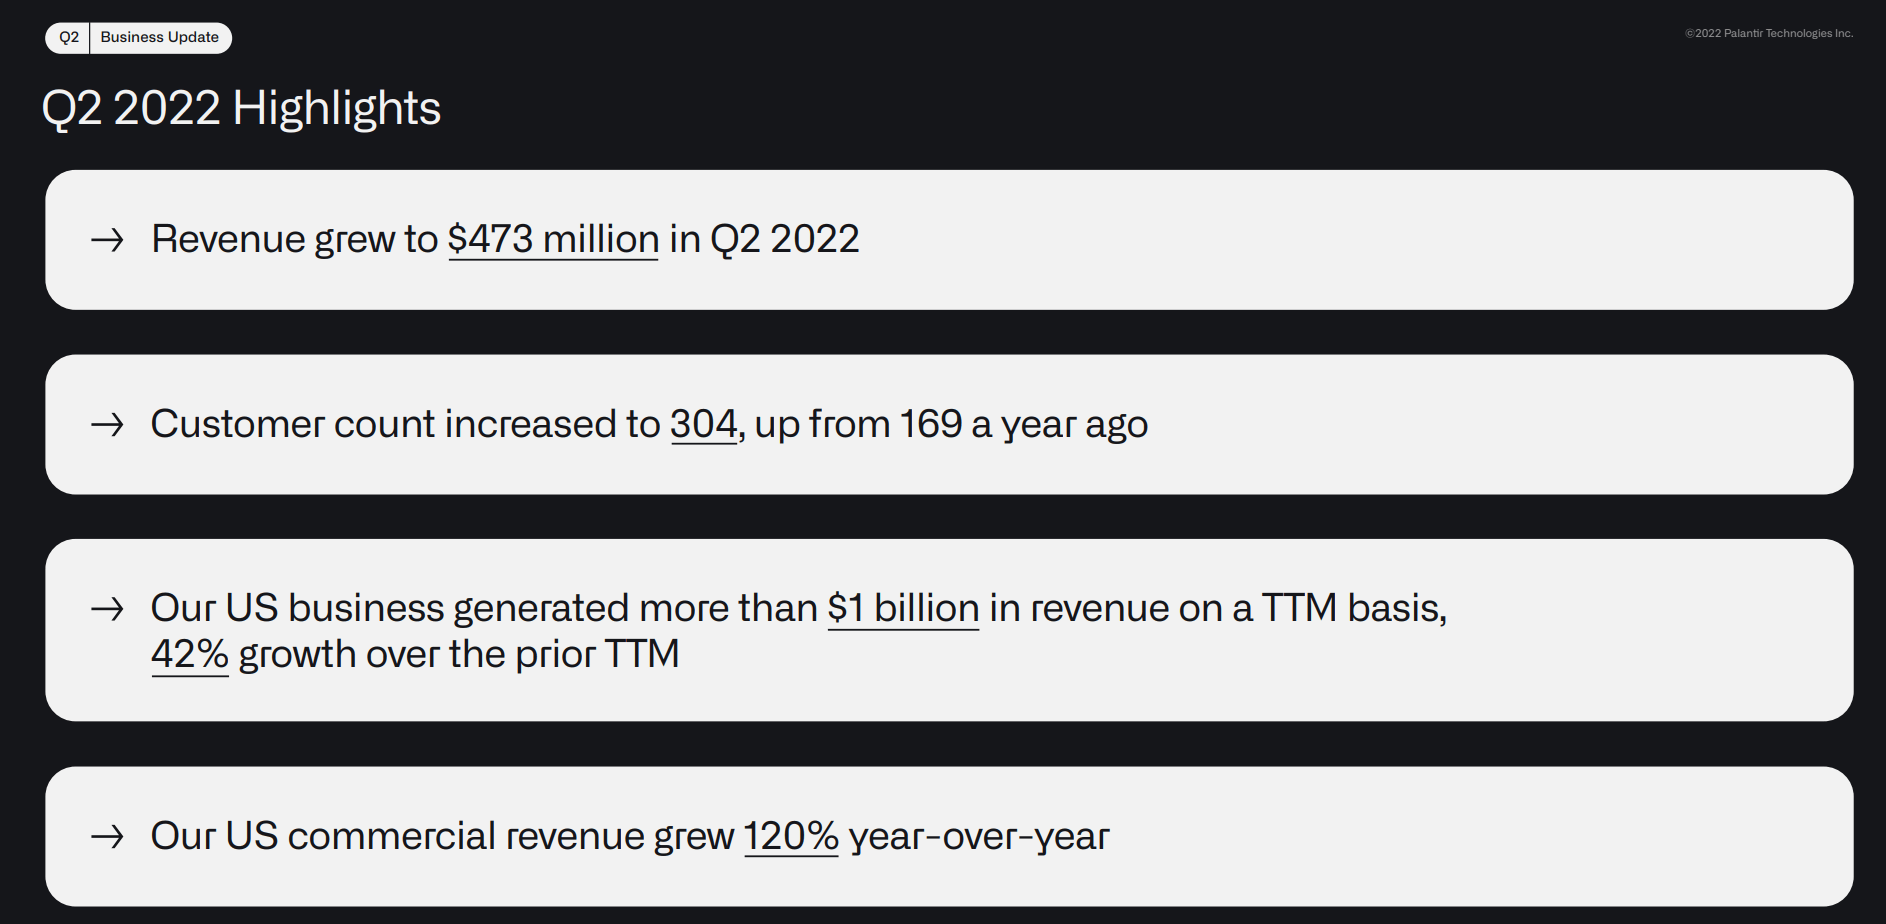
The customer count increased to 304, an almost 80% increase from last year’s 169. As the firm grows in scale, it’s benefiting from the scale of economy as you can see from its asset turnover rates below. PLTR’s asset turnover has been as low as 0.47 during the pandemic. And it has overall been in the range of 0.48 to 0.49 over the past few quarters. And you can see, an overall uptrend as it gains scale and current its asset utilization is at a peak level of 0.52.
Looking forward, the company’s leadership has ambitious growth goals. They anticipate sales to reach $1.9B for full-year 2022, a growth of 23% YoY compared to 2021’s $1.54B. I share their optimism given the contract pipeline and the scaling of the business. But I also see some uncertainties ahead, including the intensification of competition and rising operating costs, which lead me to my next section to examine its cash burn rates.
Seeking Alpha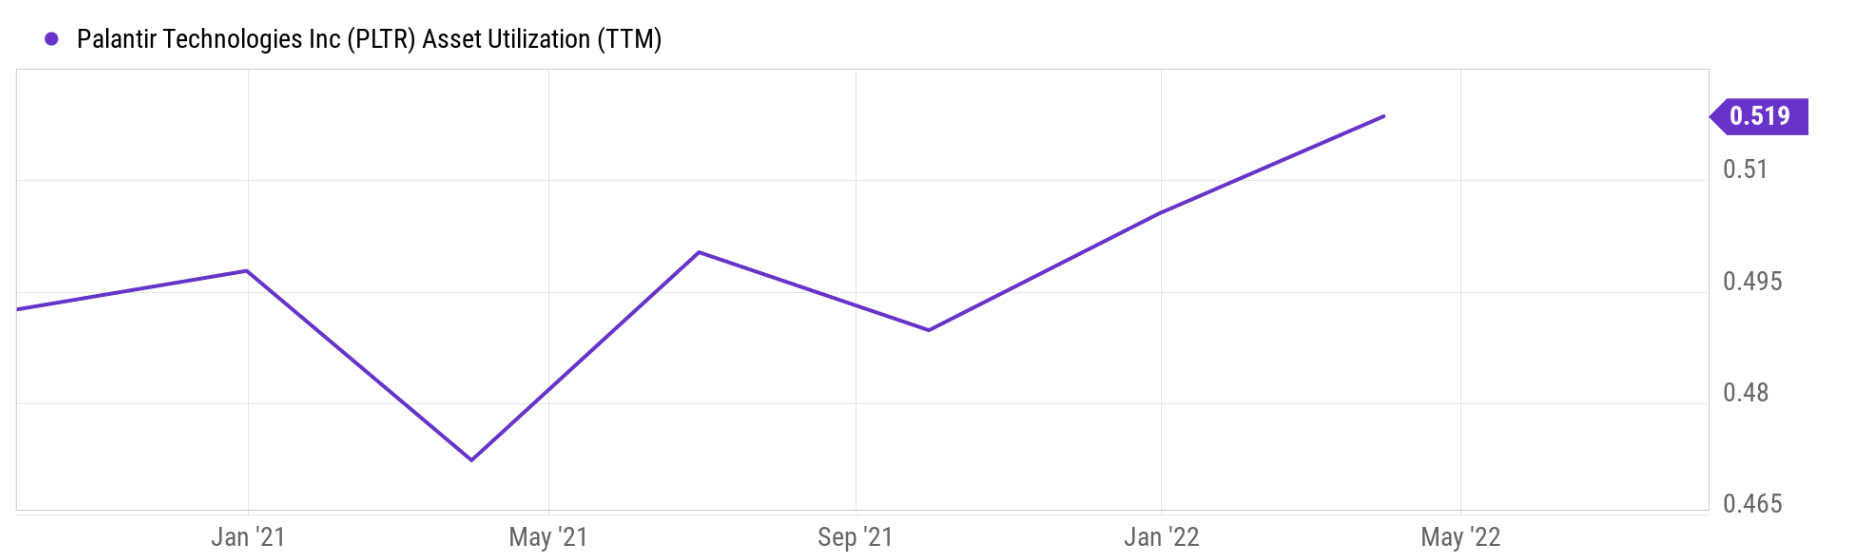
Cash burn rates
To fuel its growth, PLTR spends aggressively both on growth CAPEX and OPEX (operating expenses) as summarized in the chart below. The top panel of the chart shows PLTR CAPEX spending in the past few quarters. Its CAPEX expenditures have been consistently around or below $5M on a quarterly basis till 2022 and then surged to $15.2M in the past quarter. Compared to its operating cash flow of $35.5M in the past quarter (shown in the mid-panel), its free cash flow was a positive $20M, which is the good news.
The even better news is that PLTR does not need to spend too much on maintenance CAPEX, as you can see from the bottom panel of the chart. If we approximate its maintenance CAPEX with depreciation, then its maintenance CAPEX cost is only on average about $3M per quarter. As a result, a large part of its CAPEX spending is growth spending.
Seeking Alpha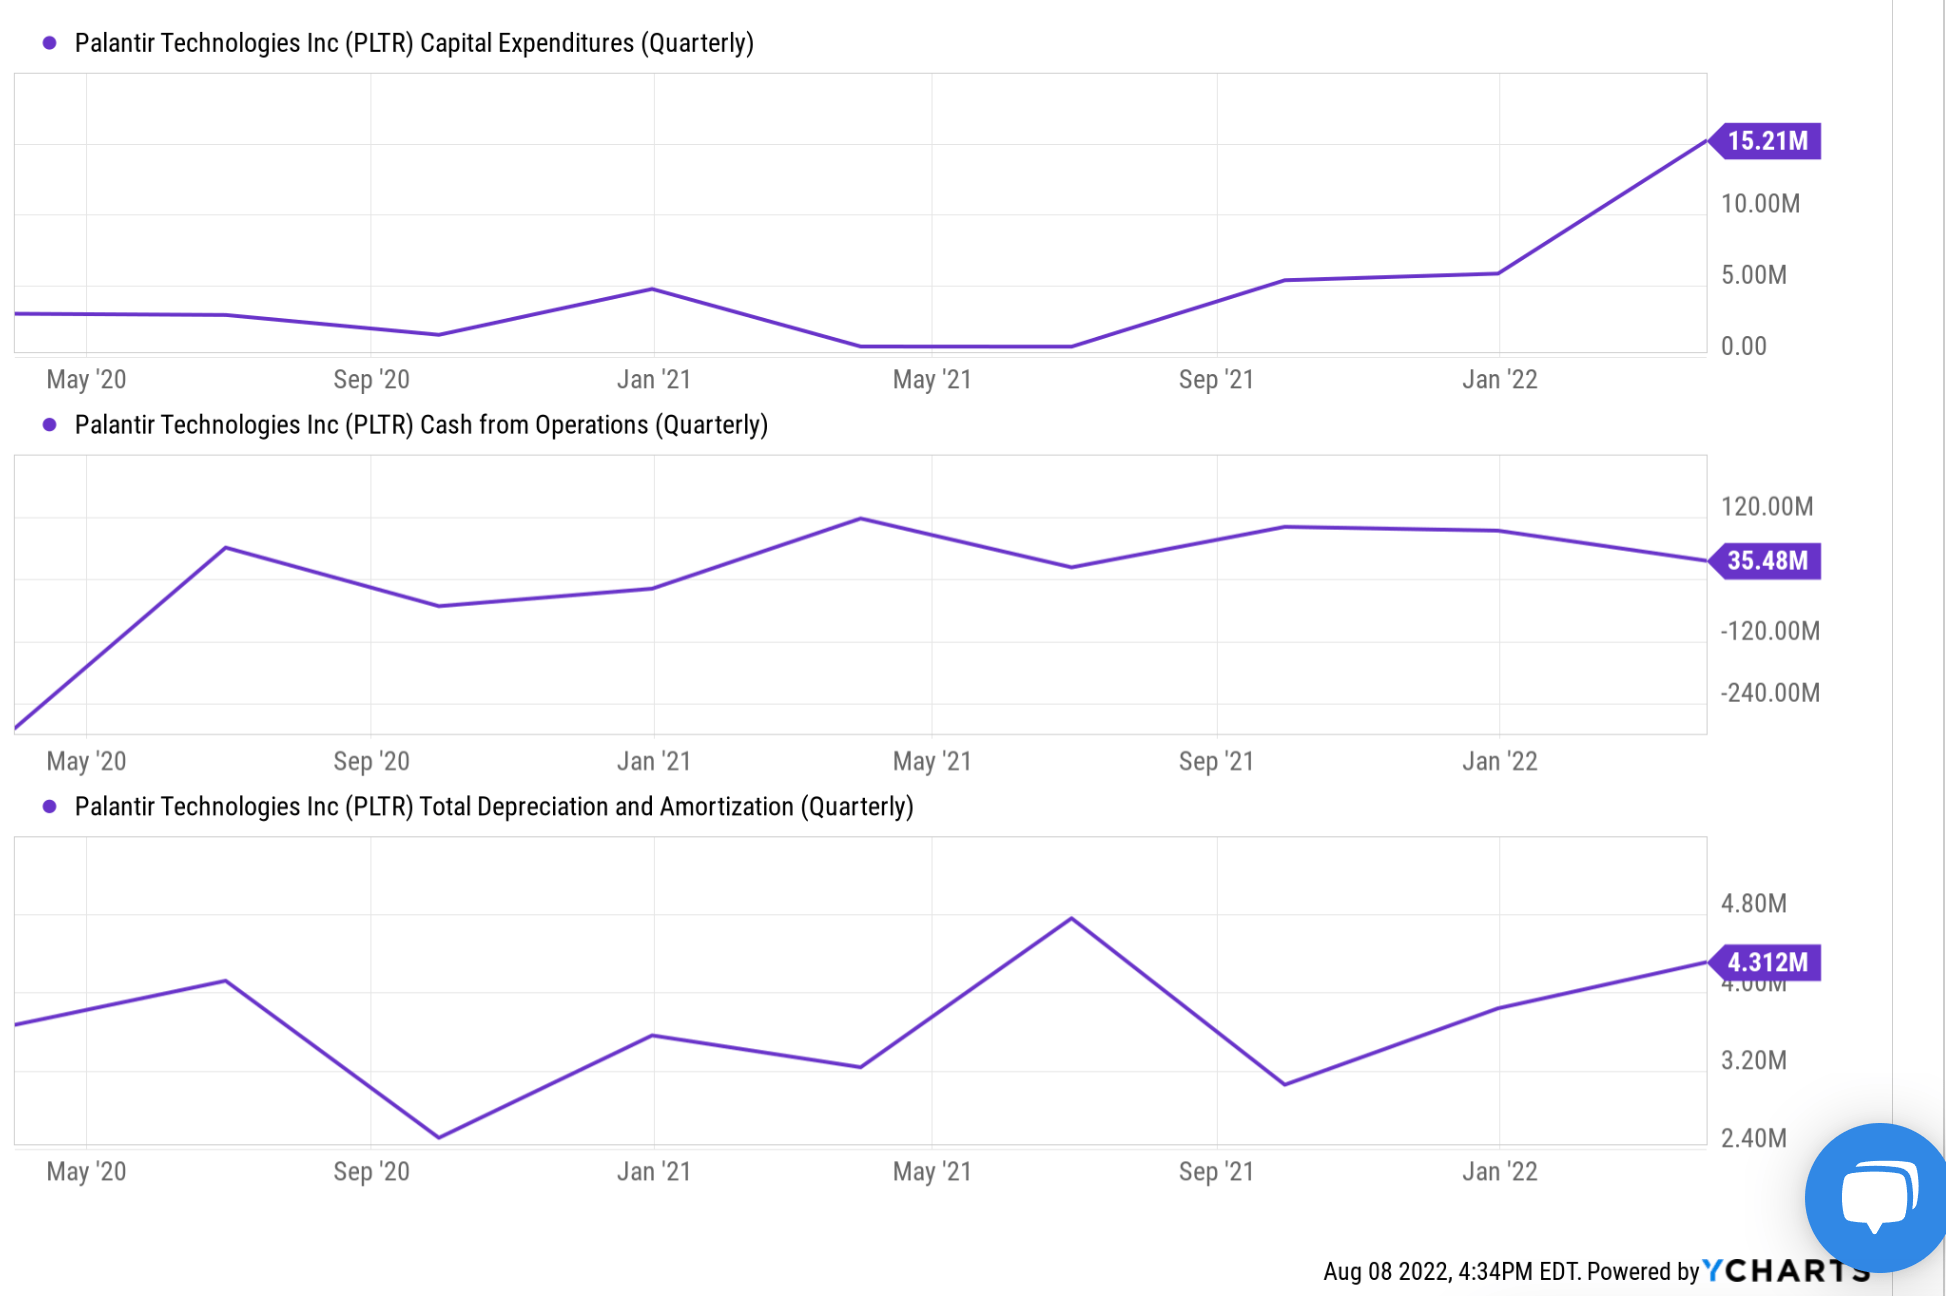
Although the bad news is that, as a software as a service (“SaaS”) software company, it has to spend heavily on OPEX as you can see from the following chart. The company has been spending hundreds of millions of dollars on new software research development. To wit, its total operating expenses have been consistently on the $390M level in recent quarters and its research and development expenses on the $88M level.
You can further split both the CAPEX and OPEX into the maintenance part and growth part, and an argument can be made to add the growth CAPEX and OPEX part back into earnings to get the owners’ earnings. The analysis in my previous article has been made along this line of thought, and readers can find more details there. Here we will just focus on the accounting earnings and see if its current finances can cover its cash burn in the near term, as we will do next.
Seeking Alpha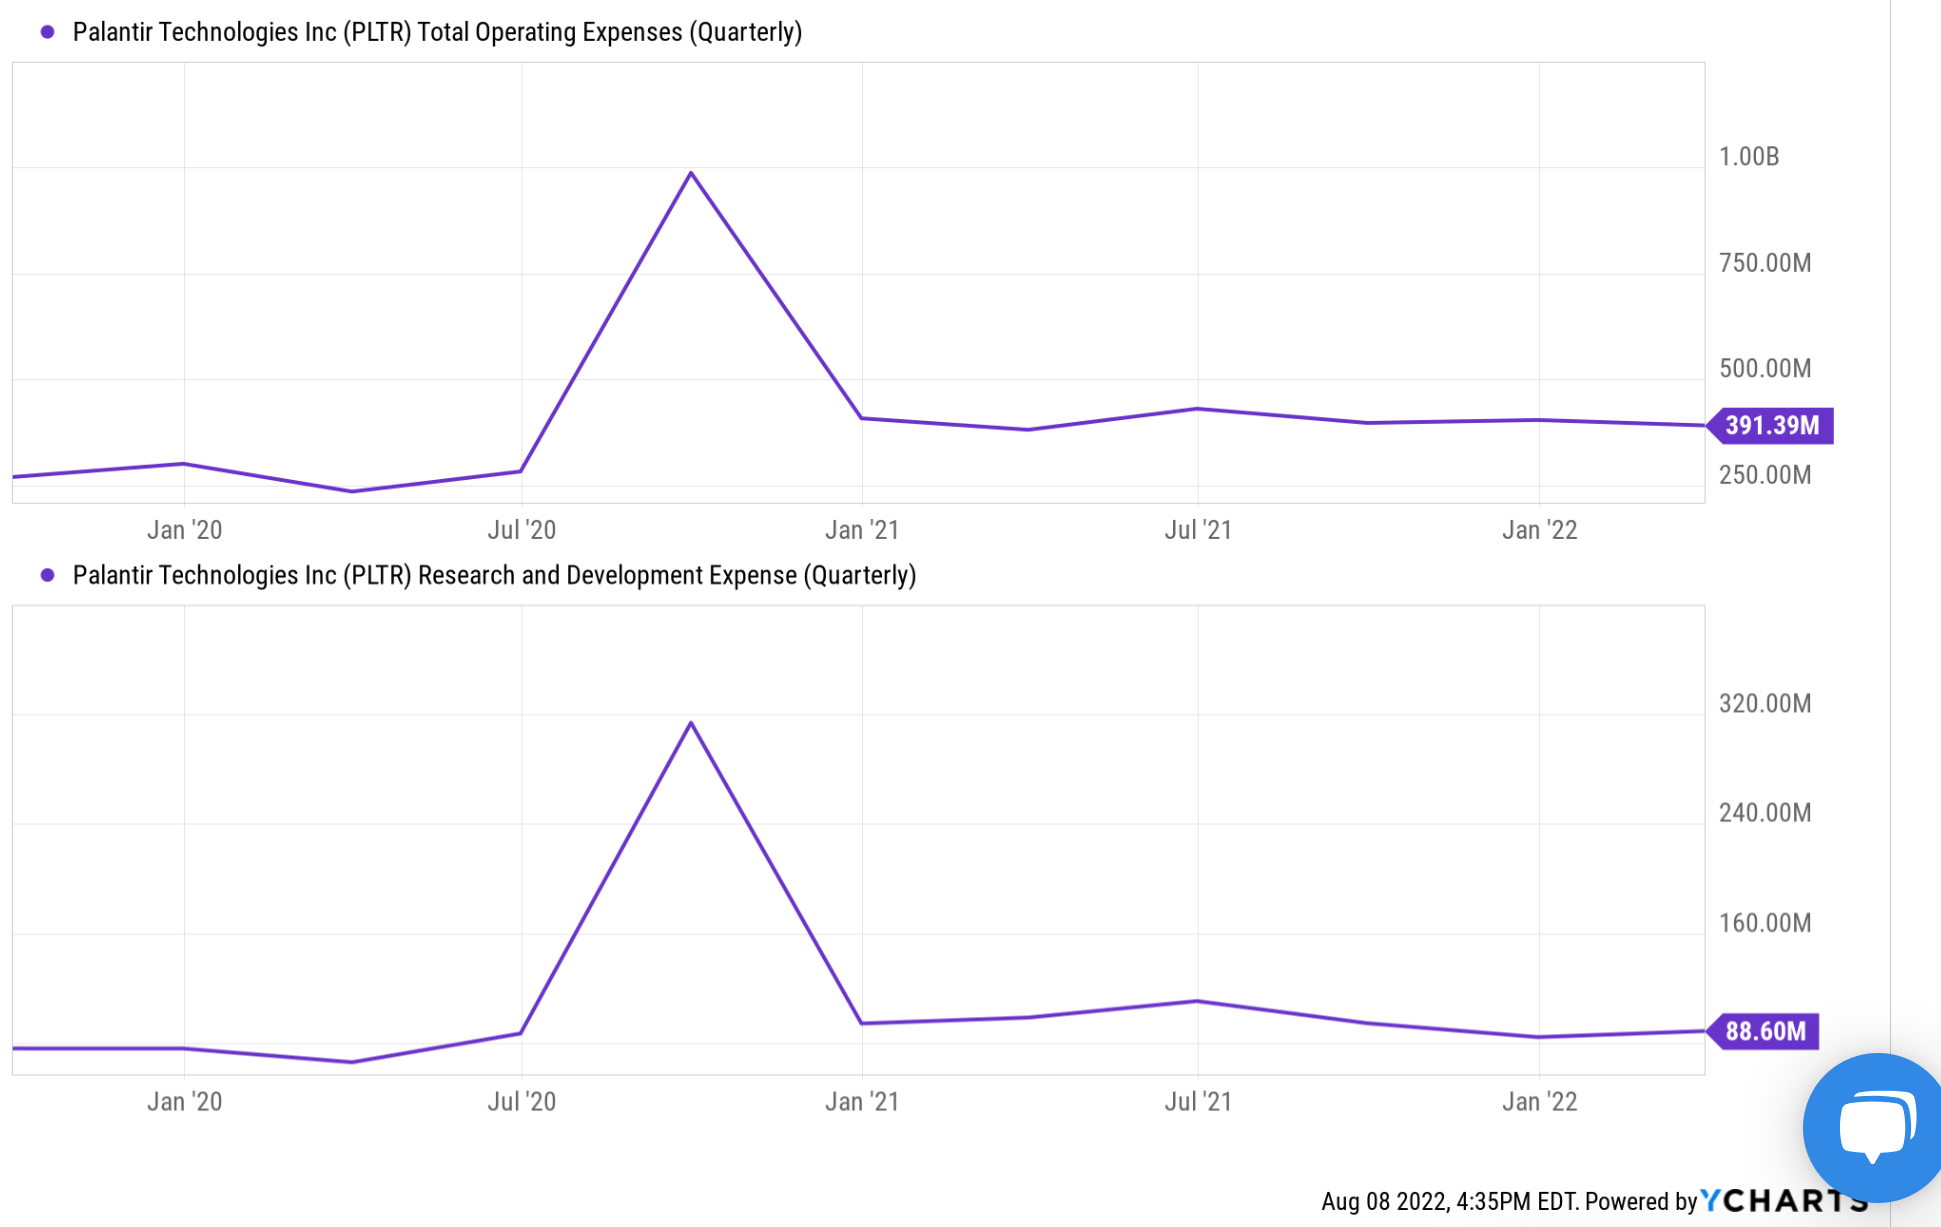
Balance sheet status
As of Q2, its cash and equivalents stood at roughly $2.4 billion. It is debt-free. And there is an additional $950 liquidity from its revolving credit facility. All things considered, it ought to be able to satisfy its CAPEX and OPEX for a while as CFO Dave Glazer commented (abridged and emphases added by me):
On a trailing 12-month basis, we have generated $314 million in adjusted free cash flow. We ended the second quarter with $2.4 billion in cash and cash equivalents and no debt. In July, we expanded our revolving credit facility by adding a $450 million new incremental delayed draw term loan facility, which provides for additional liquidity up to $950 million and remains entirely undrawn. As we highlighted last quarter, our balance sheet leaves us uniquely positioned to take advantage of the opportunities that may arise from the larger macroeconomic environment.
PLTR Q2 ER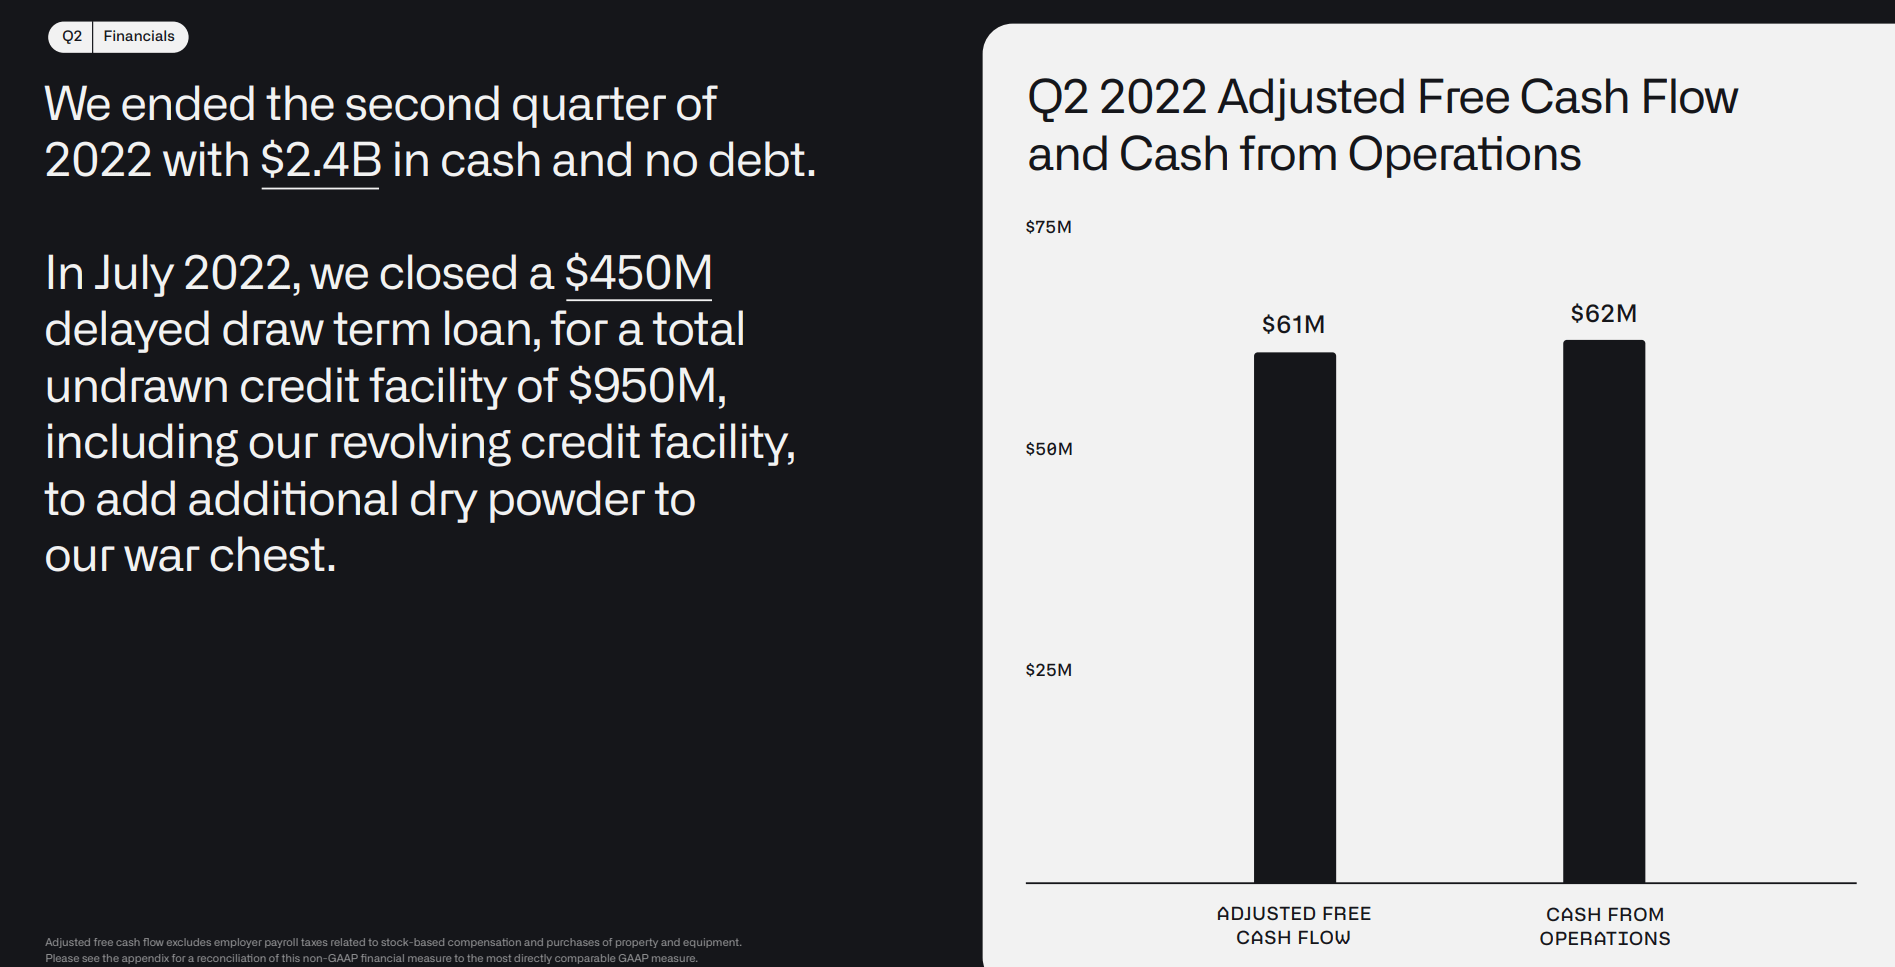
Valuation
A final word about valuation. Due to its negative EPS, the typical P/E ratio is not too meaningful here. In terms of cash flow, PLTR generated $314 million in adjusted free cash flow (“FCF”) on a TTM basis, translating into $0.15 per share. Given the small magnitude of the FCF and the variance expected ahead, the typical price/FCF ratio (which would be 59.5x at the price of this writing if you really want a number) does not apply too well either.
So here we will just take a look at topline valuation metrics. The chart below compares its P/S ratio to peers like The Trade Desk (TTD) and Google (GOOG, GOOGL). Its P/S of 10.1x is almost 2x more expensive than GOOG’s 5.3x, but more than 40% discounted from TTD’s 17x. As detailed in my earlier article, I think the PLTR is now more reasonable priced (and TTD is still priced for perfection), and its current valuation can be justified by a couple of years of sustainable growth even if valuation reverts to the market average.
Seeking Alpha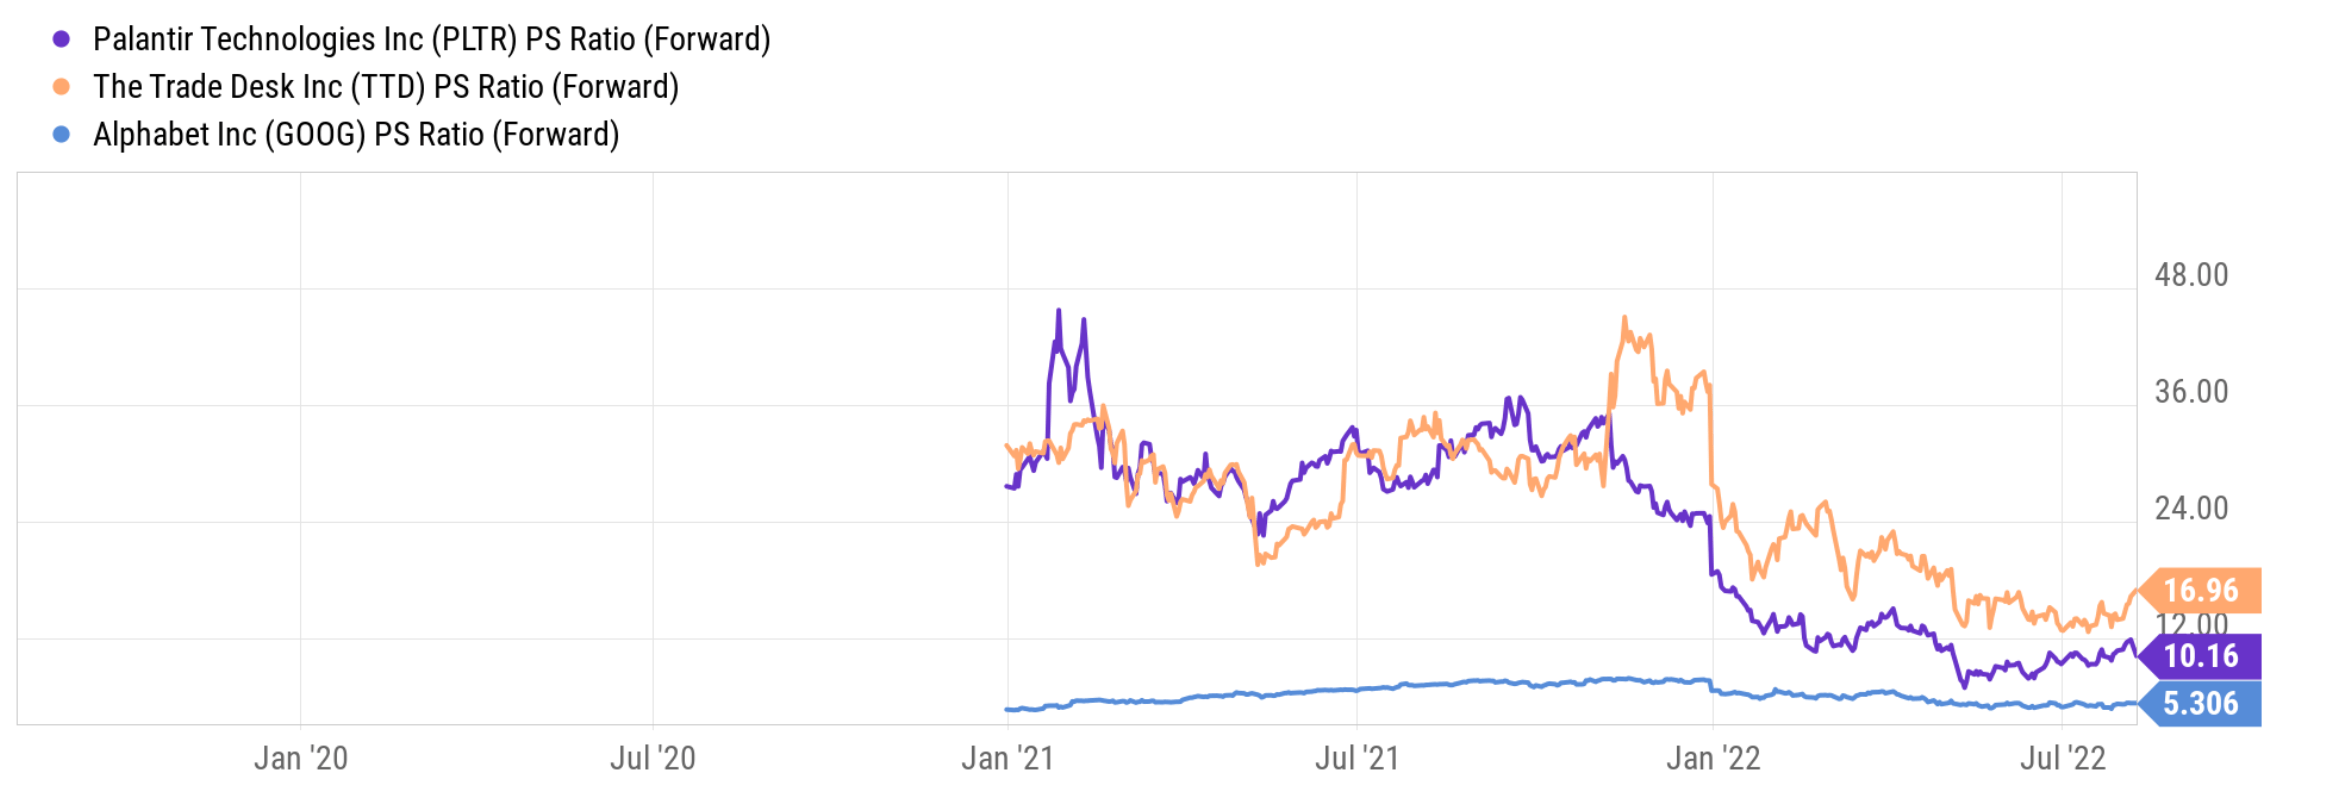
Final thoughts and other risks
Overall, I have mixed feelings about PLTR after its Q2 earnings and will maintain my “hold” recommendation. On the positive side, as its customer base grows, it will reap the benefits of the scale of economy. As a SaaS firm, it does not need to spend too much on maintenance CAPEX. All things considered, current finances are in solid shape and it ought to be able to meet its CAPEX, OPEX, and other obligations at current cash burn rates for a while.
On the negative side, it has to spend heavily on OPEX and new software research development, and it has yet to generate positive profit. Valuation is not cheap and still requires a few years of robust growth to catch up, but recent corrections have deflated the valuation bubble (with P/S multiple exceeding 35x) to a large degree.
Besides the above risks, there are some macroeconomic uncertainties ahead too. Management mentioned that as organizations around the world face more pressure, there might be a slowdown in the rate of spending and a lengthening of sales cycles. At the same time, the strengthening of the U.S. dollar to a peak level in about 20 years has been creating headwinds, just like for other global businesses.
Be the first to comment