


ozgurdonmaz
In the thesis entitled “A Possible Bounce In QQQ With TQQQ Less Attractive For Day Trading”, dated October 13, I used the divergence or differential in share prices between SPDR S&P 500 ETF Trust (SPY) and the Invesco QQQ Trust (NASDAQ:QQQ) to predict a probable bounce in the Nasdaq.
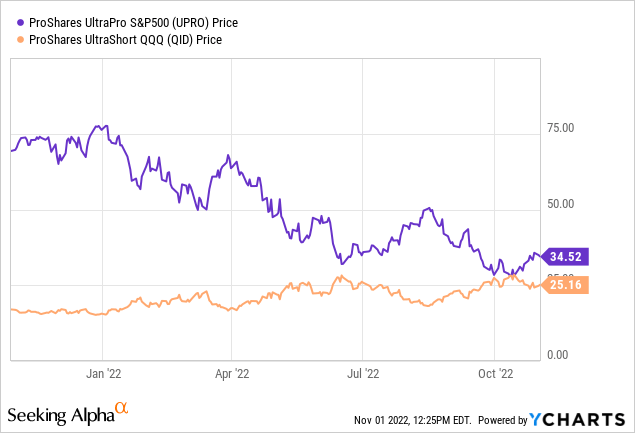
This has proved to be an accurate prediction as there has been a 3.4% gain in the tech-heavy ETF since, and the objective with this thesis is to use the SPY/QQQ relationship again, but this time to make bullish cases for both the ProShares UltraPro S&P500 (NYSEARCA:UPRO) and the ProShares UltraShort QQQ (NYSEARCA:QID). These two ETFs which track two different indices as I will elaborate upon later have been following an inverse relationship as to their price performances for the past year as pictured below.
However, this is about to change, a move that can be exploited to make money as part of a trading strategy using UPRO and QID which are two highly leveraged ETFs, but also to make sense of what is happening for buy-and-hold investors wondering how to proceed in this uncertain market.
I start by explaining how the two leveraged ETFs are related to the S&P 500 and Nasdaq-100.
Explaining the Relationships First
First, UPRO and QID track the S&P 500 and the Nasdaq-100 respectively as pictured below, with both seeking magnified gains. UPRO seeks to benefit three times (3x) from the price action of the S&P 500, while QID looks to profit from the miseries of the Nasdaq-100, and this at an accelerated pace of two times (-2x).

UPRO and QID Investment Objectives (www.proshares.com)
The next step is to investigate the relationship between the S&P 500 and the Nasdaq-100 and, for this purpose I utilize two ETFs that track them, namely the SPY and QQQ.
Going into details, SPY tracks the S&P 500 Index whereas it is the Nasdaq-100 Index for QQQ and below are two series of charts both representing the one-year performances of the two ETFs, but at different time periods. On top, the period is one year ending on October 13, whereas, for the bottom one, it is again one year period but ending on November 11. The objective here is to identify the differences or divergences in price performances and to help clearly distinguish between the charts, you can refer to the labeling.
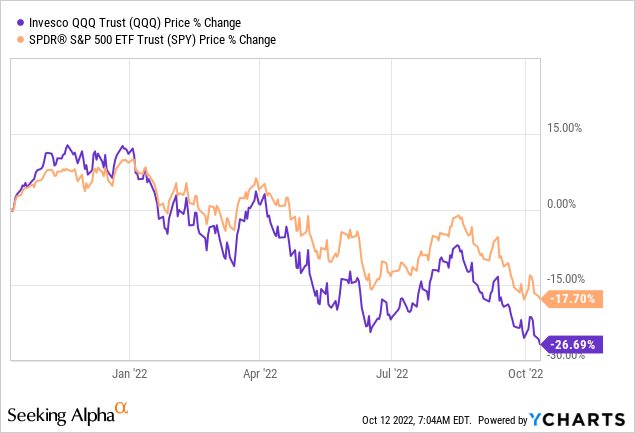
One-year performance of SPY and QQQ ending on October 13 (ycharts.com)
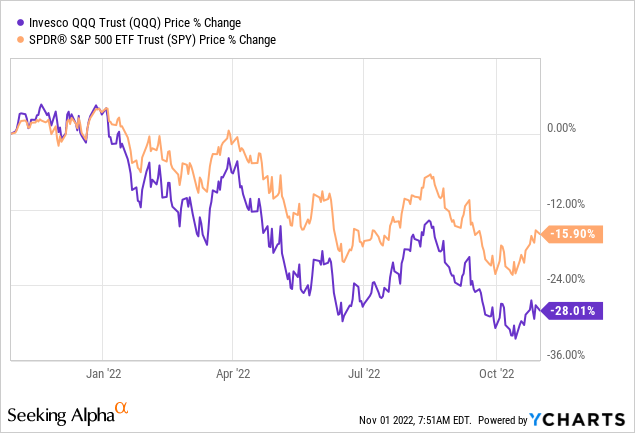
One-year performance of SPY and QQQ ending on November 11 (ycharts.com)
Coming to the differences between SPY and QQQ, you will see that in the first series, it comes to nearly 9% (26.69-17.7) whereas the second one comes to 12.11% (28.01-15.90). This shows that there is increasing divergence between the broader market (S&P 500) and tech (Nasdaq), favorable to the former.
I will provide more information as to the reasons for this later, but in the meanwhile, in order to chart and learn from the divergence I plotted the daily differences between the closing prices of SPY and QQQ (or SPY-QQQ) for the last year using historical data from Yahoo Finance. The results are shown in the chart below.
The Divergence and Underlying Reason
This divergence was at a low of around 65 in early November last year as indicated by the orange circle below when the Nasdaq and QQQ were at their peaks. As the Nasdaq started to lose its luster, the difference increased in favor of SPY as the broader market, driven by non-tech stocks from other sectors of the economy started to shine. The divergence reached a peak of around 103 (brown circle below) in June when the Nasdaq was at its lowest.
Subsequently, the Nasdaq offered some resistance as evidenced by the green circles with its divergence with respect to SPY revolving around 90. Interestingly, even the latest tech rally triggered by Apple’s (NASDAQ:AAPL) earnings beat, has not prevented the divergence from rising inexorably and is now at the 108 mark.
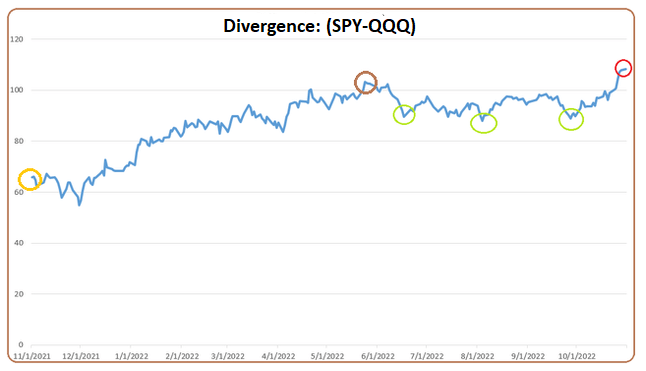
Chart representing the Difference between SPY and QQQ and built using data from (finance.yahoo.com)
This price action whereby investors seem to prefer stocks from the broader market at the expense of the Nasdaq is explained by monetary conditions becoming much tighter compared to May 2020, as the Fed Fund rate has been raised by 3% or 3.75K% in just two and half years. This new financial environment is detrimental to tech stocks which depend on cheap money to finance their higher revenue and earnings growth rates in order to justify their relatively higher valuations. To this end, both Apple and Microsoft (NASDAQ:MSFT) have seen a fall in the pace at which their YoY earnings are growing during the last four quarters.
Looking Ahead – QID
Now, the Federal Reserve’s whatever-it-takes strategy to combat inflation has been subject to criticism by market participants and it could happen that it downsizes its December hike to 50 basis points instead of 75 as planned. In this respect, some expectations of the Fed moderating its approach have helped tech and this may be the reason why the divergence seems to have reached a resistance level at 108 as pictured above.
However, while tech may get some support from the Fed becoming slightly dovish, this should not boost earnings, at least in the short-to-medium term. The reason is that with their global footprints, Big Techs also remain impacted by the strong dollar which has been trimming their revenue growth since the beginning of this year. Additionally, supply chains are also under pressure with China’s Covid-zero policy restricting the flow of goods from factories to customers, and this is not likely to stop as the U.S. prioritizes onshoring manufacturing of key electronics including semiconductors amid rising geopolitical tensions.
Therefore, expect QQQ, which holds the big tech names, as shown below, to fall; and, conversely, QID to rise, possibly to the $28 level last reached in June and October this year.
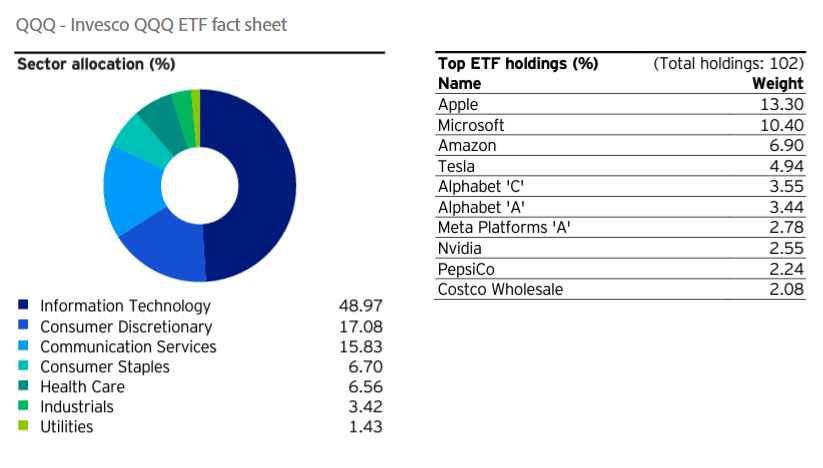
QQQ’s holdings (www.invesco.com)
My bearish position on QQQ is also due to big names like Alphabet (NASDAQ:GOOG) and Meta Platforms (NASDAQ:META) not being immune to the cyclicality of the global economy, namely with advertising revenues impacting their top lines. At the same time, after Microsoft reported financial results, there are also questions being raised about whether companies are moving to the cloud as aggressively as before.
On the other hand, SPY has much less exposure to tech.
Looking Ahead – UPRO
SPY includes only about 26% of technology companies including big names like Apple and Microsoft as shown in the table below. However, hidden below the ETF’s first top holdings which are heavily skewed towards tech, there are stocks from more traditional sectors of the economy in the form of Financials, Healthcare, Energy, and Consumer Staples as pictured below.
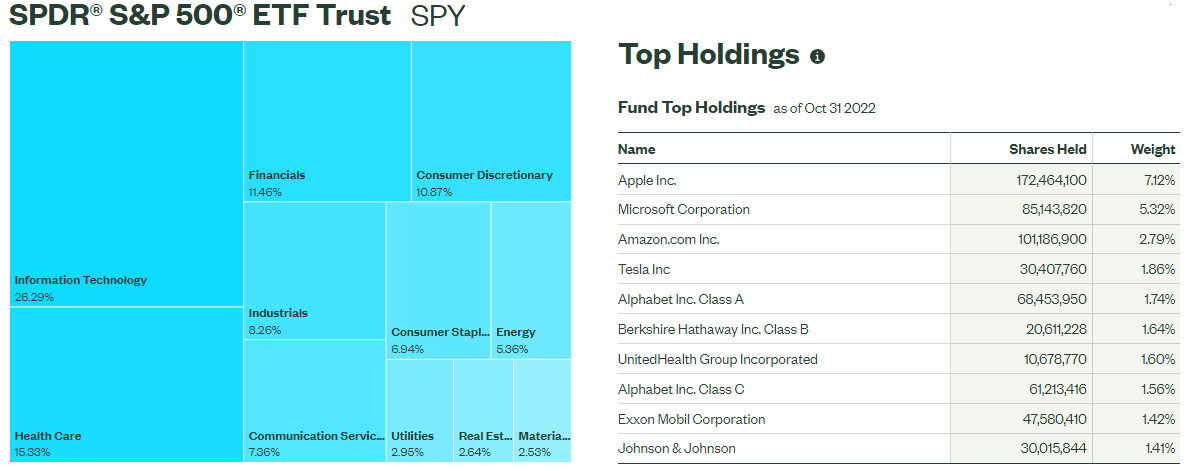
SPY Holdings (www.ssga.com)
These stocks form part of nine of the eleven sectors of the S&P 500 including Industrials which have been seeing regular gains since the beginning of October, also helped by the U.S. economy rebounding in the third quarter of 2022. The two excluded sectors are Communications Services which has seen mixed fortunes, while Information Technology has seen only sporadic gains, mostly on speculation about the Fed becoming more dovish or upbeat big tech earnings.
Pursuing further, the traditional sectors include more value and defensive names which have largely been ignored by investors as they poured money into technology stocks mesmerized by their high growth since the post-pandemic recovery. Now, things are different with the era of cheap money coming to an end and the stage looks set for banks, healthcare, and energy companies to rise further. However, do not expect a rally in the S&P 500 as there are recession risks on the horizon, but rather an erratic rise punctuated by market fluctuations. It is precisely for this reason that UPRO which provides three times the gains of the SPY is a buy and could rise to the $50 level, last achieved in mid-September. Momentum indicators also point to an upside.
However, as a leveraged tool, do not expect your gains to be precisely three times the value of the rise in SPY as there are also losses due to the compounding effect which have to be factored in when calculating your gains.
Conclusion
The same applies to QID with ProShares stressing the need to calculate returns on a daily basis as, beyond this period, there is a higher probability of volatility eating into your gains because of compounding.
Coming back to objectives, this thesis has made the case for trading both UPRO and QID based on the increasing divergence between SPY and QQQ which is accentuating in favor of SPY or the broader market. This divergence also shows that some analysts who tend to have a pessimistic view of the S&P 500 seem to be wrongly associating tech downfall with the broader market. This is not the case as the divergence chart clearly shows that the differential between the SPY and QQQ is at its highest and that with only 26% of tech, the S&P 500 does not need to suffer from the same fate as the Nasdaq.
Finally, while this thesis is basically about trading using highly leveraged ETFs, investors can also use the SPY/QQQ divergence as guidance on how to position themselves in view of the relationship between the broader market or SPY and the tech-heavy QQQ.
Be the first to comment