

RLWPhotos
Just over two months ago, I wrote on BJ’s Restaurants (NASDAQ:BJRI), noting that the company had a tough second half ahead, with a more challenging macro backdrop. While the company reported better sales than I anticipated in Q2, with record revenue, this was overshadowed than worse than expected inflationary pressures, with restaurant margins coming in at just 11.9% and 10.8% year-to-date. The weak margins can be partially attributed to BJ’s more conservative pricing, and the company is now playing some catch-up with menu pricing.
Although the company is confident of a better second half of the year from a margin standpoint, earnings estimates have been cut, with what could be another year of net losses per share on deck. Meanwhile, though most restaurant brands are confident in a better 2023 as inflation moderates, earnings estimates have slid for next year, too, with BJ’s now trading at 30x FY2023 earnings estimates. With the company being a low-growth brand experiencing continued margin pressure, I don’t see any margin of safety at this valuation.
Q2 Results
BJ’s Restaurants (“BJ’s”) released its Q2 results in late July, and they were mixed. From a headline standpoint, the company reported record quarterly revenue of $329.7 million, a 14% increase from the year-ago period. This was driven by 11.7% comp sales growth and new restaurant openings, with some help from above-average menu pricing, in line with the industry. However, while sales performance was strong, sales were up a paltry 4.8% vs. 2019, driven solely by menu pricing, with menu price hikes in July 2021 and November 2021, plus February and June of this year.
BJ’s Restaurants – Quarterly Revenue (Company Filings, Author’s Chart, Forward Estimates)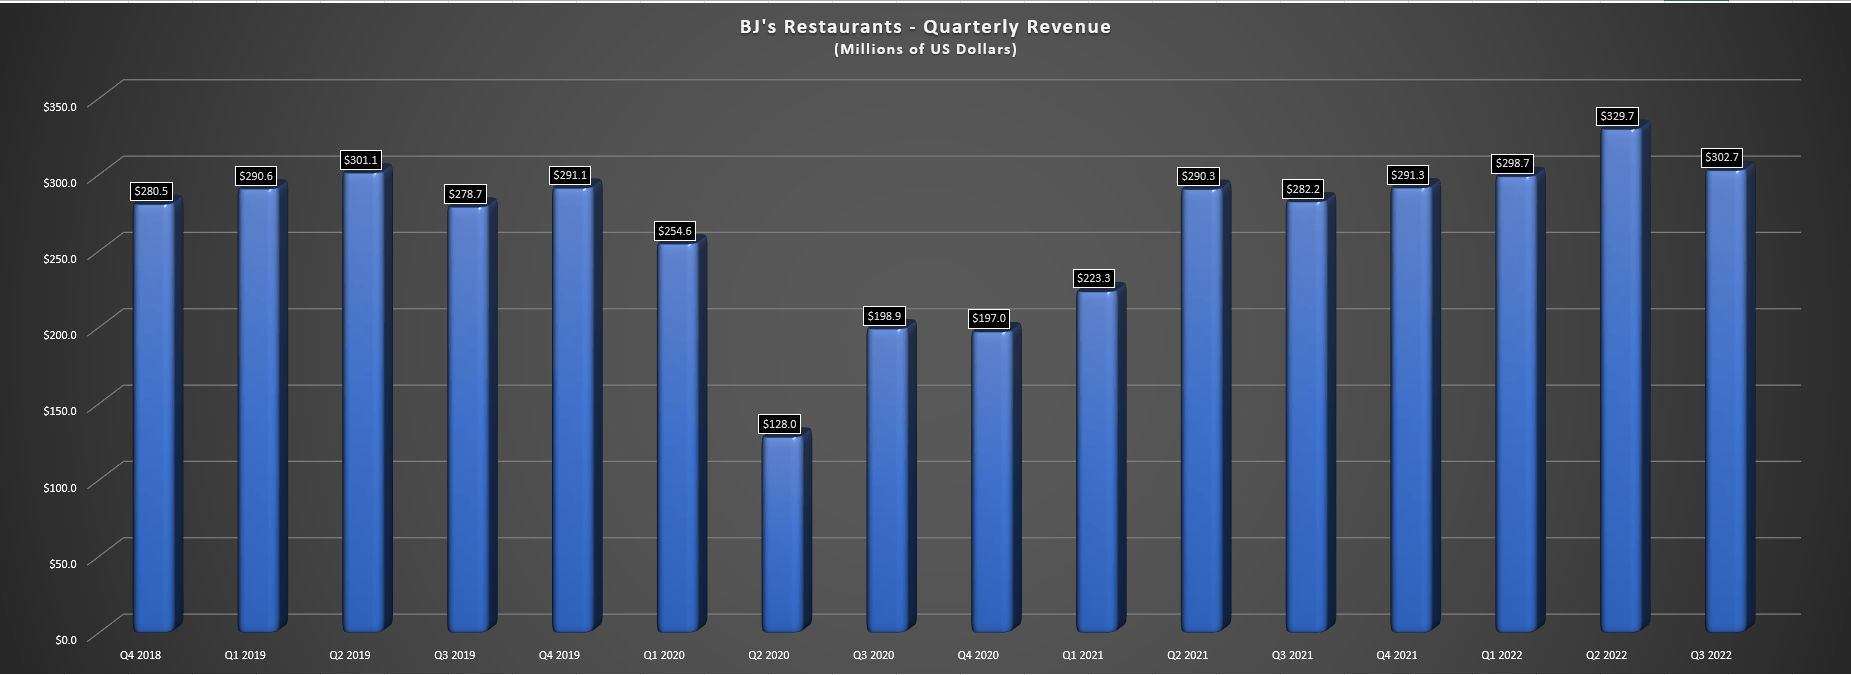
The company noted that it had taken a hard look at the business, and it hasn’t seen a shift in guest behavior, such as check management, or a propensity to trade down towards value offerings. Given these encouraging results to date and worse-than-expected inflation levels, BJ’s will take an additional 2.0% of pricing in August, translating to nearly 5.0% pricing in the back half of the year.
While this may seem like a lot of menu price increases, and certainly isn’t ideal when guests see prices steadily rising, it’s worth noting that the hikes may be frequent but have been very modest at 2.5%, 1.4%, 1.8%, and 1.4% on the most recent four increases, respectively. It’s also worth noting that BJ’s was near the middle of the pack coming into the year from an affordability standpoint and has taken price at a rate below that of the industry average. Hence, its value proposition should be improving, especially relative to some fast-casual brands which have been very aggressive, like Chipotle (CMG).
Restaurant Average Guest Check (Dine Brands Presentation)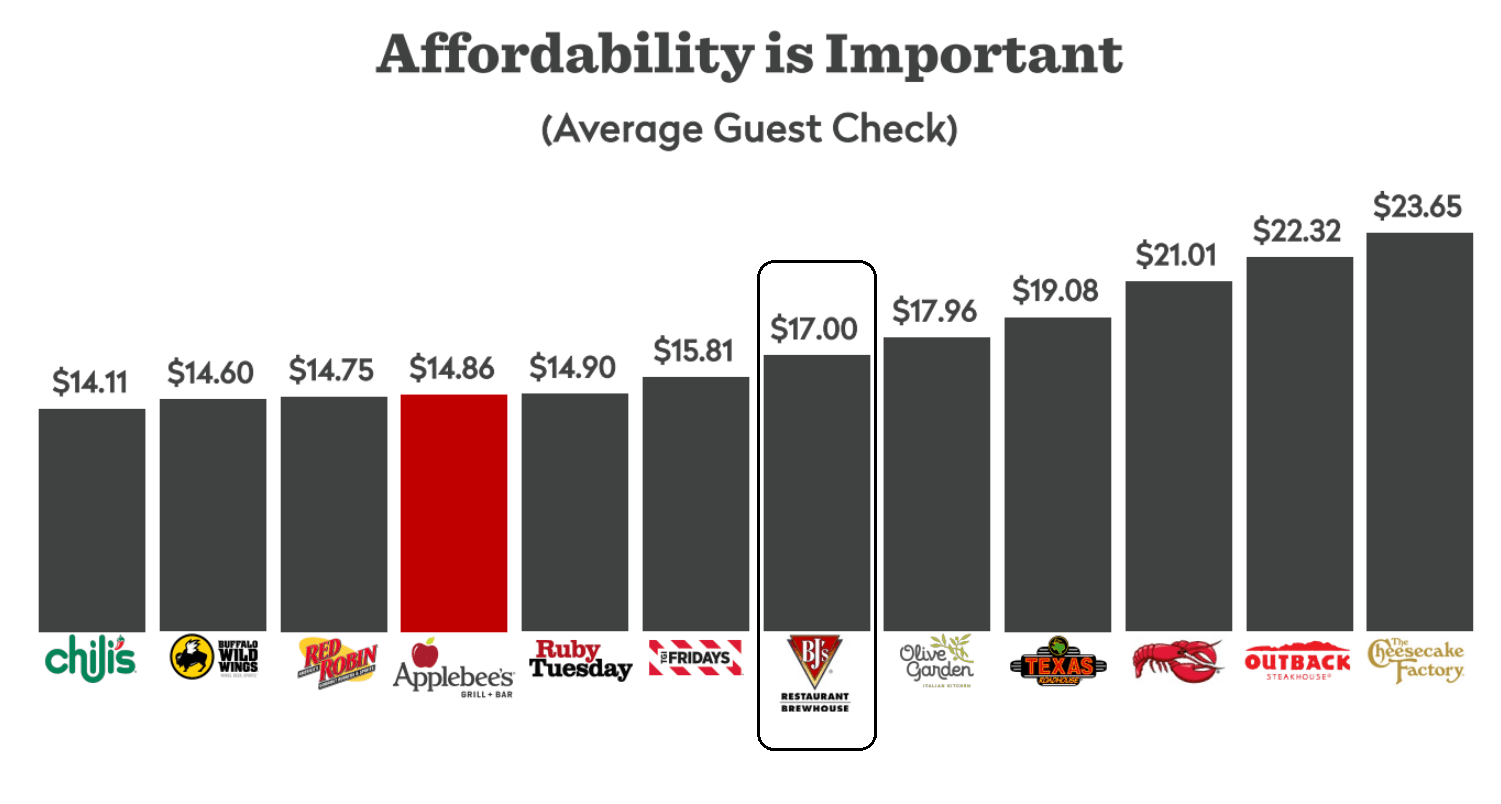
While sales outperformed my expectations in Q2, the margin performance left much to be desired. This was evidenced by labor costs being up 140 basis points to 37.3% despite the sales leverage, while its cost of sales rose to 27.6%, up 160 basis points. These figures are up sharply from Q2 2019 levels despite above-average menu price increases, with Q2 2019 figures coming in at 36.0% and 25.5%, respectively. That said, labor costs were slightly elevated in Q2 due to the hiring spree and extra training costs, with 6,000 team members added and staffing back near 2019 levels.
Still, combined with higher operating occupancy costs (23.2% vs. 21.4% in Q2 2019), restaurant-level operating margins have been beaten to a pulp, coming in at just 11.9% in the period. This represented a nearly 300 basis point decline year-over-year; year-to-date, margins are sitting at 10.9%. From a three-year standpoint, margins have fallen off a cliff, down 610 basis points from 17.0% in Q2 2019, with an even further deterioration from Q2 2018 (19.0%). So, with build costs up and margins down sharply, it may be more difficult to justify the current pace of new openings (five planned in H2).
Industry-Wide Trends & Headwinds
Moving to industry-wide trends and headwinds, inflationary pressures persisted in Q2, with BJ’s noting that they were running ahead of earlier forecasts. While we could see some moderation in costs in H2 and 2023 if fuel prices remain lower and supply chain headwinds improve, this is certainly a negative for the industry, with menu pricing barely being enough to cover the margin erosion in many cases. Looking at wholesale food prices below, the fact that inflation was above forecasted levels is no surprise, with only a marginal pullback in prices from the highs.
Wholesale Food Prices (National Restaurant Association, BLS)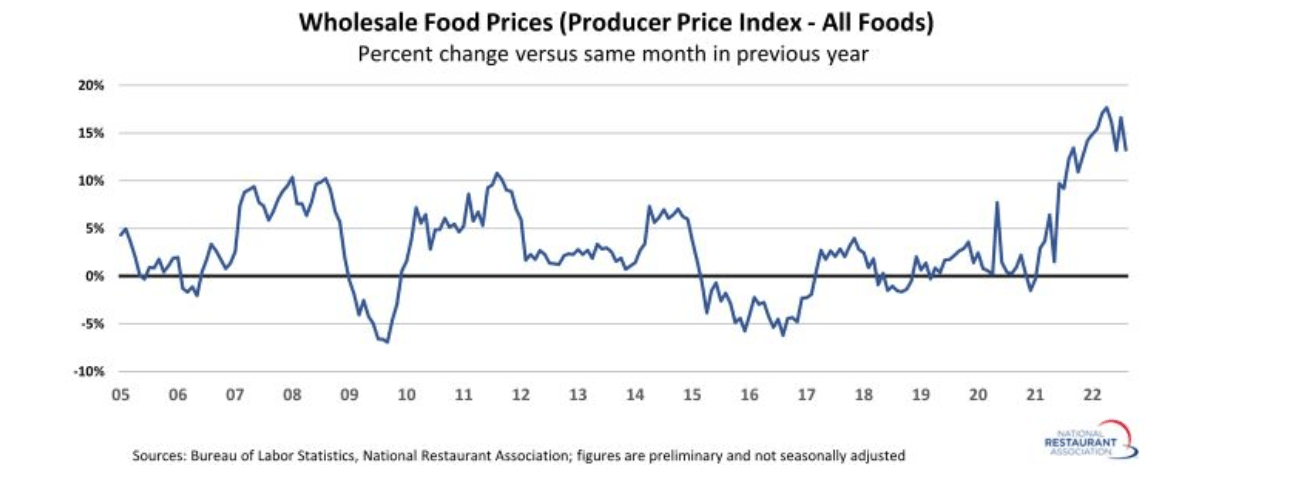
BJ’s noted that it is looking for ways to improve margins and drive retention, with things like daily pay for employees, slow-roasting its own wings, changing pack sizes for certain items to buy in bulk, and also looking at different cuts and sizes of chicken, salmon, and avocado that are less expensive to procure. This does not mean that BJ’s will be reducing its portions or providing less value, which is important because the combination of raising prices and reducing portion sizes simultaneously could backfire. That said, the company will have to be careful that the quality is the same on any new cuts of meat, even if there should be no change from a portion standpoint.
From a traffic standpoint, industry-wide traffic improved in Q2, with comp traffic down 1.9%, but a sharp improvement from the previous quarter with July traffic down 5.1%. The best performers in the period were upscale casual, with top-performing cuisine being steak and Italian, a sharp reversal from steak being the worst performer in July. The overall traffic improvement in August is good news for BJ’s and could be attributed to lower gas prices at the pump, which might have provided some relief and improvement in sentiment after an extreme pinch in discretionary budgets in May/June.
That said, with inflation elevated in August at 8.3%, we could see grocery costs continue to rise, pinching discretionary budgets. Meanwhile, the reverse wealth effect remains in full force, with nearly every asset class being beaten up this year, including housing. So, while BJ’s might have some relief in August from a sales standpoint, I would expect an ugly Q4 for the industry, with Q3 investment statements likely to be very ugly and consumers ensuring they make room for the Christmas season with personal savings rates already at extremely low levels. Let’s look at BJ’s earnings trend:
Personal Savings Rates (St. Louis Fed)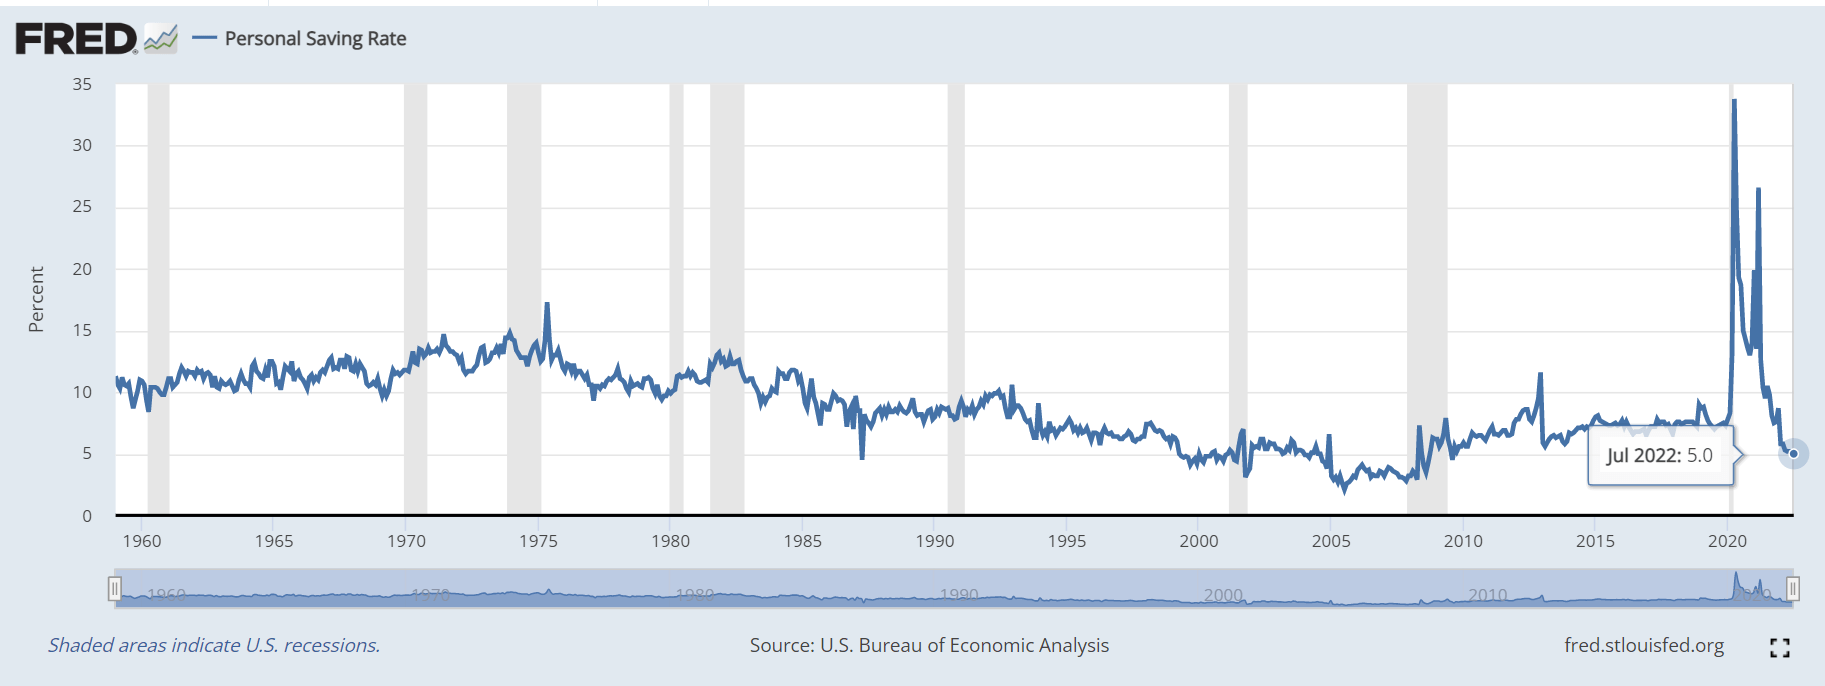
Earnings Trend
Given the margin pressure in the period and the impact of a tax expense, quarterly earnings per share declined from $0.26 in Q2 2021 to $0.01 in Q2 2022. This has pushed annual EPS estimates back into negative territory from a previous outlook of $0.40, while FY2023 annual EPS estimates have been slashed from $1.30 to $0.84. The negative revisions in earnings are not ideal, with BJ’s now being even more expensive from a valuation standpoint despite trading at lower levels. In addition, this could be the third consecutive year of net losses per share.
BJ’s – Updated Earnings Trend (YCharts.com, FactSet, Author’s Chart)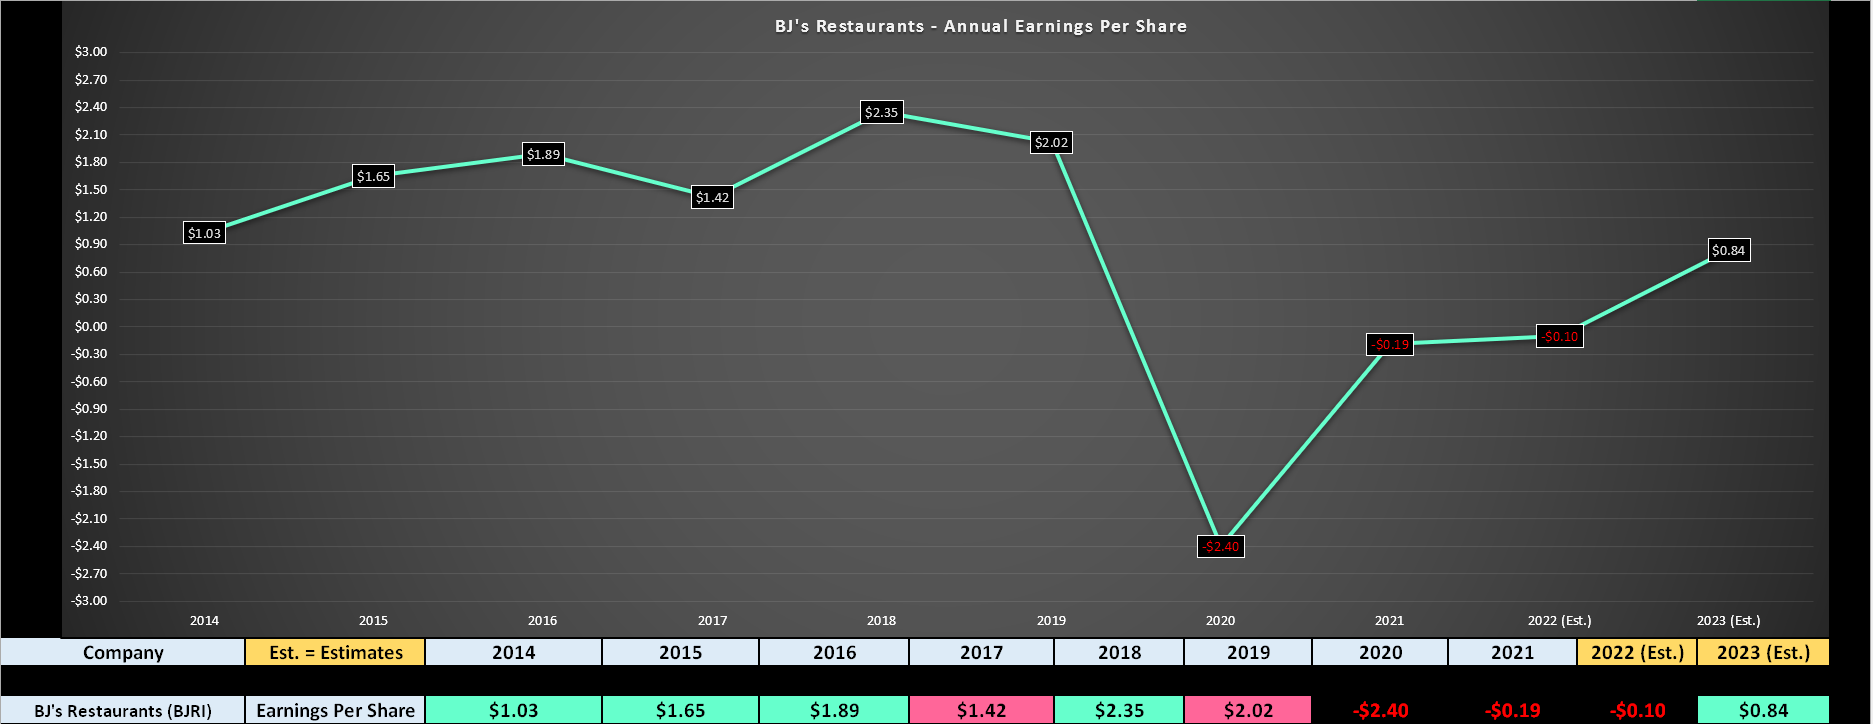
Valuation
As shown in the chart below, BJ’s has historically traded at ~23.7x earnings, and I do not believe investors should rely on this earnings multiple currently. This is because we are in a recessionary environment with the average consumer looking to be financially stressed, and restaurants continue to deal with near-unprecedented headwinds (inflationary pressures, a somewhat tighter labor market in hospitality). Finally, BJ’s earnings trend is in decline, not rising like the previous 10-year period.
BJ’s – Historical Earnings Multiple (FASTGraphs.com)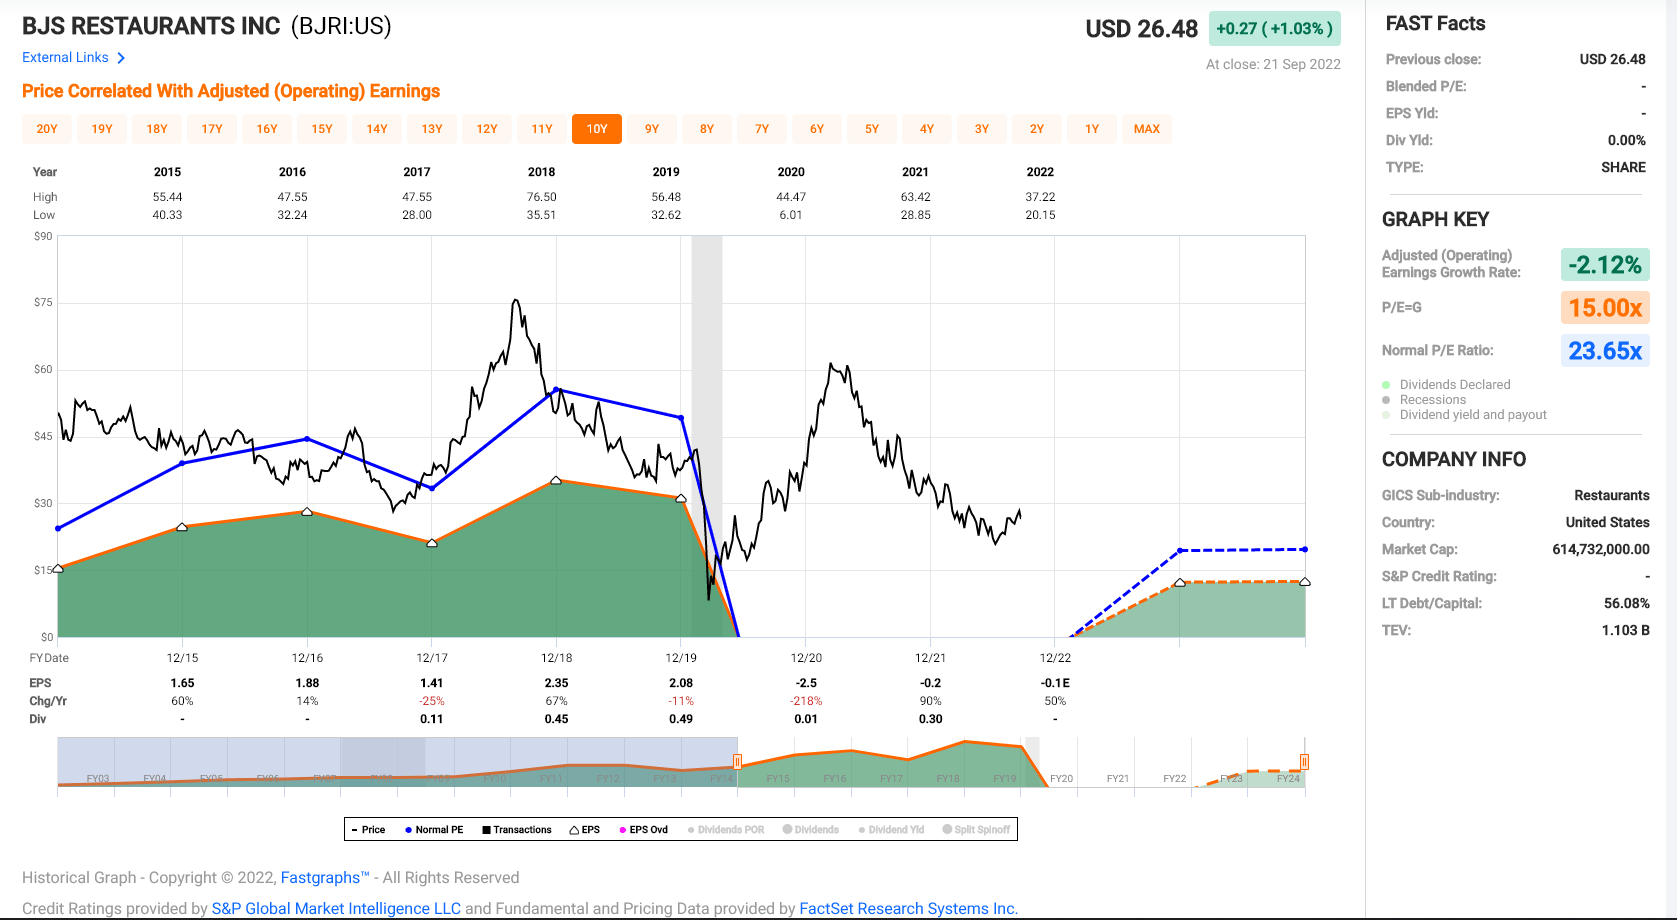
Based on this, I believe a more appropriate earnings multiple is 19, a 20% discount from the 10-year average. Based on updated annual EPS estimates of $0.84, this translates to a fair value for BJ’s of $16.00. This figure is well below current levels, and even if we assume BJ’s beats estimates due to better than expected margin performance next year, fair value still looks to be below $20.00. So, despite the 60% decline in the stock, I still don’t see any margin of safety at current levels.
Summary
BJ’s put together a decent Q2 performance from a sales standpoint, and Q3 could be alright as well, given the sharp pullback in gas prices, which does impact consumers’ views on dining out. That said, the margin compression is not pretty; inflation appears here to stay even if it’s moderating, and after two years of menu price increases for many brands, pricing power may be eroding.
Fortunately, BJ’s has priced below the industry average, giving it room to increase prices without hurting its value proposition. That said, 70% of stocks follow their industry group. If the casual dining group itself is up against considerable headwinds and many names still aren’t priced attractively enough for investment, I would be shocked if BJ’s somehow bucks the trend. Therefore, I see no reason to buy the stock at $25.80, and I would view any rallies above $27.00 as profit-taking opportunities.
Be the first to comment