

RLWPhotos
When it comes to restaurant operators, many may focus on the big players out there. But the fact of the matter is that there are a number of publicly traded restaurants that warrant some attention. An interesting example of this can be seen by looking at BJ’s Restaurants (NASDAQ:BJRI). In recent years, the financial performance of the company has been rather mixed. Although the firm continues to grow its physical footprint, comparable restaurant sales have been mixed and bottom line performance has been extremely volatile. Shares of the company do seem to be trading at fundamentally attractive levels. But given the company’s historical volatility, it’s uncertain whether the low share price the company experiences is justified. Most recently, management reported financial results covering the third quarter of the 2022 fiscal year. This data shone a bright light on the company. But only a deeper dive into the company will reveal whether it makes for an attractive purchase for shareholders or not.
BJ’s Restaurants – A niche restaurant chain
According to the management team at BJ’s Restaurants, the company first started operations in 1978 in California, operating as a small sit-down pizzeria that featured Chicago-style deep dish pizza with what management referred to as a ‘California twist’. Over time, the enterprise has evolved, eventually morphing into a large format restaurant chain with its own internal brewing operations. Today, the company’s restaurants feature an extensive menu consisting of over 100 menu items, including prime rib, salmon, pizza, and a variety of craft beers. In fact, during the 2021 fiscal year, the company internally brewed 55% of its branded craft beers, with 59% of this amount brewed in its Texas brew hub locations. The company also produces other beverages like craft soda, with flavors ranging from root beer, to ginger beer, to cream, and morph. Menu entrees typically range from as low as $7.25 to as high as $29.95, with family meals and bundles starting at $40 and going higher. During the company’s 2021 fiscal year, the average check size per customer was $19.
In terms of physical location, the company has operations spread across 29 different states. As of this writing, it has 214 restaurants across these areas. The most recent prototypes the company is working on are around 7,500 square feet in size, with seating for as many as 250 guests at full capacity. Naturally, these are not cheap restaurants to build. The average one costs between $5.5 million and $6.5 million on a gross basis, with some of that cost potentially being reimbursed in the form of incentives provided by landlords.
Author – SEC EDGAR Data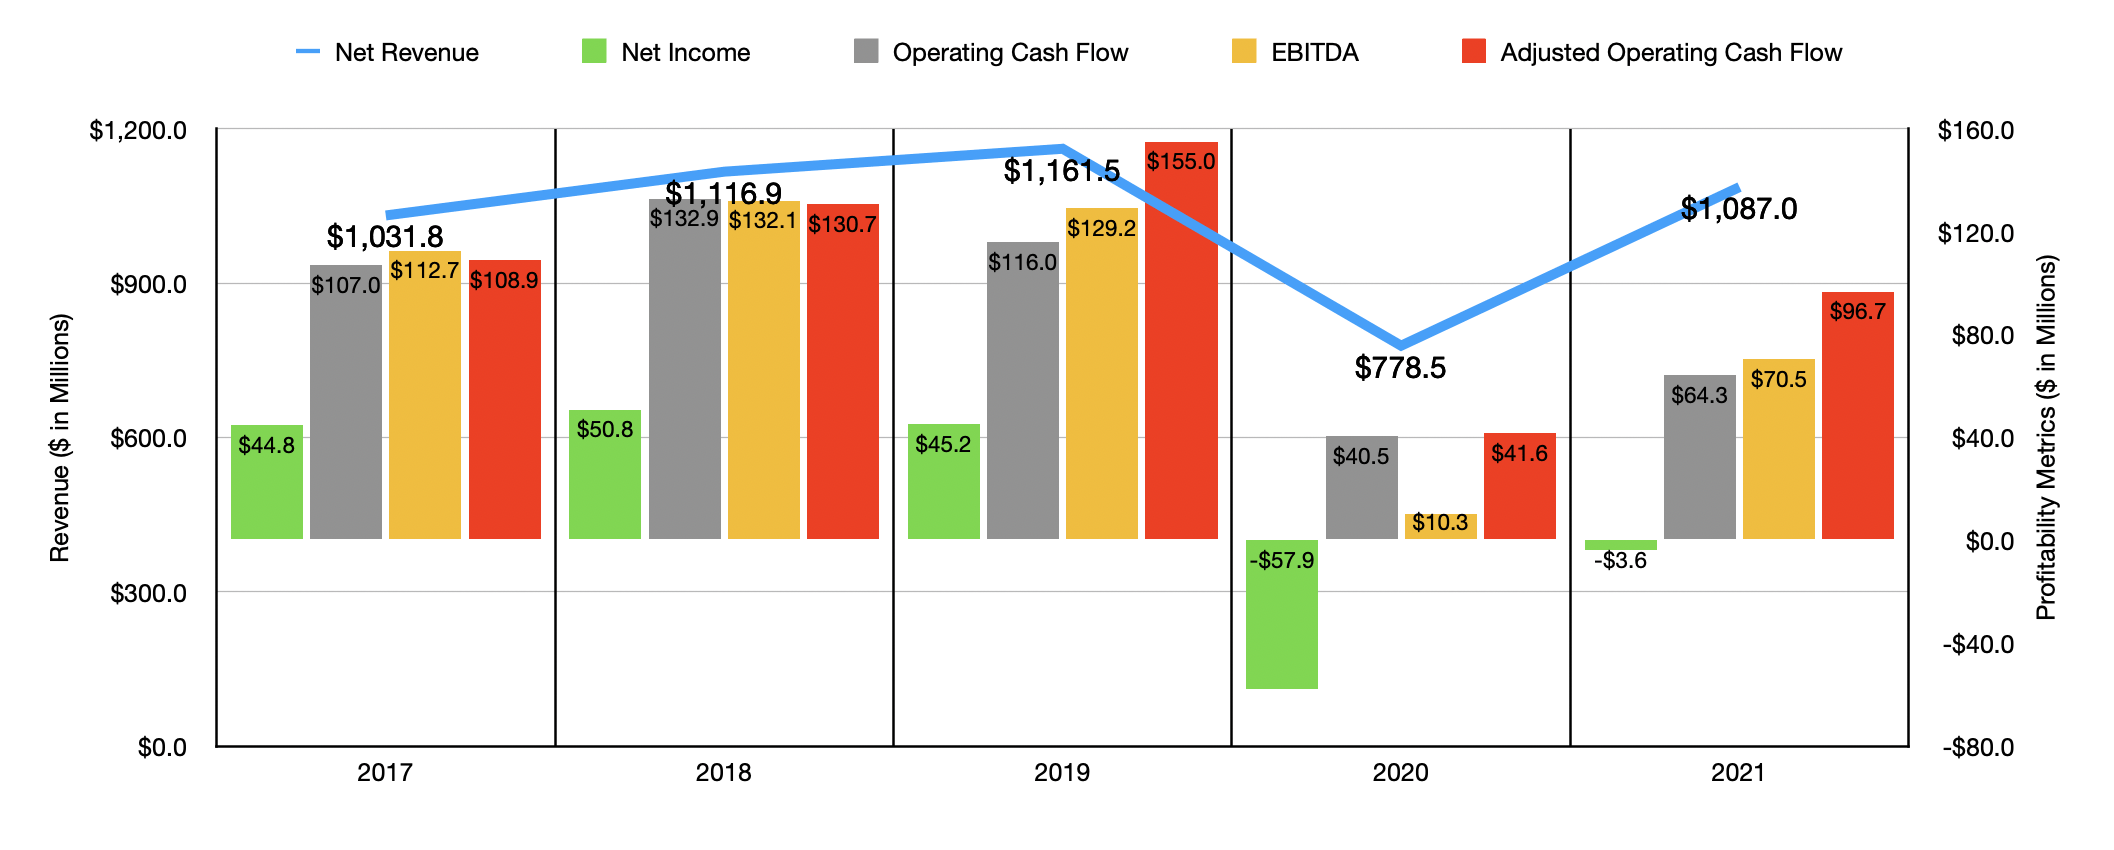
In the years leading up to the COVID-19 pandemic, revenue for the company had been expanding at a pretty consistent rate. Sales went from $1.03 billion in 2017 to $1.16 billion in 2019. Then, in 2020, revenue plummeted to $778.5 million before rebounding to $1.09 billion in 2021. The drop from 2019 to 2020 was driven by a 34% decline in comparable restaurant sales, only some of which was offset by the opening of one additional location. In general, the company has focused on growing its physical footprint over the years, with the number of locations in operation climbing from 197 in 2017 to 210 in 2020. In 2021, the sales increase was driven only marginally by a rise in store count from the 210 I mentioned to the 212 it ended that year at. The bulk of the increase came from a 38.3% surge in comparable restaurant sales.
On the bottom line, the picture has been more volatile. After seeing that income rise from $44.8 million and 2017 to $50.8 million and 2018, it then fell to $45.2 million in 2019. In 2020, the company generated a net loss of $57.9 million. And even though sales rebounded significantly in 2021, the firm still generated a net loss that year of $3.6 million. As the first chart in this article illustrates, operating cash flow for the company has also been very volatile. After peaking at $132.9 million in 2018, it eventually dropped to $40.5 million two years later. Last year, it came in slightly higher at $64.3 million. If we adjust for changes in working capital, we still would see some volatility. But at least, in this case, there would be some trend. After rising from $108.9 million in 2017 to $155 million in 2019, it fell to $41.6 million in 2020 before ultimately recovering somewhat to $96.7 million in 2021. Meanwhile, EBITDA for the company has also seen some volatility, ranging from a low point over the past five years of $10.3 million to a high point of $132.1 million. Last year, this figure came in at $70.5 million.
Author – SEC EDGAR Data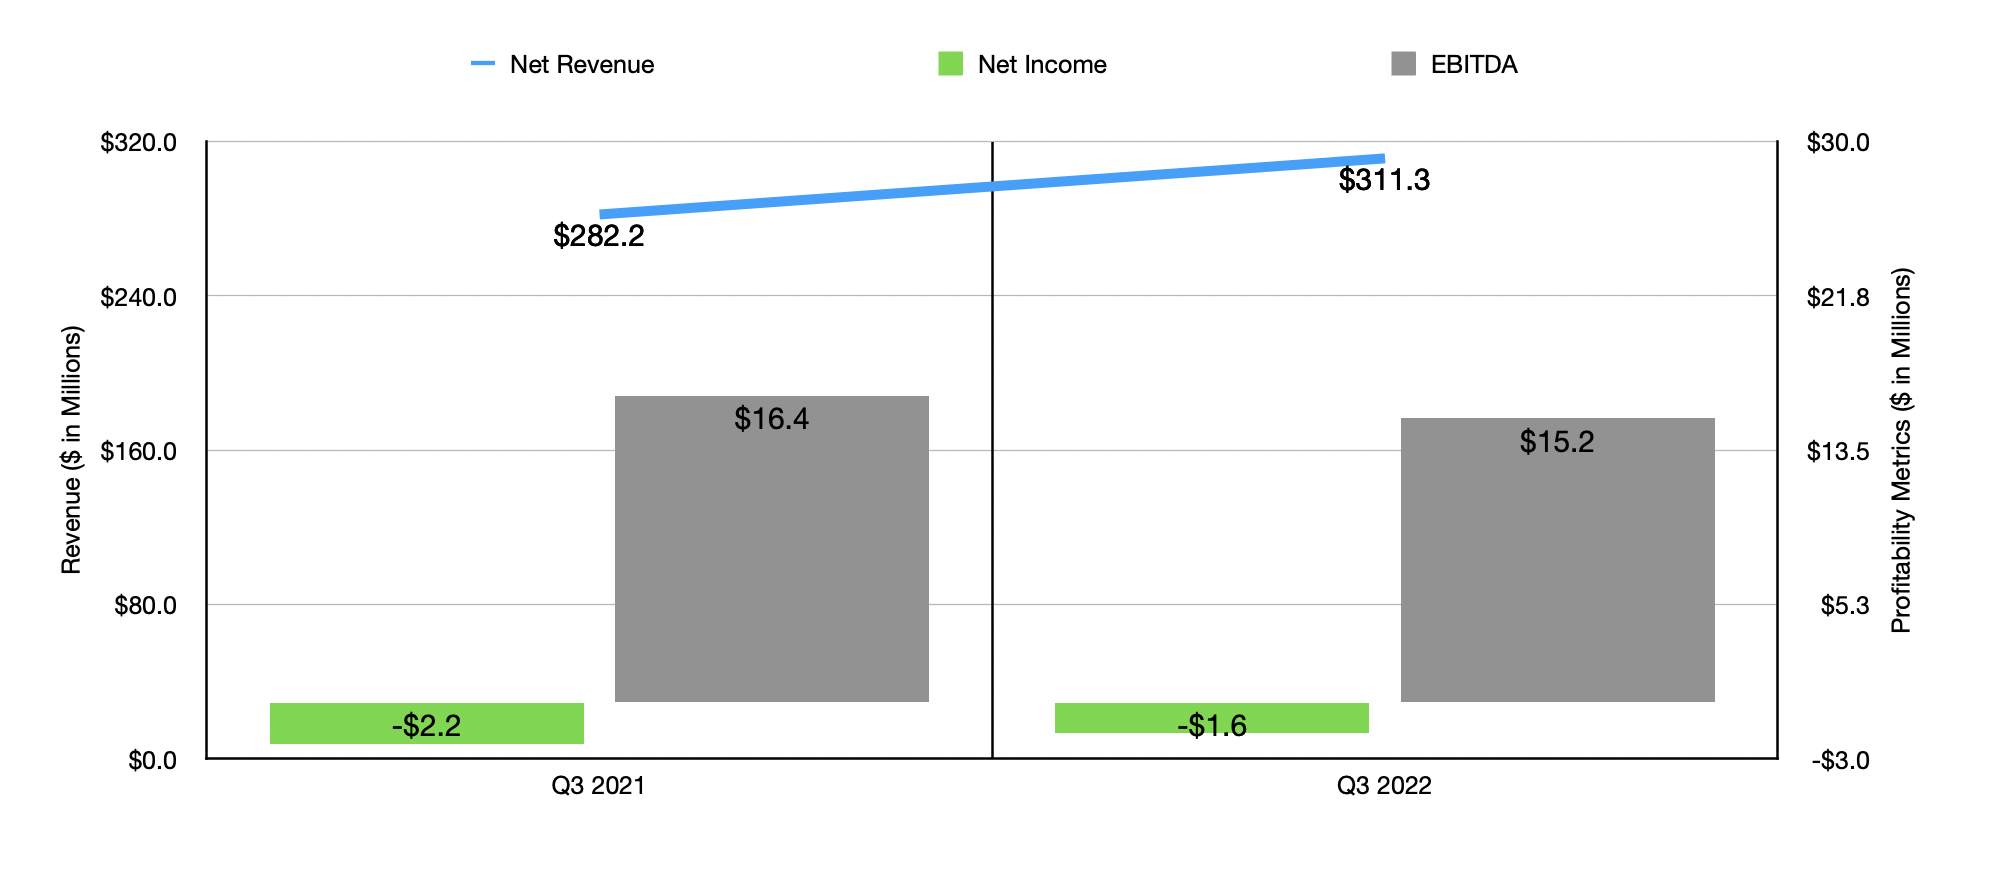
On October 20th, the management team at BJ’s Restaurants announced financial results covering the third quarter of the company’s 2022 fiscal year. During that quarter, sales for the company came in strong at $311.3 million. In addition to coming in 10.3% higher than the $282.2 million generated the same quarter last year, it also was $7.66 million above what analysts anticipated. In addition to benefiting from a two-store increase to its portfolio, the company benefited tremendously from an 8.9% rise in comparable restaurant sales. This strong performance helped results for the first nine months of the 2022 fiscal year, with revenue of $939.8 million coming in 18.1% above the $795.8 million generated at the same time of the 2021 fiscal year. Once again, the increase in store count helped. But the big driver was a 16.9% rise in comparable restaurant sales. In addition to the company being somewhat impacted by the COVID-19 pandemic in early 2021, there have also been a variety of other factors at play such as inclement weather that have created some volatility and results.
Author – SEC EDGAR Data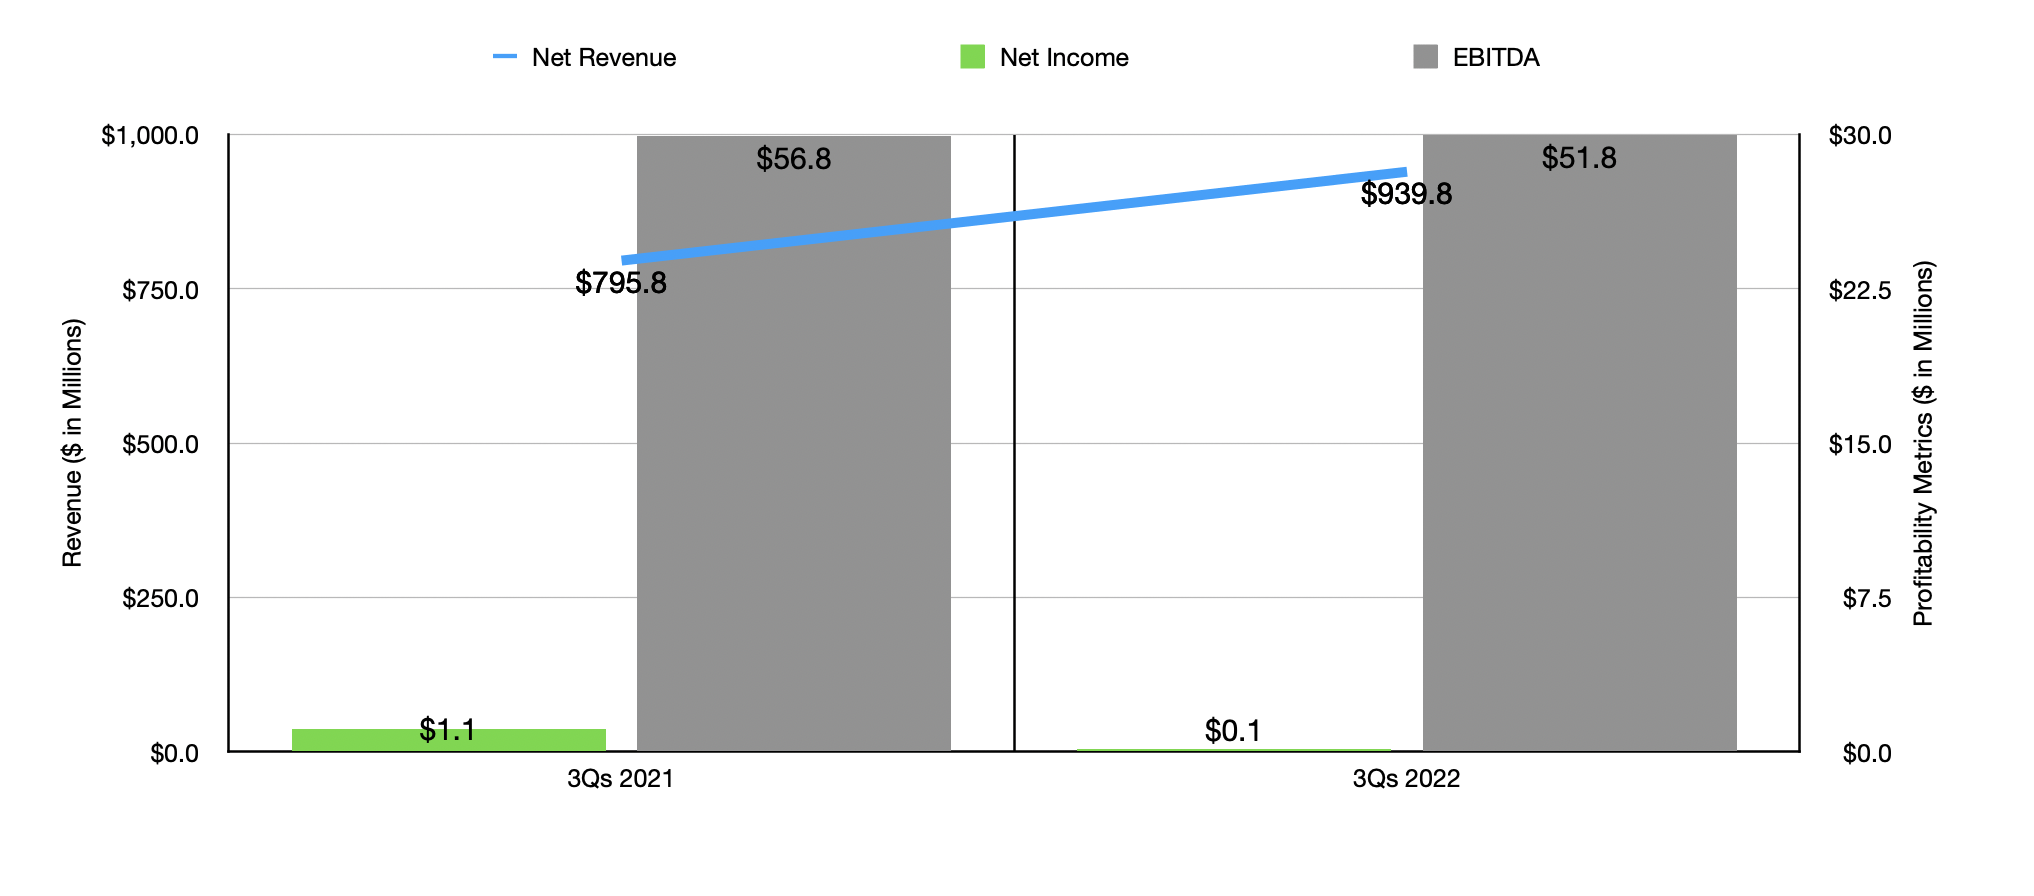
On the bottom line, the company seems to be doing better than analysts anticipated as well. The loss per share reported was $0.07 during the latest quarter. Although painful, this was better than what analysts were expecting to the tune of $0.18 per share. It also beat the $0.09 per share loss the company achieved in the third quarter of 2021. Total net loss for the quarter came in at $1.6 million. That compares to the $2.2 million loss experienced the same time last year. Unfortunately, no data was given when it came to operating cash flow. After all, the company has not yet filed its 10-Q. But we do know that EBITDA fell slightly year over year, dropping from $16.4 million to $15.2 million. For the year-to-date period, results are still worse than I would like, with net income of $0.1 million coming in lower than the $1.1 million profit seen during the first three quarters of 2021 and EBITDA dropping from $56.8 million to $51.8 million.
Author – SEC EDGAR Data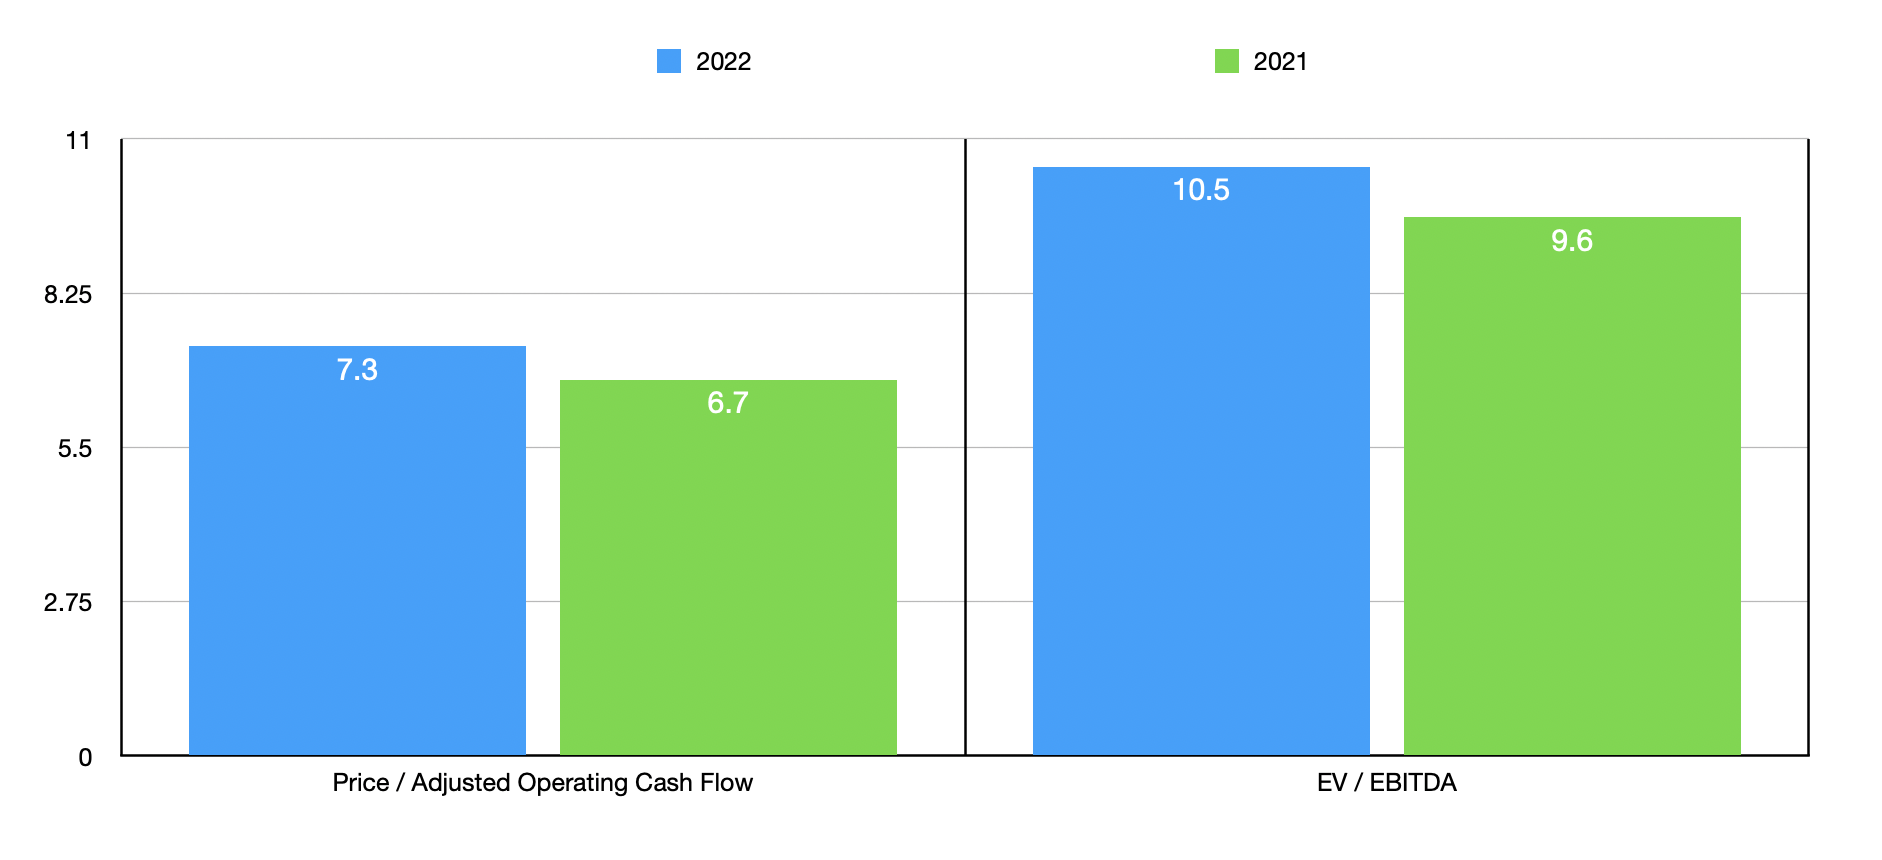
In the long run, management has some pretty high hopes for the company. They ultimately are targeting 425 domestic locations in the future, with those locations generating around $2 billion in annual revenue. But the big question is what the company might be worth today. Unfortunately, management has not offered any real guidance for the current fiscal year. But if we annualize the results experienced so far, we should anticipate EBITDA of $64.3 million. Applying that same year-over-year change to adjusted operating cash flow, we would get a reading of $88.2 million. This implies a forward price to adjusted operating cash flow multiple of 7.3 and a forward EV to EBITDA multiple of 10.5. Using the data from 2021 instead, we would end up with multiples of 6.7 and 9.6, respectively. As part of my analysis, I also compared the company to five similar firms. On a price-to-operating cash flow basis, these companies ranged from a low of 9.4 to a high of 35.9. In this case, BJ’s Restaurants was the cheapest of the group. Meanwhile, using the EV to EBITDA approach, the range was between 4.7 and 344.1. In this scenario, four of the five prospects were cheaper than our target.
| Company | Price/Operating Cash Flow | EV/EBITDA |
| BJ’s Restaurants | 7.3 | 10.5 |
| Ruth’s Hospitality Group (RUTH) | 10.1 | 9.5 |
| Denny’s (DENN) | 15.3 | 4.7 |
| Kura Sushi USA (KRUS) | 35.9 | 344.1 |
| Chuy’s Holdings (CHUY) | 12.9 | 6.6 |
| El Pollo Loco Holdings (LOCO) | 9.4 | 8.2 |
Takeaway
Based on all the data I’m looking at today, I don’t feel particularly bullish when it comes to BJ’s Restaurants. Although the company continues to grow its physical footprint, financial results have been rather volatile. That includes bottom line results this year as the company struggles with cost increases. How shares are priced is rather mixed when we compare the company to similar players. But on an absolute basis, I would say that shares are affordably priced. But given how much volatility we have seen in the past for the company, even ignoring what transpired during the pandemic years, I see this as a rather mediocre company trading at what might be a fair price given the performance it has achieved. Because of this, I feel rather neutral on the company, leading me to rate it a ‘hold’ at this time.
Be the first to comment