

monsitj
Introduction
In July 2022, I wrote a bullish article on SA about Friedman Industries (NYSE:FRD) in which I said that the future was looking bright as the new facility in Sinton was expected to bring in EBITDA of about $5 million per year and the company should be worth at least $15 per share. That price target is equal to about 1x P/TBV at the moment.
This is my largest holding at the moment, and I think it’s a good time to take another look at Friedman Industries considering it recently released its financial results for Q2 FY23. In my view, the results were somewhat mixed. On one hand, falling hot-rolled coil (HRC) steel prices led to a significant decrease in inventories which pushed the cash flow from operating activities (CFO) to $76 million, which is higher than the company market valuation which stands at $66 million as of the time of writing. On the other hand, I was disappointed by the net income. You see, the comprehensive income came in at $4 million with the tubular division saving the day with an operating profit of $3.3 million. Profit from hedging activities was $5.3 million, with cash flow hedges adding $1.6 million. Considering how much HRC steel prices have slid between July and September, I was expecting a better result from hedging activities. Let’s review.
Overview of the Q2 FY23 results
In case you haven’t read any of my previous articles about Friedman Industries, here’s a brief description of the business. The company is involved in steel processing and pipe manufacturing and is among the leading steel service center operators in the US following the Q2 2022 acquisition of two coil processing facilities of Plateplus. Friedman Industries paid $63.8 million in cash and issued 516,041 shares for these facilities and the deal was closed in April. Fixed assets accounted for about $18 million of the purchase price and the remainder is attributable to steel inventory. Friedman got steel inventory and customer relationships from two other facilities, which had a combined production of 113,000 tons for the year ended March 2022.
Friedman Industries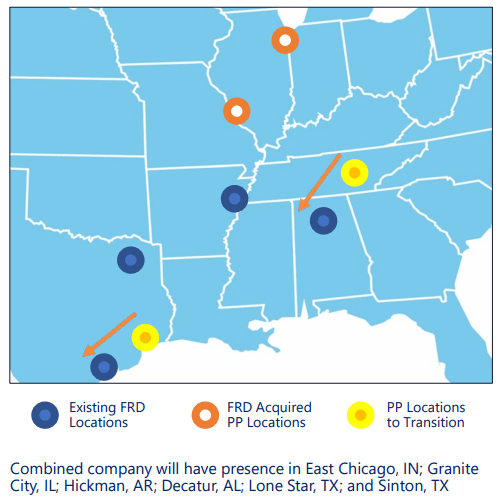
In my view, this acquisition will help Friedman Industries with the ramp-up of its Sinton hot-rolled coil processing facility. Capital expenses for the latter stood at $22 million and it was put into production at the end of October 2022 (see page 9 here). The facility is expected to ramp up production during the remainder of FY23, with annual shipments for FY24 forecast to be in the range of 110,000 tons to 140,000 tons.
Friedman Industries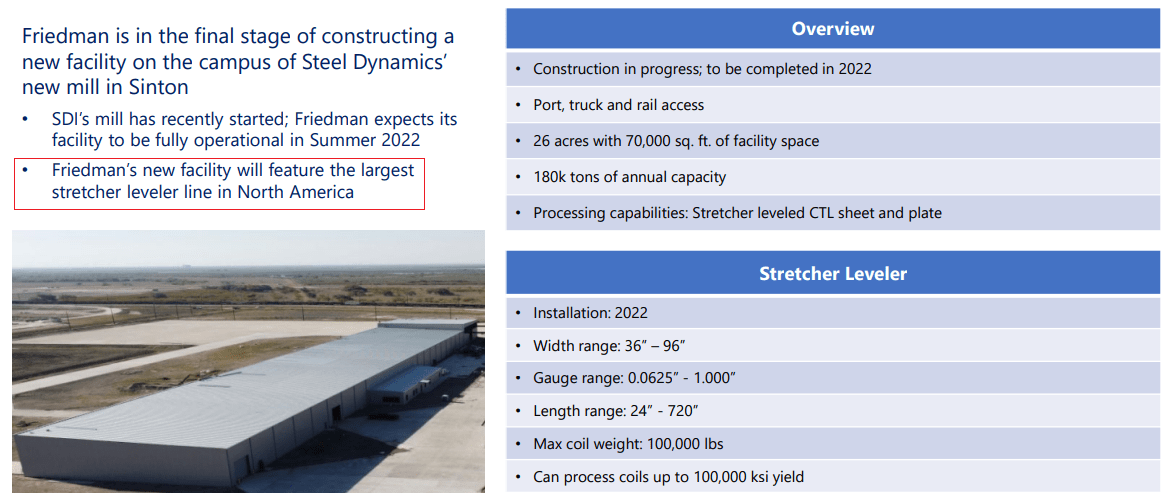
Back in November 2021, Friedman Industries said it expected the Sinton facility to generate EBITDA of $4.5 million to $5.5 million per year based on historical average margins. However, it has to be noted that this statement was made at a time when HRC prices were above $1,600/t following an unprecedented increase.
Trading Economics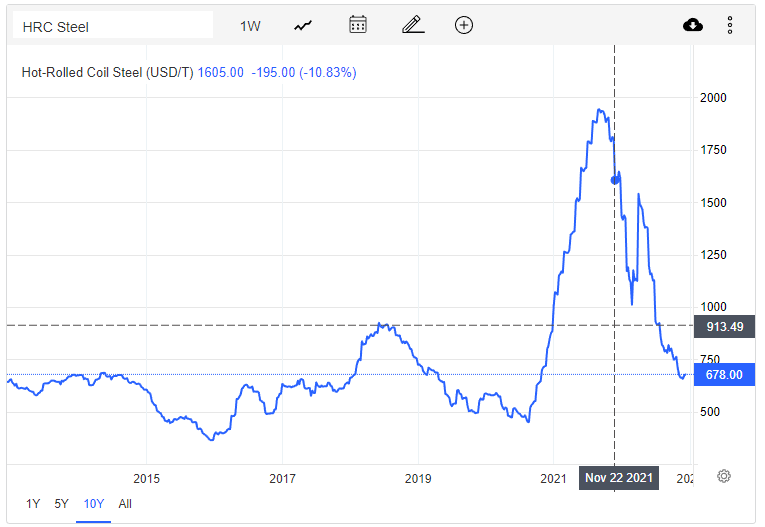
The HRC steel price increases started in early 2021 following a shortfall in flat steel supply and Russia’s invasion of Ukraine started just as the market was getting back to normal. Well, we’re back below $700/t now as supply chain issues are pretty much resolved and recession fears mount but it seems that further price decreases are unlikely. Argus Media recently reported that U.S. Steel (NYSE:X) raised its HRC steel prices in the US by $60/short ton, following the lead of Cleveland-Cliffs (CLF). The former is now targeting base pricing of $680-700/st as multiple steelmakers are approaching their breakeven points.
Historically, Friedman Industries has had a low-margin business and its financial performance has been strong when HRC steel prices were high (FY19, FY21, and FY22) or when there was high demand for pipes from the oil and gas sector due to high energy prices (FY13).
Friedman Industries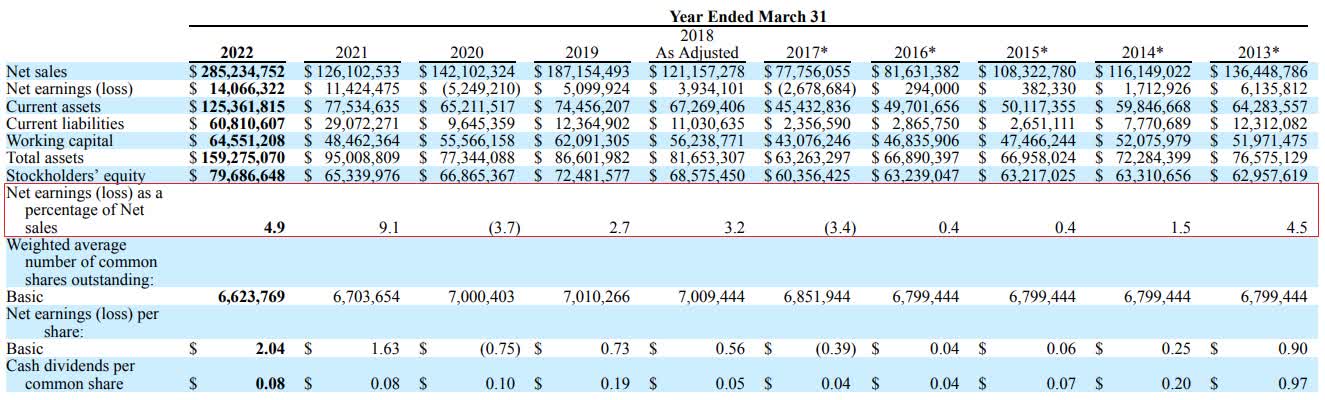
The company is rarely in the red and the few exceptions are usually due to one-off items. E.g., the FY20 results included a $4.3 million impairment loss on a pipe finishing facility while the FY17 loss can be attributed to the application of the LIFO method of accounting within the coil segment.
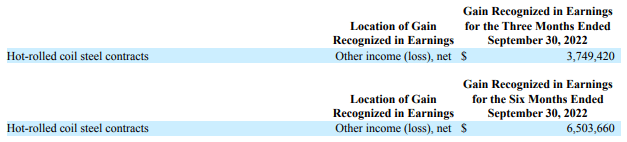
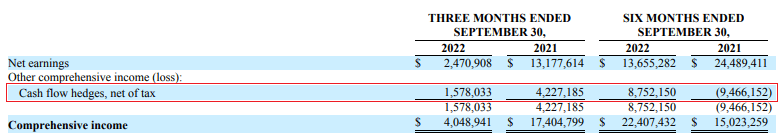
Turning our attention to the Q2 FY23 financial results, we can see that the tubular segment had strong results once again thanks to strong demand from the oil and gas sector. The coil segment was in the red, but this was compensated for by $3.8 million of other income, which includes gains related to derivatives not designated for hedge accounting. In addition, cash flow hedges added another $1.6 million to the net income, bringing the comprehensive net income for the three months ended September to $4 million.
Overall, the hedging measures softened the impact of lower HRC steel prices during the period, although not as much as would’ve liked considering the stronger effect they had on results a year ago.
Friedman Industries Friedman Industries Friedman Industries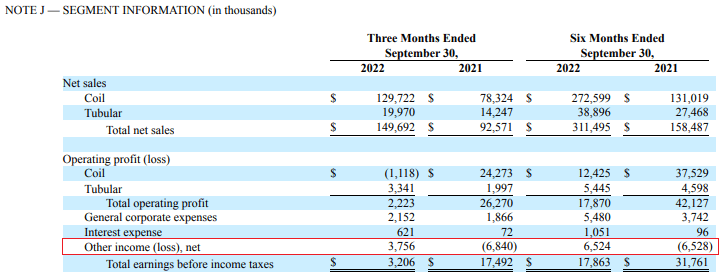
Overall, the hedging measures softened the impact of lower HRC steel prices during the period, although not as much as would’ve liked considering the stronger effect they had on results a year ago.
The silver lining is that lower HRC steel prices led to a quarter-on-quarter slump in inventories and receivables by 35.3 million and $22.5 million, respectively. This means that the CFO for Q2 FY23 alone was $76 million, bringing the total for the first half of FY23 to $54.7 million. As you can see from the table below, the situation looked bad a year ago as high net income didn’t translate into a positive CFO due to rising inventories and receivables as a result of high HRC steel prices.
Friedman Industries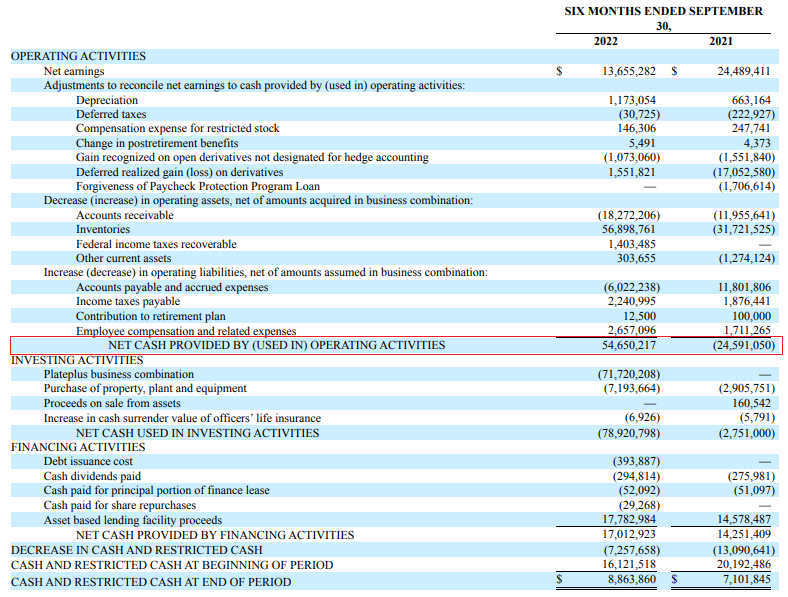
Net debt is down to $29.7 million and I expect it to decrease further in Q3 FY23 as the CFO should benefit from another decrease in HRC steel prices. Since September 30, HRC prices have declined by another $91/t.
Looking at the forecasts for this quarter, Friedman Industries expects the sales volume to drop to 105,000 tons from 108,500 tons due to the holidays (page 17 here). Considering the Sinton facility is now in operation, I find this forecast underwhelming. Looking at what to expect from the financial results, Friedman Industries forecasts a slight margin improvement as well as a boost from hedging activities (see page 21). I’m optimistic that the comprehensive income could be higher compared to Q2 FY23 as the notional amount of derivative instruments not designated as hedging instruments at the end of September included 5,160 tons of long positions with maturity dates ranging from October 2022 to December 2022 and 41,460 tons of short positions with maturity dates ranging from October 2022 to December 2023 (see page 11).
Overall, I continue to think that Friedman Industries is undervalued and I’m keeping my $15 per share price target. Looking at the risks for the bull case, I think that there are three major ones. First, a global recession coupled with low energy prices could lead to a stretch of low profitability (just like FY14-FY17). Second, the ramp-up of the Sinton facility could take longer than forecast, which would negatively impact financial results. Third, we don’t know the exact timing of the company’s hedges, which means that the comprehensive income in Q3 FY23 could be lower than expected.
Investor takeaway
In my view, Friedman Industries posted good results for Q2 FY23 considering how much HRC steel prices have declined. The tubular division is performing well and the company’s hedging policy should keep the company in the black in Q3 FY23. With the CFO benefitting from lower inventories and receivables, I expect the net debt to be much lower at the end of December.
Overall, the company seems significantly undervalued as it’s trading at a P/TBV ratio of just 0.6x. I have no plans to sell below $15 per share or about 1x P/TBV.
Be the first to comment