

adaask
Both Ares Capital Corp (NASDAQ:ARCC) and Owl Rock Capital Corp (NYSE:ORCC) have investment grade (BBB- Stable from S&P) credit ratings, vaulting them into the upper echelon of quality Business Development Companies (i.e., BDCs) (BIZD). Both also happen to offer mouthwatering dividend yields, with ARCC boasting a 9% dividend yield and ORCC boasting a 10% dividend yield.
In this article we will compare them side by side and offer our take on which one is a better buy.
Balance Sheet
As was already stated, both ARCC and ORCC have the same investment grade credit rating and outlook from S&P, which puts them on similar footing in terms of perceived risk and access to capital.
ORCC has $1.7 billion in total liquidity (~14.5% of its enterprise value) with a leverage ratio of 1.17x. 29% of ORCC’s capital structure is negatively exposed to rising interest rates.
ARCC, meanwhile, has $5.9 billion in total liquidity (~30.5% of its enterprise value) and a leverage ratio of 1.06x. Only ~11% of ARCC’s capital structure is negatively exposed to rising interest rates.
While both appear to be in solid shape, ARCC seems to clearly have the stronger balance sheet.
Investment Portfolio
ORCC’s portfolio consists of 89% senior secured debt and 99% of its debt investments are floating rate, meaning that 90% of the total portfolio is floating rate debt. ORCC’s portfolio is overweight more defensive sectors, with its top five sectors being software, financial services, insurance, food and beverages, and healthcare. Non-accruals were very low as of 3/31/22 with just 0.1% at fair value and 0.2% at cost.
ARCC’s portfolio is well positioned for rising interest rates and potentially even an economic downturn, with strong interest coverage of 2.9x and loan to values of just ~44%. Despite a 300-basis point increase in LIBOR rates, ARCC’s interest coverage ratio is expected to remain above 2x. 71% of its portfolio is senior secured debt, its average position size is 0.3%, and its largest investment is less than 1.5% of its total portfolio. 74% of its total portfolio is in floating rate investments. ARCC’s non-accruals were just 1.2% at cost. Finally, its top 5 industries are all relatively defensive, including software, healthcare, financials, commercial and professional services, and insurance services.
Both businesses appear very well positioned to benefit from rising interest rates, with ORCC’s management stating on its most recent earnings call:
To summarize, given almost all of our assets are floating and only 29% of our capital structure is floating, we expect rising rates may have a slightly negative impact in the second quarter, but will result in a meaningful net positive impact on NII starting in the second half of 2022. For example, all else equal, a 100 basis point rate increase would generate approximately $0.04 per share in quarterly NII after considering the impact of income-based fees.
Meanwhile, ARCC’s CEO stated after their most recent earnings call:
As of quarter end, holding all else equal and after considering the impact of income-based fees, we calculated that a 100-basis point increase in short-term rates could increase our annual earnings by approximately $0.23 per share, a 14% increase above this quarter’s core EPS run rate.
A 200-basis point increase in short-term rates could increase our total annual earnings by approximately $0.44 per share, a 26% increase above this quarter’s core EPS run rate.
Both portfolios have their strengths. ARCC’s is more diversified, and the company has a longer and more established track record of excellence, while ORCC’s non-accruals rate is 100 basis points lower and has a meaningfully greater percentage of its investment portfolio in senior secured debt.
While it is extremely close, we are going to give a slight edge to ORCC here, though we also recognize that ARCC has a tremendous track record. However, given that we have a separate section for that, we will just stick with objective evaluation of the numbers here.
Dividend Safety
ORCC generated $0.31 in net investment income per share in its most recent quarter while paying out the exact same sum as a dividend. While the dividend coverage was tight, management noted that it was likely a one-time event given that they had very little repayment income due to a seasonally quieter M&A environment.
ARCC’s dividend coverage was also pretty tight during the most recent quarter due to seasonal patterns. It generated $0.42 in core income, which also matched its dividend payout during the quarter. However, management emphasized that its dividend is quite safe still and it even paid out a $0.03 special dividend during the quarter due to its large amount of spillover income:
We currently estimate that our spillover income from 2021 into 2022, will be approximately $651 million or $1.32 per share. We believe having a strong and meaningful undistributed spillover supports our goal of maintaining a steady dividend throughout market cycles and sets us apart from many other BDCs that do not have this level of spillover.
While both businesses seem to be at a similar point of barely covering their quarterly dividend with cash flow, this should improve moving forward due to a combination of seasonality and rising interest rates. Given that both businesses are poised to benefit similarly from rising interest rates, we give the edge in dividend safety to ARCC because it has more spillover income, and it also has a bit stronger of a balance sheet.
Track Record
ARCC has a hands-down better track record than ORCC, as it has crushed ORCC since ORCC went public:
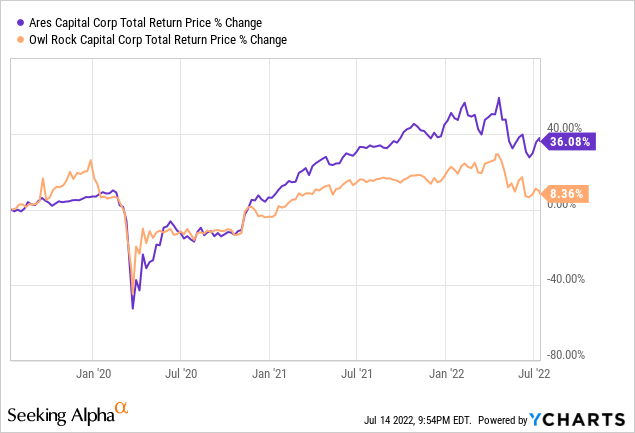
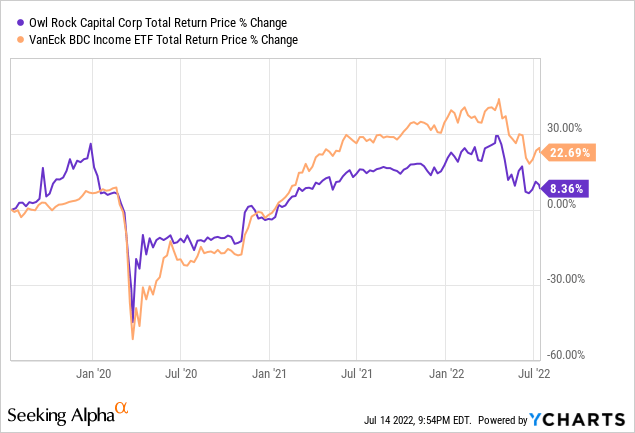
ORCC has significantly trailed behind the broader BDC sector over that time span:
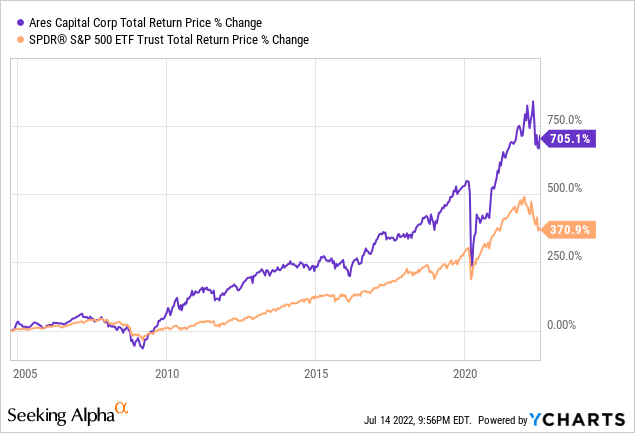
ARCC has also crushed the market (SPY) since it went public:
Valuation
ORCC does have some valuation items going for it, however. First and foremost, its dividend yield is 102 basis points higher than ARCC’s. Second, ARCC currently trades at a 0.37% discount to NAV, whereas ORCC trades at a much wider 15.66% discount to NAV. Last, but not least, according to CEFdata.com, its expense ratio is 9.61% compared to ARCC’s 10.61% expense ratio, giving it a 100-basis point edge there as well. Across the board, ORCC is clearly cheaper than ARCC.
Investor Takeaway
Unsurprisingly, this comes down to a competition between value and quality. When it comes to portfolio quality, ORCC holds its own very well against ARCC and in fact has a slight edge at the moment. However, ARCC has a stronger balance sheet overall and its vastly superior track record imply that if economic conditions deteriorate from here, ARCC’s lower leverage, greater experience, and superior diversification may well cause its portfolio to outperform ORCC’s. On the other hand, ORCC’s cheaper valuation, higher dividend yield, and lower expense ratio all give it a meaningful margin of safety. Ultimately, we rate both BDCs a Buy, but in the current uncertain environment, we would rather bet on ARCC’s safer dividend and superior track record.
Be the first to comment