

EXTREME-PHOTOGRAPHER
Moderately high loan growth will boost the earnings of BCB Bancorp, Inc. (NASDAQ:BCBP) through the end of 2023. On the other hand, higher operating expenses will restrict earnings growth. Meanwhile, the margin will likely remain unchanged despite the ongoing up-rate cycle. Overall, I’m expecting BCB Bancorp to report earnings of $2.62 per share for 2022 and $2.73 per share for 2023. Compared to my last report on the company, I’ve raised my earnings estimates for both years, mostly because I’ve increased my loan growth estimate for 2022. Next year’s target price suggests a high upside from the current market price. Therefore, I’m maintaining a buy rating on BCB Bancorp.
Further Margin Expansion is Unlikely
BCB Bancorp’s net interest margin expanded by 44 basis points in the third quarter after growing by 28 basis points in the second quarter of 2022. This is in sharp contrast to the trend in previous years. BCB Bancorp’s margin actually declined in the last up-rate cycle from the fourth quarter of 2015 to the fourth quarter of 2018, as shown below. Therefore, I am not hopeful that the margin will continue to expand in the coming quarters.
SEC Filings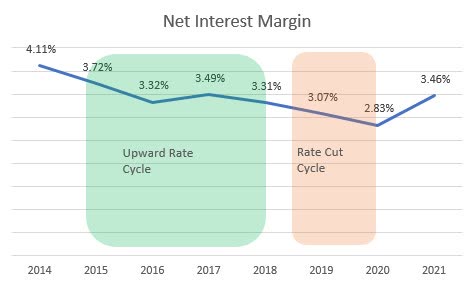
One of the major reasons why BCB Bancorp was able to expand its margin this time around was that it was able to keep its funding costs subdued. The average funding cost for the third quarter of 2022 was reported at 0.64%, which is below the average cost of 0.66% for the third quarter of 2021, as mentioned in the third quarter’s 10-Q filing. In my opinion, the company can’t maintain this cost for much longer as depositors might get tempted to switch to more appeasing banks. Further, a large part of the deposit book is comprised of adjustable-rate deposits. These deposits, namely savings, interest-bearing demand, and money market accounts, made up 55% of total deposits during the quarter that ended September 2022.
Considering these factors, I’m expecting the margin to remain unchanged through the end of 2023 from 4.18% in the third quarter of 2022.
Loan Growth to Remain at a Decent Level Even After Declining
BCB Bancorp’s loan growth remained much higher than the historical average during the third quarter of 2022, thereby maintaining the outstanding growth momentum witnessed so far this year. However, high borrowing costs will likely soon trigger mean reversion in the loan growth trend. Residential real estate loans, which make up 9% of total loans, are likely to be most affected by higher borrowing costs.
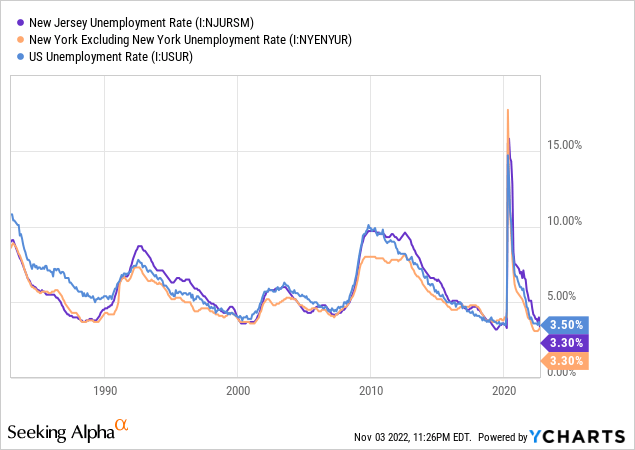
On the other hand, satisfactory economic activity will keep loan growth from dipping too low. BCB Bancorp operates in the states of New York and New Jersey. With the exception of New York City, most of the state of New York is doing quite well. New Jersey also has an unemployment rate that’s better than the national average.
Further, BCB Bancorp has entered into an agreement with Q2 to enhance its digital capabilities, as mentioned in a press release. I’m expecting this investment in the digital banking platform to slowly and steadily grow the balance sheet. Ease of credit offtake will encourage borrowers to return to BCB Bancorp for their financial needs in the future. However, I’m not expecting this initiative to serve as a sudden, out-of-the-ordinary catalyst.
Overall, I’m expecting the loan portfolio to grow by 1% every quarter till the end of 2023. This will lead to loan growth of 22% for 2022 and 4% for 2023. Compared to my last report on BCB Bancorp, I’ve revised upwards my loan growth estimate for 2022 mostly because the third quarter’s growth beat my expectations.
Meanwhile, I’m expecting other balance sheet items to grow mostly in line with loans. The following table shows my balance sheet estimates.
| FY18 | FY19 | FY20 | FY21 | FY22E | FY23E | |
| Financial Position | ||||||
| Net Loans | 2,278 | 2,178 | 2,228 | 2,305 | 2,815 | 2,929 |
| Growth of Net Loans | 38.6% | (4.4)% | 2.3% | 3.5% | 22.1% | 4.1% |
| Other Earning Assets | 305 | 621 | 360 | 514 | 325 | 338 |
| Deposits | 2,181 | 2,362 | 2,318 | 2,561 | 2,740 | 2,851 |
| Borrowings and Sub-Debt | 282 | 296 | 243 | 122 | 264 | 275 |
| Common equity | 181 | 214 | 223 | 245 | 267 | 300 |
| Book Value Per Share ($) | 11.5 | 13.1 | 13.1 | 14.2 | 15.4 | 17.3 |
| Tangible BVPS ($) | 11.2 | 12.7 | 12.7 | 13.9 | 15.1 | 17.0 |
| Source: SEC Filings, Earnings Releases, Author’s Estimates (In USD million unless otherwise specified) | ||||||
Earnings to Surge by 37% in 2022
The anticipated loan additions discussed above will likely be the chief earnings driver through the end of 2023. On the other hand, high inflation will boost non-interest expenses, which will, in turn, restrict earnings growth. Further, the investments in technology and digital platforms will also keep non-interest expenses elevated in the coming quarters. Due to the high inflation and investments, I’m expecting the efficiency ratio (operating expenses divided by total revenue) to surge to 46.0% by the fourth quarter of 2023 from 41.5% in the third quarter of 2022.
Meanwhile, I’m expecting the provision expense to make up around 0.22% of total loans in 2023, which is close to the average for the last five years. Further, I’m expecting the margin to remain unchanged from the third quarter’s level.
Considering these factors, I’m expecting BCB Bancorp to report earnings of $2.62 per share for 2022, up 37% year-over-year. For 2023, I’m expecting earnings to grow by 4% to $2.73 per share. The following table shows my income statement estimates.
| FY18 | FY19 | FY20 | FY21 | FY22E | FY23E | |
| Income Statement | ||||||
| Net interest income | 78 | 83 | 80 | 97 | 116 | 131 |
| Provision for loan losses | 5 | 2 | 9 | 4 | (1) | 6 |
| Non-interest income | 8 | 5 | 12 | 9 | 2 | 6 |
| Non-interest expense | 56 | 56 | 54 | 54 | 53 | 62 |
| Net income – Common Sh. | 16 | 20 | 20 | 33 | 45 | 47 |
| EPS – Diluted ($) | 1.01 | 1.20 | 1.14 | 1.92 | 2.62 | 2.73 |
| Source: SEC Filings, Earnings Releases, Author’s Estimates (In USD million unless otherwise specified) | ||||||
In my last report on BCB Bancorp, I estimated earnings of $2.41 per share for 2022 and $2.54 per share for 2023. I’ve increased my earnings estimates for both years, mostly because I’ve raised my estimates for loan balances.
Please note that actual earnings may differ materially from estimates because of normal risks and uncertainties involved with forecasting.
Maintaining a Buy Rating
BCB Bancorp is offering a dividend yield of 3.3% at the current quarterly dividend rate of $0.16 per share. The earnings and dividend estimates suggest a payout ratio of 23% for 2023, which is much below the five-year average of 52%. Therefore, there is room for a dividend hike. Nevertheless, I’m not expecting an increase in the dividend level because the company seldom changes its payout.
I’m using the historical price-to-tangible book (“P/TB”) and price-to-earnings (“P/E”) multiples to value BCB Bancorp. The stock has traded at an average P/TB ratio of 1.02 in the past, as shown below.
| FY18 | FY19 | FY20 | FY21 | Average | ||
| T. Book Value per Share ($) | 11.2 | 12.7 | 12.7 | 13.9 | ||
| Average Market Price ($) | 14.4 | 12.7 | 10.0 | 14.2 | ||
| Historical P/TB | 1.29x | 1.00x | 0.79x | 1.02x | 1.02x | |
| Source: Company Financials, Yahoo Finance, Author’s Estimates | ||||||
Multiplying the average P/TB multiple with the forecast tangible book value per share of $17.0 gives a target price of $17.4 for the end of 2023. This price target implies a 9.8% downside from the November 3 closing price. The following table shows the sensitivity of the target price to the P/TB ratio.
| P/TB Multiple | 0.82x | 0.92x | 1.02x | 1.12x | 1.22x |
| TBVPS – Dec 2023 ($) | 17.0 | 17.0 | 17.0 | 17.0 | 17.0 |
| Target Price ($) | 14.0 | 15.7 | 17.4 | 19.1 | 20.8 |
| Market Price ($) | 19.3 | 19.3 | 19.3 | 19.3 | 19.3 |
| Upside/(Downside) | (27.4)% | (18.6)% | (9.8)% | (0.9)% | 7.9% |
| Source: Author’s Estimates |
The stock has traded at an average P/E ratio of around 10.3x in the past, as shown below.
| FY18 | FY19 | FY20 | FY21 | Average | ||
| Earnings per Share ($) | 1.01 | 1.20 | 1.14 | 1.92 | ||
| Average Market Price ($) | 14.4 | 12.7 | 10.0 | 14.2 | ||
| Historical P/E | 14.3x | 10.6x | 8.8x | 7.4x | 10.3x | |
| Source: Company Financials, Yahoo Finance, Author’s Estimates | ||||||
Multiplying the average P/E multiple with the forecast earnings per share of $2.73 gives a target price of $28.1 for the end of 2023. This price target implies a 45.9% upside from the November 3 closing price. The following table shows the sensitivity of the target price to the P/E ratio.
| P/E Multiple | 8.3x | 9.3x | 10.3x | 11.3x | 12.3x |
| EPS 2023 ($) | 2.73 | 2.73 | 2.73 | 2.73 | 2.73 |
| Target Price ($) | 22.6 | 25.4 | 28.1 | 30.8 | 33.6 |
| Market Price ($) | 19.3 | 19.3 | 19.3 | 19.3 | 19.3 |
| Upside/(Downside) | 17.5% | 31.7% | 45.9% | 60.1% | 74.3% |
| Source: Author’s Estimates |
Equally weighting the target prices from the two valuation methods gives a combined target price of $22.7, which implies an 18.1% upside from the current market price. Adding the forward dividend yield gives a total expected return of 21.4%. Hence, I’m maintaining a buy rating on BCB Bancorp.
Be the first to comment