

Jitalia17
It has been almost a year since I reviewed the iShares Core Growth Allocation ETF (NYSEARCA:AOR), a comparatively low-cost multi-asset fund providing exposure to the classic 60/40 portfolio favored by investors for decades.
AOR’s significant tilt towards equities is supposed to capture some upside from rising share prices during bull markets. At the same time, around 40% allocation to both U.S. and international fixed income keeps risk in check as bonds are, in theory, negatively correlated with stocks. When investors rotate out of equities causing prices to decline, the former should chug along, also bringing income and thus reducing the downside and keeping portfolios afloat.
However, the pandemic market raised the question of whether it is worth rethinking the 60/40 allocation. Most vocal critics even claimed the model is dead, and there is no place for it in the future of investing, explaining it is poised for years if not decades of lackluster performance. Hawkish 2022 has added to the difficulties.
Yet, though there are reasons to steer clear of stock/bond mixes with large exposure to credit, I still see advantages in AOR’s strategy. They are relatively lower volatility and mostly lower drawdowns compared to pure equity plays. Nevertheless, a bullish rating would be unjustified.
AOR has underperformed since the previous article
In the previous note published on September 11, 2021, I concluded that AOR is capable of achieving capital preservation, though it is close to impossible for it to consistently beat U.S. equities given the meaningful weight allocated to bonds. Unfortunately, it has surprised to the downside since then, underperforming the S&P 500 by a few percentage points.
Seeking Alpha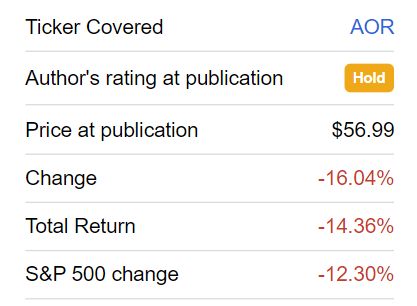
Speaking of YTD, its performance has been rather lackluster as its investment strategy betting on the inverse correlation between bonds and stocks offered little protection against inflation and rising interest rates; however, its total return has still been marginally stronger compared to the iShares Core S&P 500 ETF (IVV) even despite the fact that FX risk was a drag on its performance, which was certainly not the case for the pure U.S. plays. Its peers from the allocation cohort playing with different stock/bond proportions, from the iShares Core Moderate Allocation ETF (AOM) to iShares Core Conservative Allocation ETF (AOK), have all fared better than IVV, with only iShares Core Aggressive Allocation ETF (AOA) delivering almost similar result owing to its almost 80% exposure to stocks.
Seeking Alpha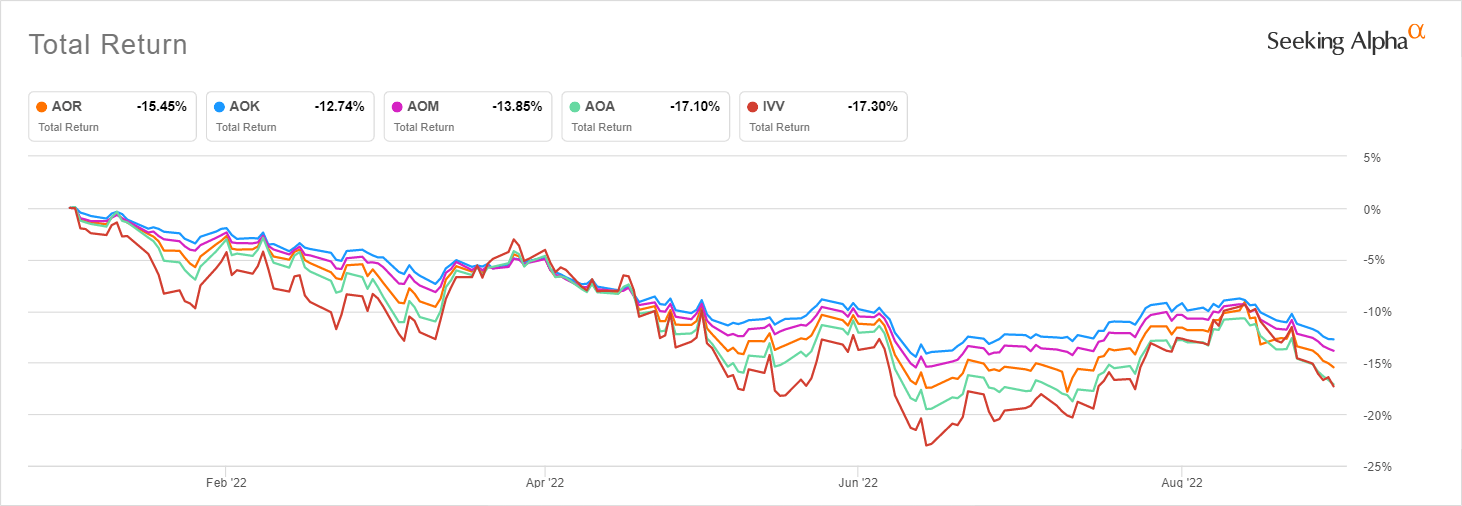
What do investors get for 25 bps? Portfolio structure recap
Diversified across the two major classes with material exposure to the U.S. heavyweight equity universe, AOR is a fund of funds with 7 iShares ETFs in its portfolio. Its primary purpose is to track the S&P Target Risk Growth Index; the basket is rebalanced biannually to revert allocations back to the 60/40 proportion. I addressed the methodology in greater depth in the previous article.
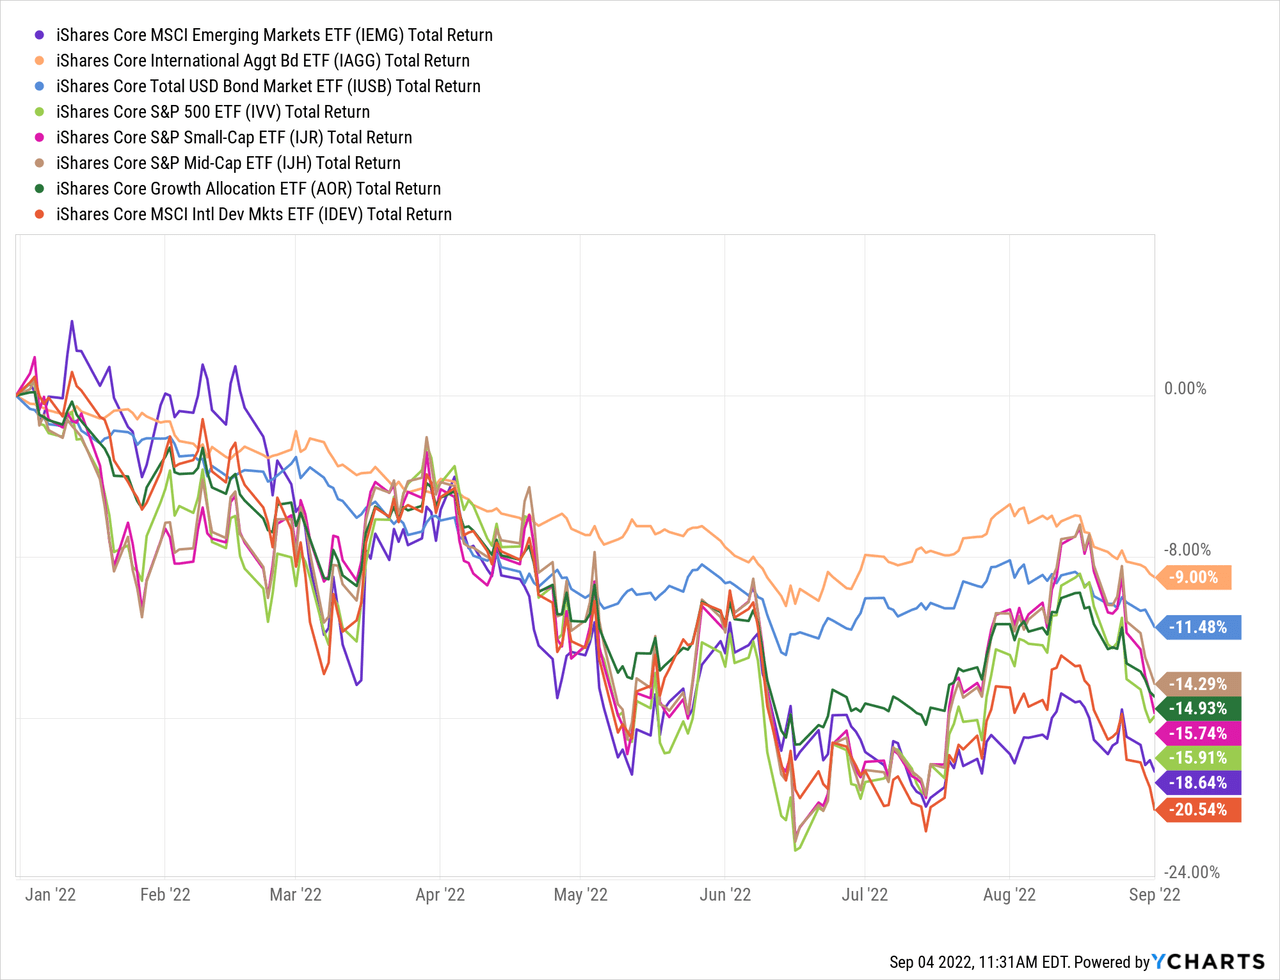
In essence, for 25 bps, investors get exposure to approximately 25,675 different assets, a phenomenal level of diversification, with Apple (AAPL) and Microsoft (MSFT) being the largest investments with a combined weight of 4.2% via the iShares Core S&P 500 ETF (IVV). Apart from the upper echelon, AOR has also allocated capital to the mid- and small-size U.S. equity cohorts, namely the iShares Core S&P MidCap ETF (IJH) and iShares Core S&P SmallCap ETF (IJR), though a fairly minor share of only ~2.8% combined. U.S. fixed income is represented by the iShares Core Total USD Bond Market ETF (IUSB), while iShares Core International Aggregate Bond ETF (IAGG) adds DM and EM bonds to the mix. Developed world equities are represented by the iShares Core MSCI International Developed Markets ETF (IDEV). China-heavy iShares Core MSCI Emerging Markets ETF (IEMG) extends AOR’s footprint to emerging markets.
In terms of countries, AOR is pronouncedly U.S. heavy, with around 64.4% allocation. Japan comes second, sporting 4.6% weight, followed by the United Kingdom with 3.2%.
Is AOR a Buy?
As it can be seen below, ~40% allocation to bonds has certainly made sense this year as the depth of their decline has not been that steep compared to U.S. equities, let alone DM and EM stocks that have been suffering from depreciating currencies that, in fairness, defied my even most bearish expectations, especially the euro. Interestingly, though also impacted by FX, Japan-heavy IAGG has the best YTD return in the group. The reason is that the BoJ is in the rush to rise rates as inflation remains subdued.
So is the fund a Buy? I am of the opinion portfolios like AOR are better to avoid, at least at this juncture and at least by short-to-medium-term investors. This is not only because my investment horizon is comparatively short at the moment and my risk appetite is comparatively high.
The issue is that the risk picture for stock/bond portfolios does not look favorable right now. First and foremost, it is tough to forecast for how long interest rates in the U.S. will remain elevated. In my view, the message send during the Jackson Hole symposium was crystal clear. The Fed will do what is necessary to balance demand and supply. And the capital shortage is not a matter investors can easily ignore. Higher rates mean a stronger dollar for longer, declining bond prices, and some pain for the equity universe owing to growth premia reassessment. There is another wild card, a recession.
Yet in case a full-scale recession is hopefully warded off, inflation creeps meaningfully lower after peaking (my hypothesis here is that it has already peaked in the U.S.), developed and emerging world currencies recuperate as yield differentials narrow and the economic pain recedes, AOR could deliver meaningful upside. But it is far from being fully certain that it can beat racier U.S. bellwethers. And I am not that courageous to time that moment right now.
But a few words can still be said in defense of this investment vehicle. In fact, as I said in the previous note, AOR is designed to preserve capital in the first place, not deliver outstanding gains the S&P 500 league can only envy. This implies it should have lower drawdowns and, more likely, lower volatility. And in fairness, the fund is less volatile than pure-equity plays like IVV, though the standard deviation is a bit higher compared to its peers with larger shares of bonds. Let us illustrate this with a table.
Created by the author using data from Portfolio Visualizer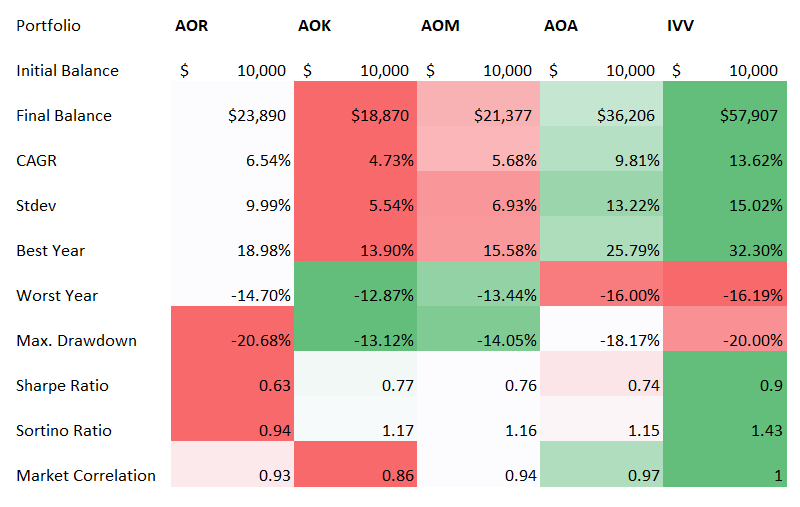
On the downside, when it comes to risk-adjusted returns, its lower volatility is not supportive of a better result, which is a significant disappointment. Over the period assessed (December 2008 – August 2022), its Sharpe and Sortino ratios are close to being the worst in the group. Also, a surprise is that the fund somehow managed to deliver a max drawdown that is weaker compared to IVV. Please do note that ‘the worst year’ in the table above stands for 2022. Oddly enough, it was not 2008, when IVV declined by a staggering 37%; it can be explained by the fact that this ETF series was incepted in November 2008, and only data for December was included in the analysis above.
I have also assessed a shorter, the pandemic- and the trade war-dominated period, of the last three years.
Created by the author using the data from Portfolio Visualizer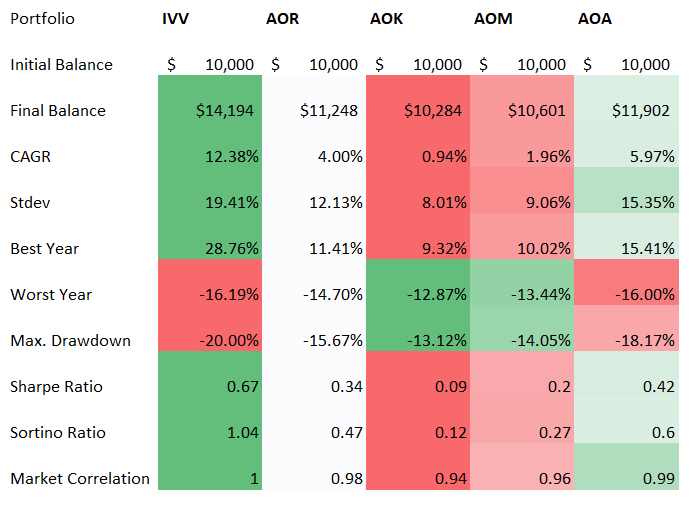
In sum, AOR together with its allocation peers may be considered an instrument to lower portfolio volatility and reduce downside risk a bit over the long term. However, this is not enough in my view. Thus, I assign it a Hold rating.
Be the first to comment