

MACRO PHOTO/iStock via Getty Images
Financial Metrics
AMD Financial Segments
For the Q1 2022 period ending March 26, Advanced Micro Devices (NASDAQ:AMD) reported record revenue of $5.9 billion. That represented 71% YoY growth and 22% QoQ.
In the Computing and Graphics segment, the company achieved record Revenue of $2.8 billion, up 33% YoY, driven by Ryzen and Radeon processor sales.
In the Enterprise, Embedded and Semi-Custom segment, record revenue was $2.5 billion, up 88% YoY and 13% QoQ, driven by record EPYC processor, semi-custom and embedded revenue.
Texas Instruments Financial Segments
Analog is Texas Instruments’ (NASDAQ:TXN) (TI’s) largest segment, with 2021 revenue of $14.05 billion, or about 77% of total company revenue. The global analog market was about $74 billion in 2021, so TI holds a 19% share and the leading position in this market.
Embedded Processing is also one of TI’s core businesses, with 2021 revenue of $3.05 billion, or about 17% of total company revenue. The global embedded market was about $22 billion in 2021, so TI holds a 14% share.
Analog chips and grew 33.1% YoY in 2021, greater that the other categories, and represent about 15% of the overall global integrated circuit market, and primarily include Amplifiers/Comparators (Signal Conditioning), Signal Conversion, Interface, and Power Management ICs.
Are AMD And Texas Instruments Direct Competitors?
Commonality with Embedded Platforms
AMD’s Embedded Processors for embedded platforms include
- AMD Embedded EPYC CPUs,
- AMD Embedded Ryzen V-Series APUs, CPUs and SoCs,
- AMD Embedded Ryzen R-Series APUs, CPUs and SoCs,
- AMD Embedded Ryzen G-Series SoC platform and
- AMD Embedded Radeon GPUs.
These embedded processors and GPUs are designed to support high performance and bandwidth network connectivity and security, high-performance storage requirements for enterprise and cloud infrastructure, 3D graphics performance and 4K multimedia requirements of automotive infotainment systems.
TI’s Embedded Processing segment includes microcontrollers, digital signal processors (DSPs) and applications processors. Microcontrollers are self-contained systems with a processor core, memory and peripherals that are designed to control a set of specific tasks for electronic equipment. DSPs perform mathematical computations almost instantaneously to process or improve digital data. Applications processors are designed for specific computing activity.
TI has more than 4,000 embedded processors and controllers on its books”
- Digital Signal Processors & Controllers – DSP, DSC (875 different processors/controllers in portfolio)
- Microcontrollers – MCU (3,081 different controllers)
- Microprocessors – MPU (225 different processors)
- Processors – Application Specialized (43 different processors)
- Systems on a Chip – SoC (70 different SOCs)
There is undoubtedly some overlap in chip end applications as seen in Chart 1. A detailed comparison of individual chips per end application is beyond the scope of this article, particularly when trying to decipher the specific use of TI’s more than 4000 processor products. But that analysis is not germane to this article anyway.
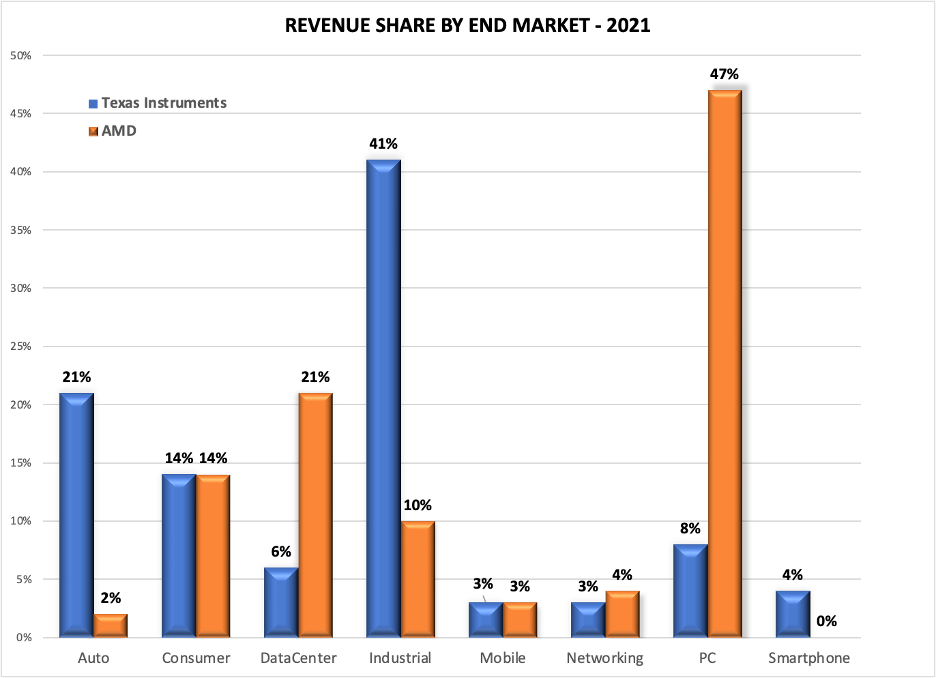
The Information Network
Chart 1
Thus, AMD’s competition with TXN is not at the same as with Intel (INTC) in PC processors or NVIDIA (NVDA) in GPUs.
I discussed PCs in a May 11, 2022 Seeking Alpha article entitled “AMD Reported Record Revenue: Is AMD Stock A Good Buy During A Dip?”
I discussed GPUs in a May 23, 2022 Seeking Alpha article entitled “Nvidia Stock: What To Consider Ahead Of Earnings.”
Investor Takeaway
Is AMD or TXN Stock A Better Buy?
Chart 2 shows a 3-year price change for AMD and TXN showing that AMD’s share performance over TXN is more than 4X greater.
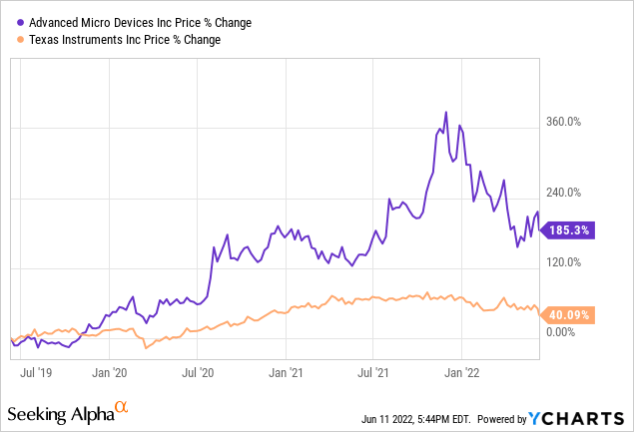
YCharts
Chart 2
Chart 3 shows that AMD outperformed the S&P Technology Select Sector Index (IXT) over the past 3-year period but TXN underperformed.
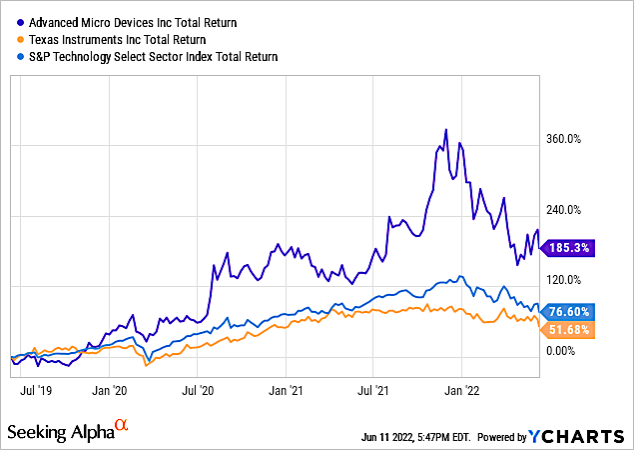
YCharts
Chart 3
AMD and TXN Stock Key Metrics
Chart 4 shows Ratings for AMD and TXN. AMD has a Strong Buy Quant Rating versus a hold for TXN.
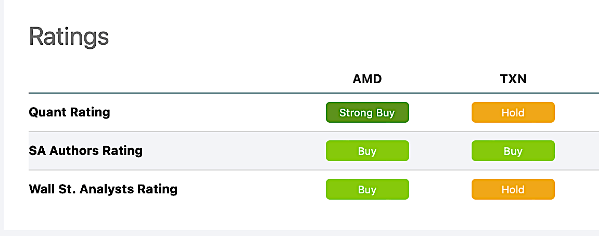
Seeking Alpha
Chart 4
Seeking Alpha’s Quant Rankings are shown in Chart 5. AMD is ranked 3 out of 64 companies in the Semiconductor Industry compared to 37/64 for TXN.
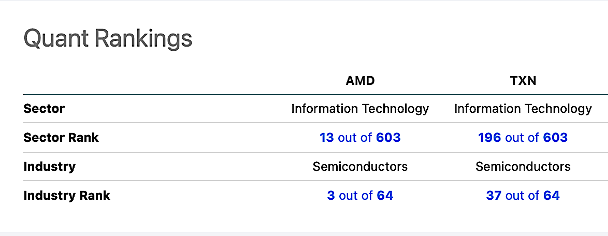
Seeking Alpha
Chart 5
Chart 6 shows Seeking Alpha’s Quant Factor Grades, showing significantly better performance for AMD versus TXN.
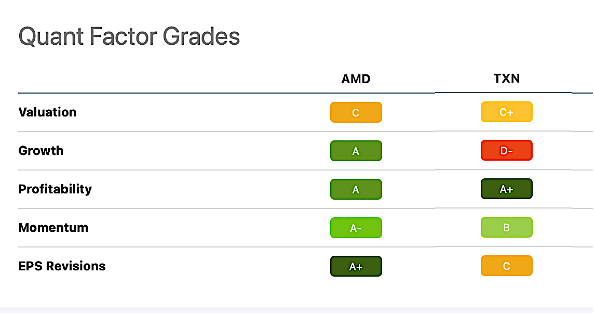
Seeking Alpha
Figure 6
Both AMD and Texas Instruments are leaders in the semiconductor industry and both are in the Top 10 in revenues (ranked ninth and tenth respectively, according to The Information Network’s report entitled “Hot ICs: A Market Analysis of Artificial Intelligence (“AI”), 5G, Automotive, and Memory Chips.”
But for investors, AMD has better financial metrics and is a better buy. Unfortunately the Street, and primarily technology stocks, have been impacted by a slew of macroeconomic headwinds — snarled supply chains, the war in Ukraine, sky-high inflation, COVID-19 lockdowns in China, and slowing economic growth. Treasury yields have been rising as investors react to the highest inflation in more than four decades and as the Federal Reserve ramps up its efforts to cool price pressures
These headwinds are pointing to the possibility of further erosion. According to Jamie Dimon, CEO of JP Morgan (JPM):
“I said there’s storm clouds, they’re big storm clouds, it’s a hurricane ... right now it’s kind of sunny, things are doing fine, everyone thinks the Fed can handle this. That hurricane is right out there down the road coming our way.”
This is the reality that investors need to consider in the current economic environment.
Be the first to comment