

HJBC
Long-Term Economic Prospects
Warren Buffett uses unleveraged net tangible assets to determine what he calls the long-term economic prospects of a business. His logic is simple, increasing earnings without major capital requirements is a better business to be in. It takes money to make money, but you want it to take as little money as possible.
This begs the question why Warren Buffett spent $44 B to buy Burlington Northern Santa Fe Railroad (BNSF) in 2009. Railroads take a lot of capital expenditure to grow. He explained this purchase in his 2020 Letter to Shareholders where he clarifies that asset heavy business can be good investments as long as they deliver returns on incremental investment.
The following chart shows Amazon with the rest of the companies in the S&P 500 for context. The blue shaded area here shows the distribution of all other companies in the S&P 500 since 2003. Amazon is way down at the bottom below the 15th percentile. On a simple linear ratings system, it might only get 1 out of 5 stars. As I outlined above this would be a mistake.
Authors Image from Financial Modeling Prep Data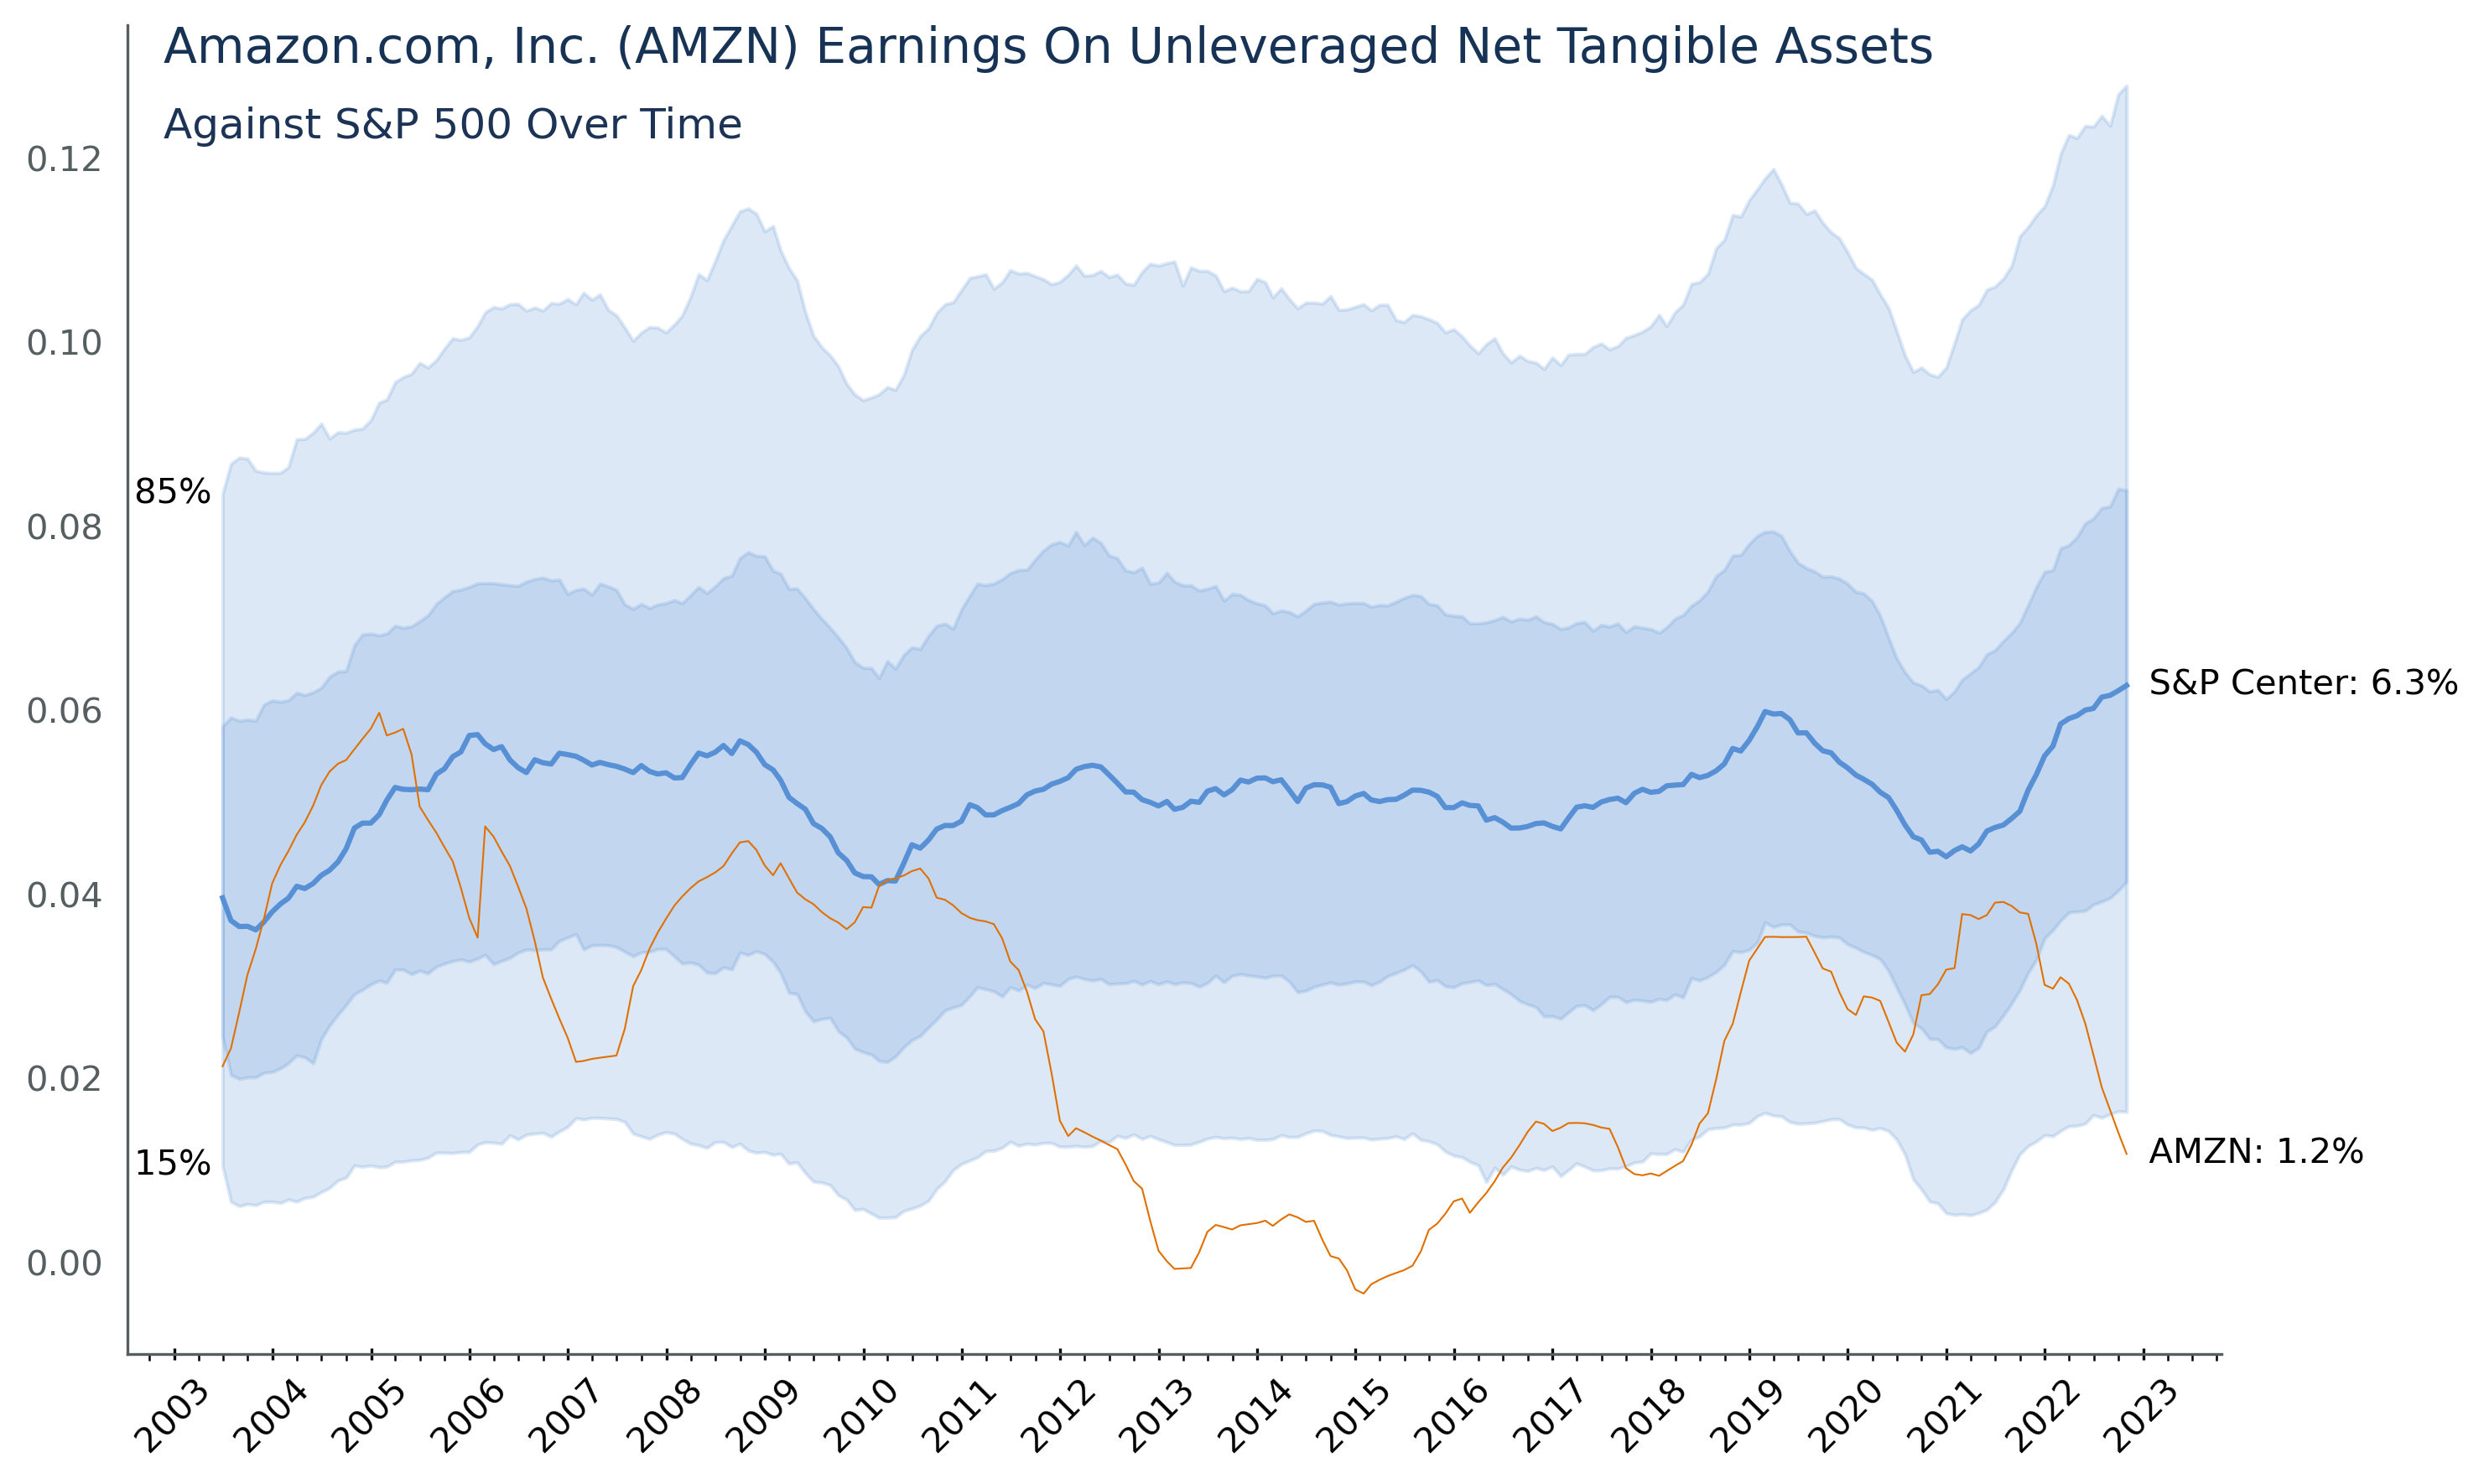
Instead of a simple linear scale you should look at Returns on Unleveraged Net Tangible Assets as an either/or, but not neither, measure. Let me explain. In this measure companies should strive to not be mediocre. They should find a strategy of extremes like competing on low cost or high differentiation, but not companies should not try to do both. Great companies have extremely high Returns on Net Tangible Assets and show up above the blue region in the chart above. This group is great because they can grow so fast. Good companies show up below the blue region in the chart. These companies are good when they have a massive capital investment moat around them causing any new entrant to go broke trying to gain scale to compete. Amazon has this moat in the massive logistics system surrounding its retail segments and massive datacenter holdings surrounding its web services.
Risk Reward Forecast
The below chart is a prediction of value at risk and potential return of holding Amazon stock. As shown by the blue intrinsic value region in the chart below, Amazon is below any level of intrinsic value it has traded at in the last 5 years.
Authors Image from Financial Modeling Prep and FRB Data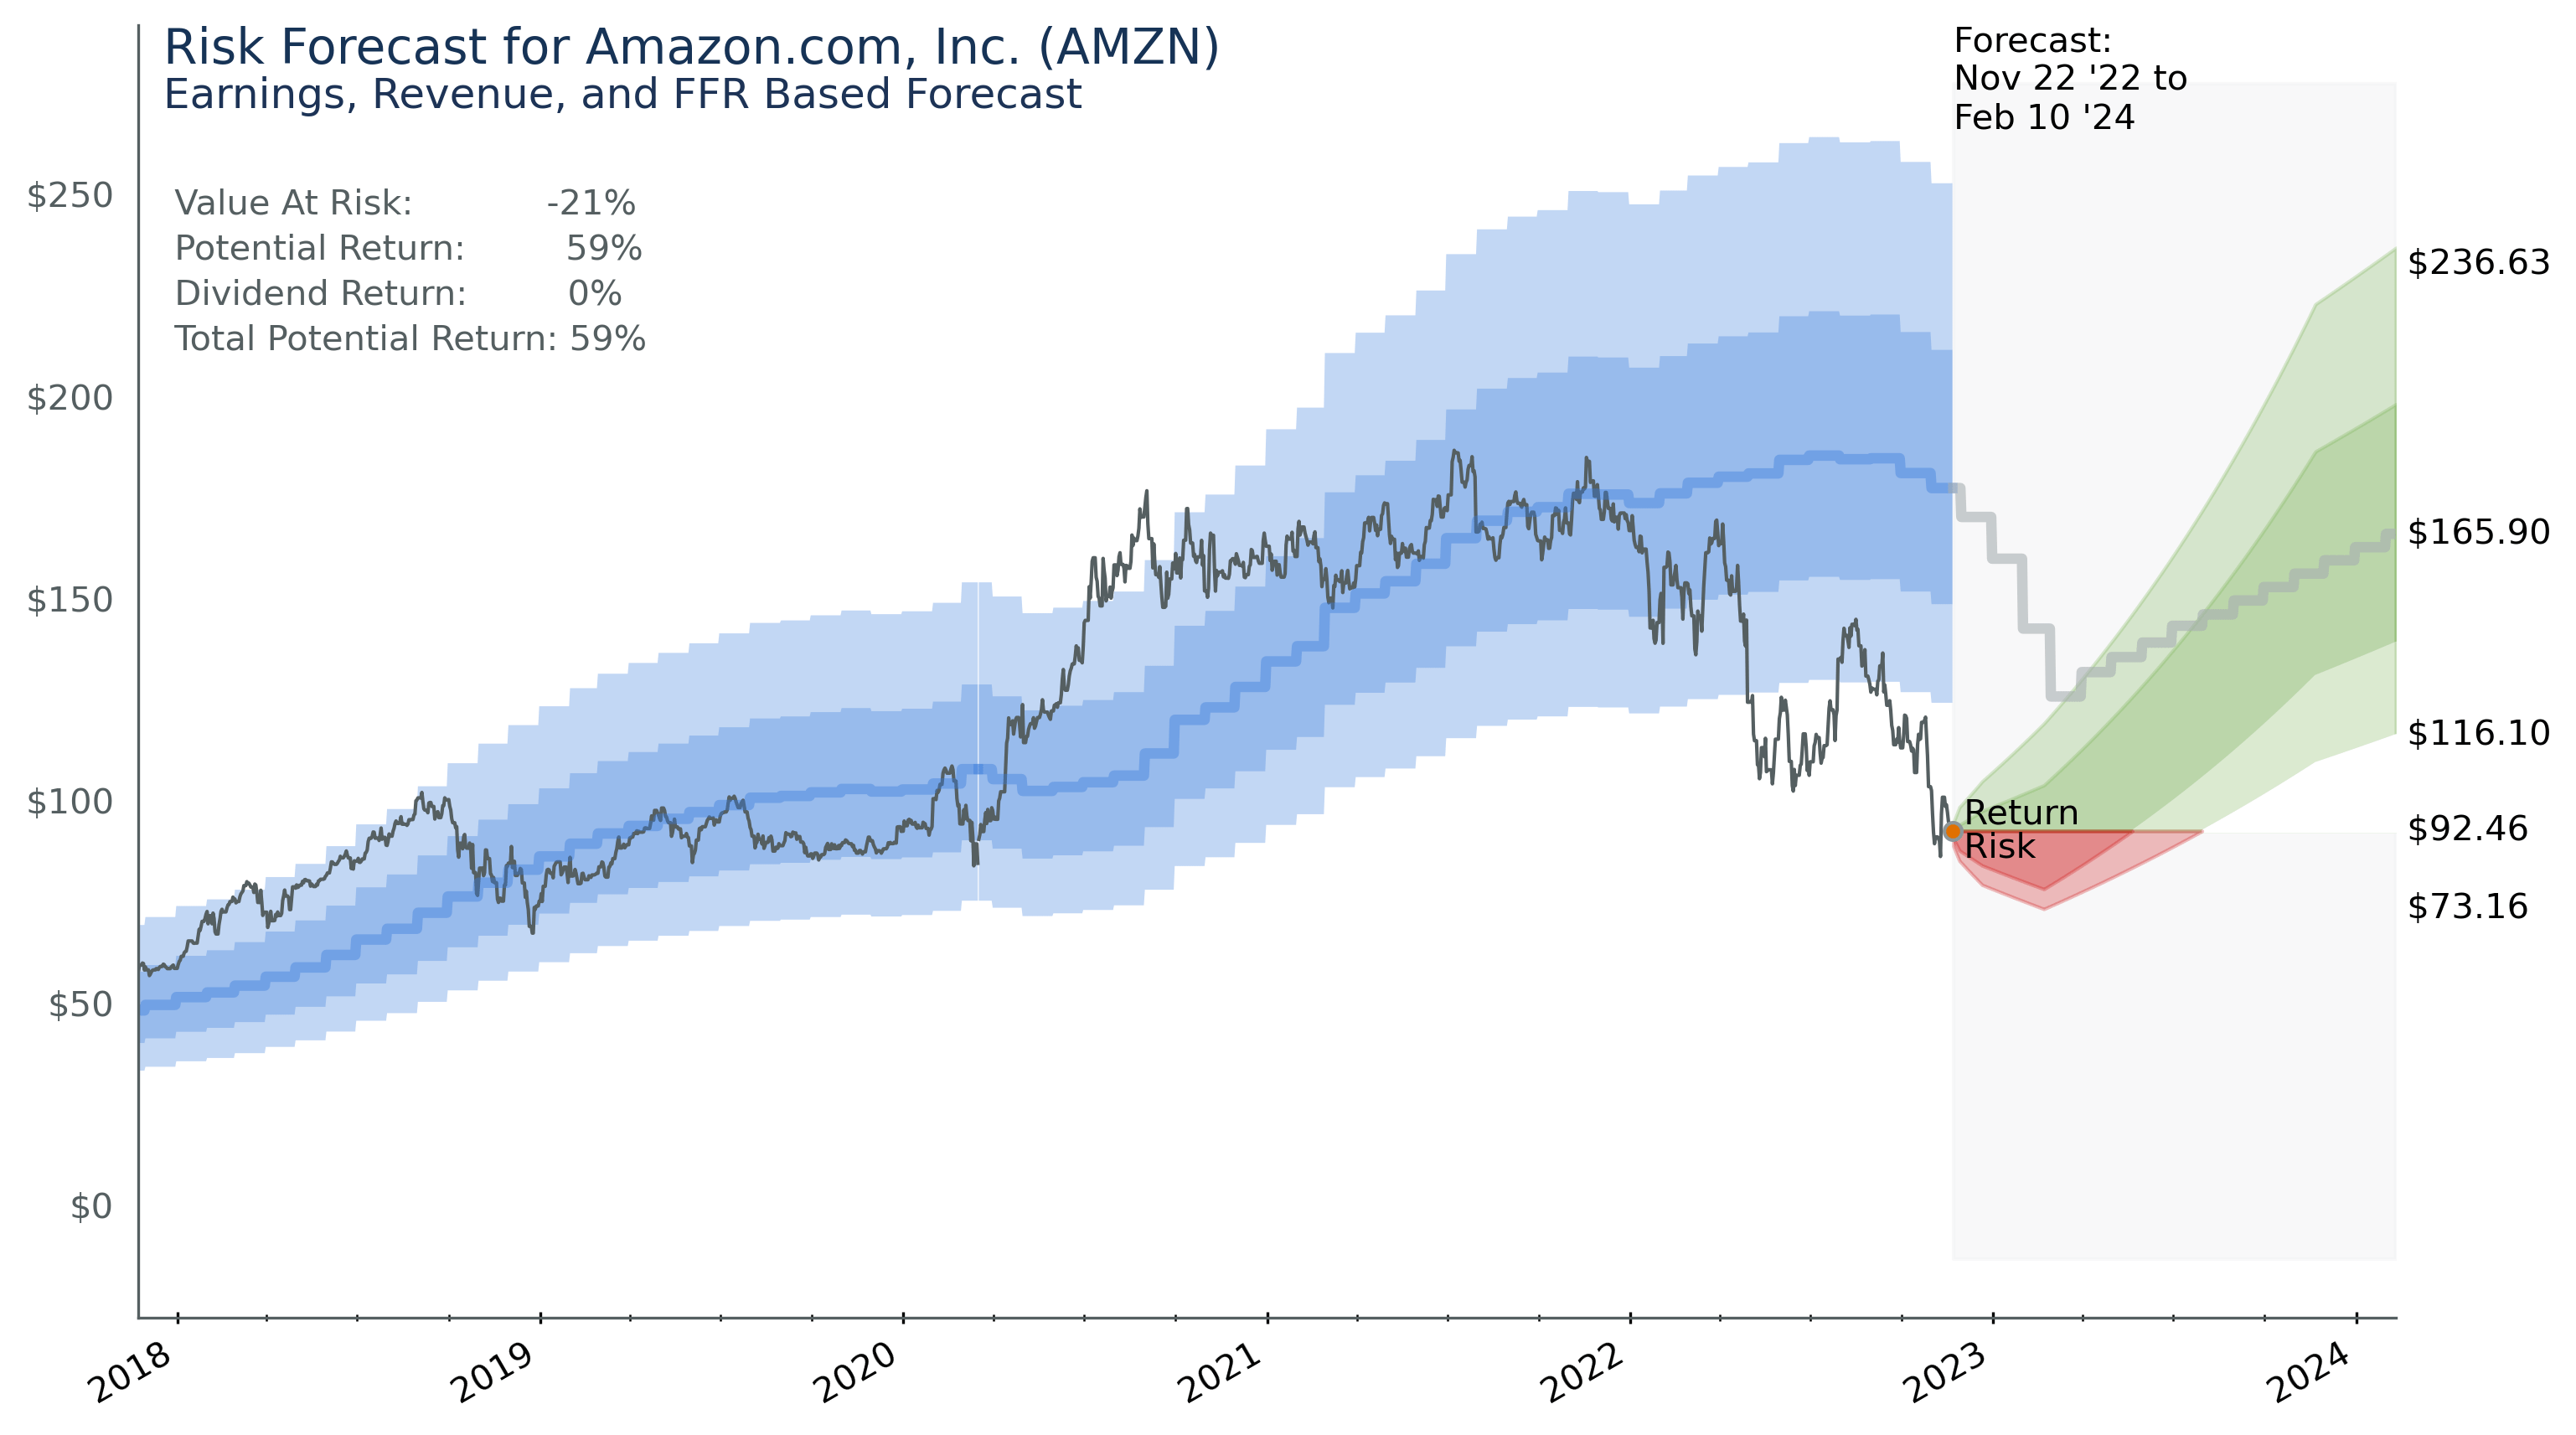
Amazon.com now has a value at risk of 21%. While this is high, it is all short-term trading risk and not long-term investment risk. The low-price prediction of $73.16 is based on historic short-term volatility. With a central forecast of $165.90 potential yearly returns are as high as 59%.
About the Risk Forecast
In the case of Amazon, historical data on earnings, revenue, and federal funds rate is used to train a series of machine learning algorithms to create a forecast of price risk. The chart probably needs some explanation. The blue bands represent the predicted intrinsic value of the company with the actual price data shown against the prediction. The grey forecast portion shows how the price of $92.46 at the time of forecast relates to the intrinsic value of the company.
The algorithms do a pretty good job of predicting long term price movement, but price will go outside the blue bands. Those bands are only there to show you where the price should be 90% of the time. This forecast, and forecasts for other stocks as well, tend to lag price when it goes down and lead when it goes up. This makes it useful to determine risk in a stock, but it is less reliable for market timing. That said, I am unaware of any market timing schemes that stand up to robust analysis.
Amazon Revenue Growth: Past and Present
The next chart shows the last 8 years of earnings and revenue as well as forecasts for the next 2 years from 13 sell-side analysts reporting from major brokerage houses.
Authors Image from Financial Modeling Prep Data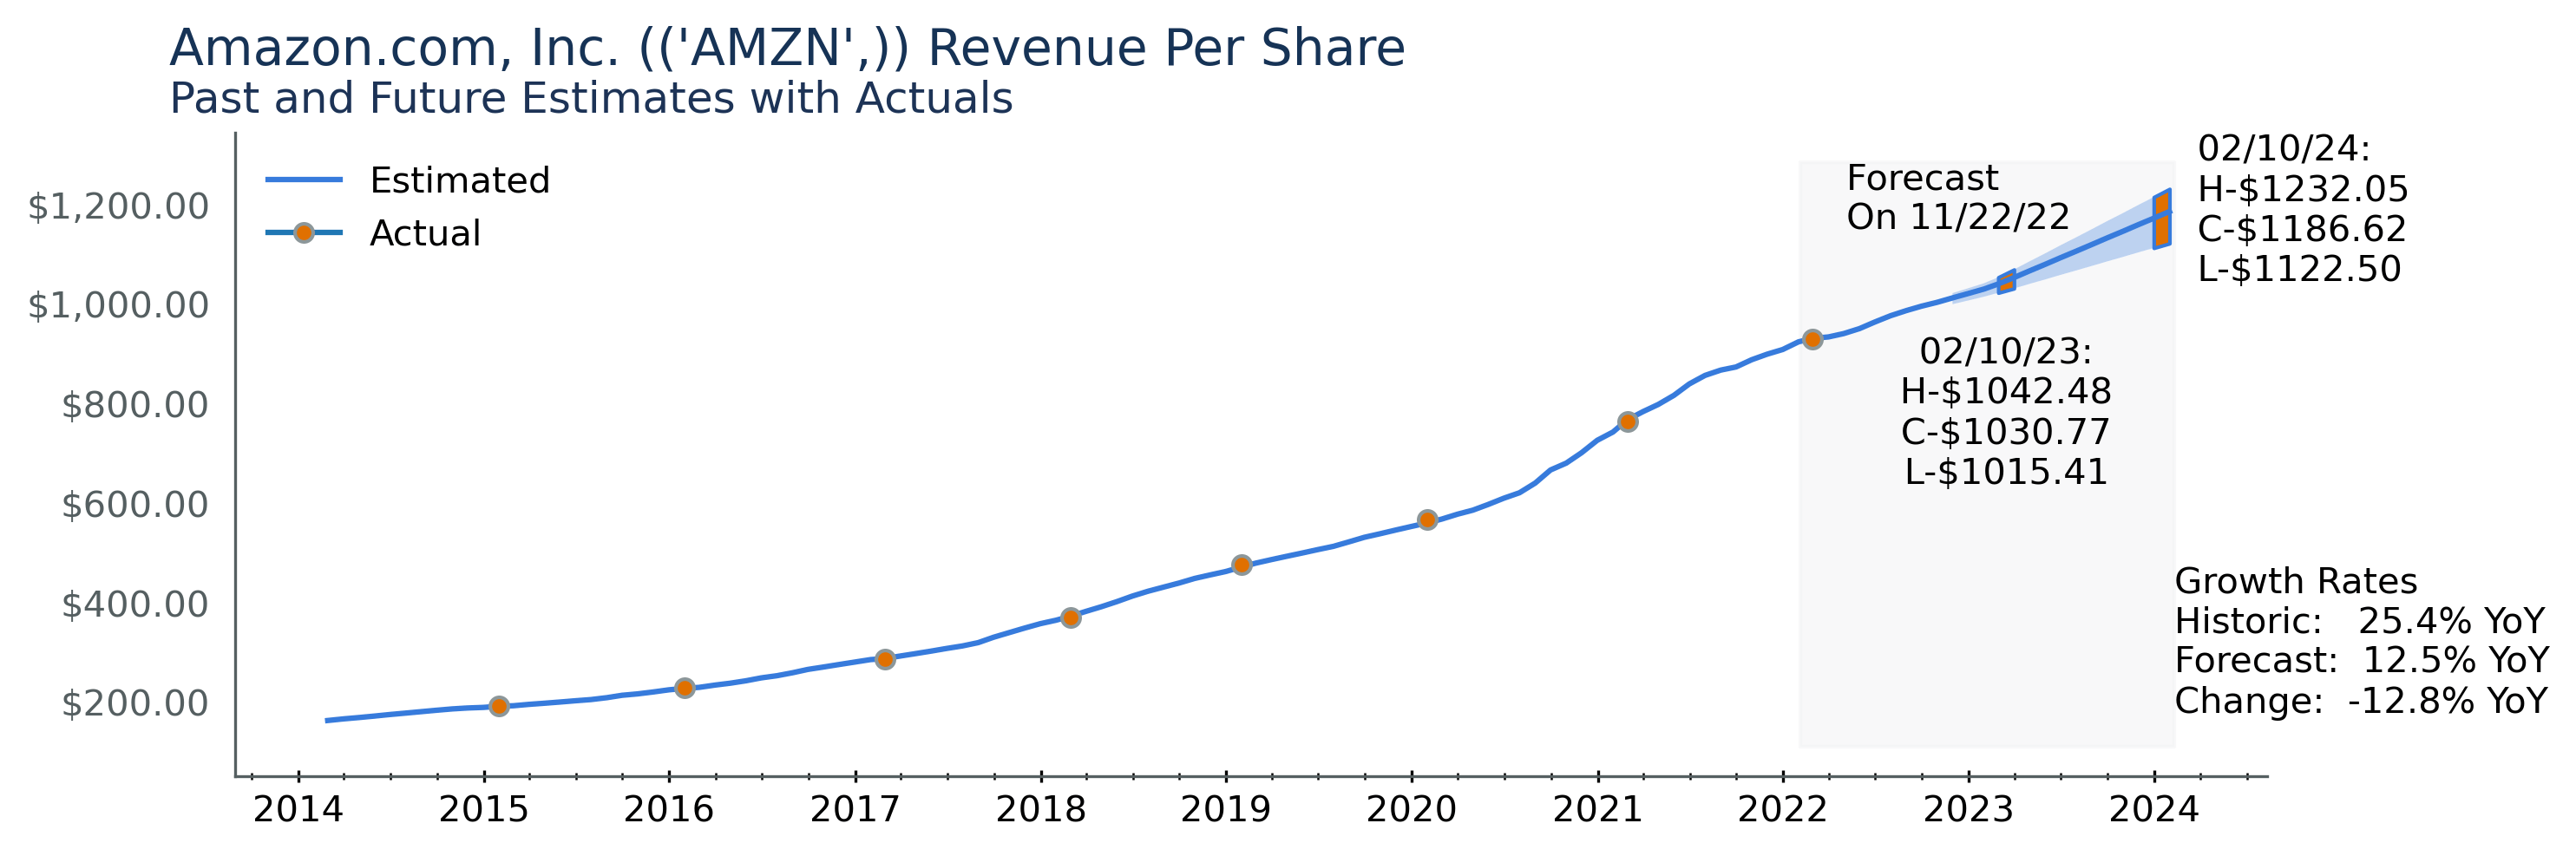
The revenue forecasts show that revenues are projected to grow on a 12.5% trend over the next two years. This is down almost 50% from Amazon’s historical growth trend of 25.3%. Growth rates of 25% a year are extraordinary, whereas a 12% curve is still good, but no longer extraordinary.
2023 revenue estimates are in line with long term trends. The estimates are centered around $1020.63 per share with the entire range fitting between $1006.82 and $1031.16. The revenue picture for Amazon is stable.
Amazon Earnings Expectations
Earnings are a different story entirely. After peaking in 2021 and 2022 Pro Forma earnings per share expectations have come way down and are expected to be between $1.08 and -$0.07 next year and $3.11 and $1.40 in 2024.
Authors Image from Financial Modeling Prep Data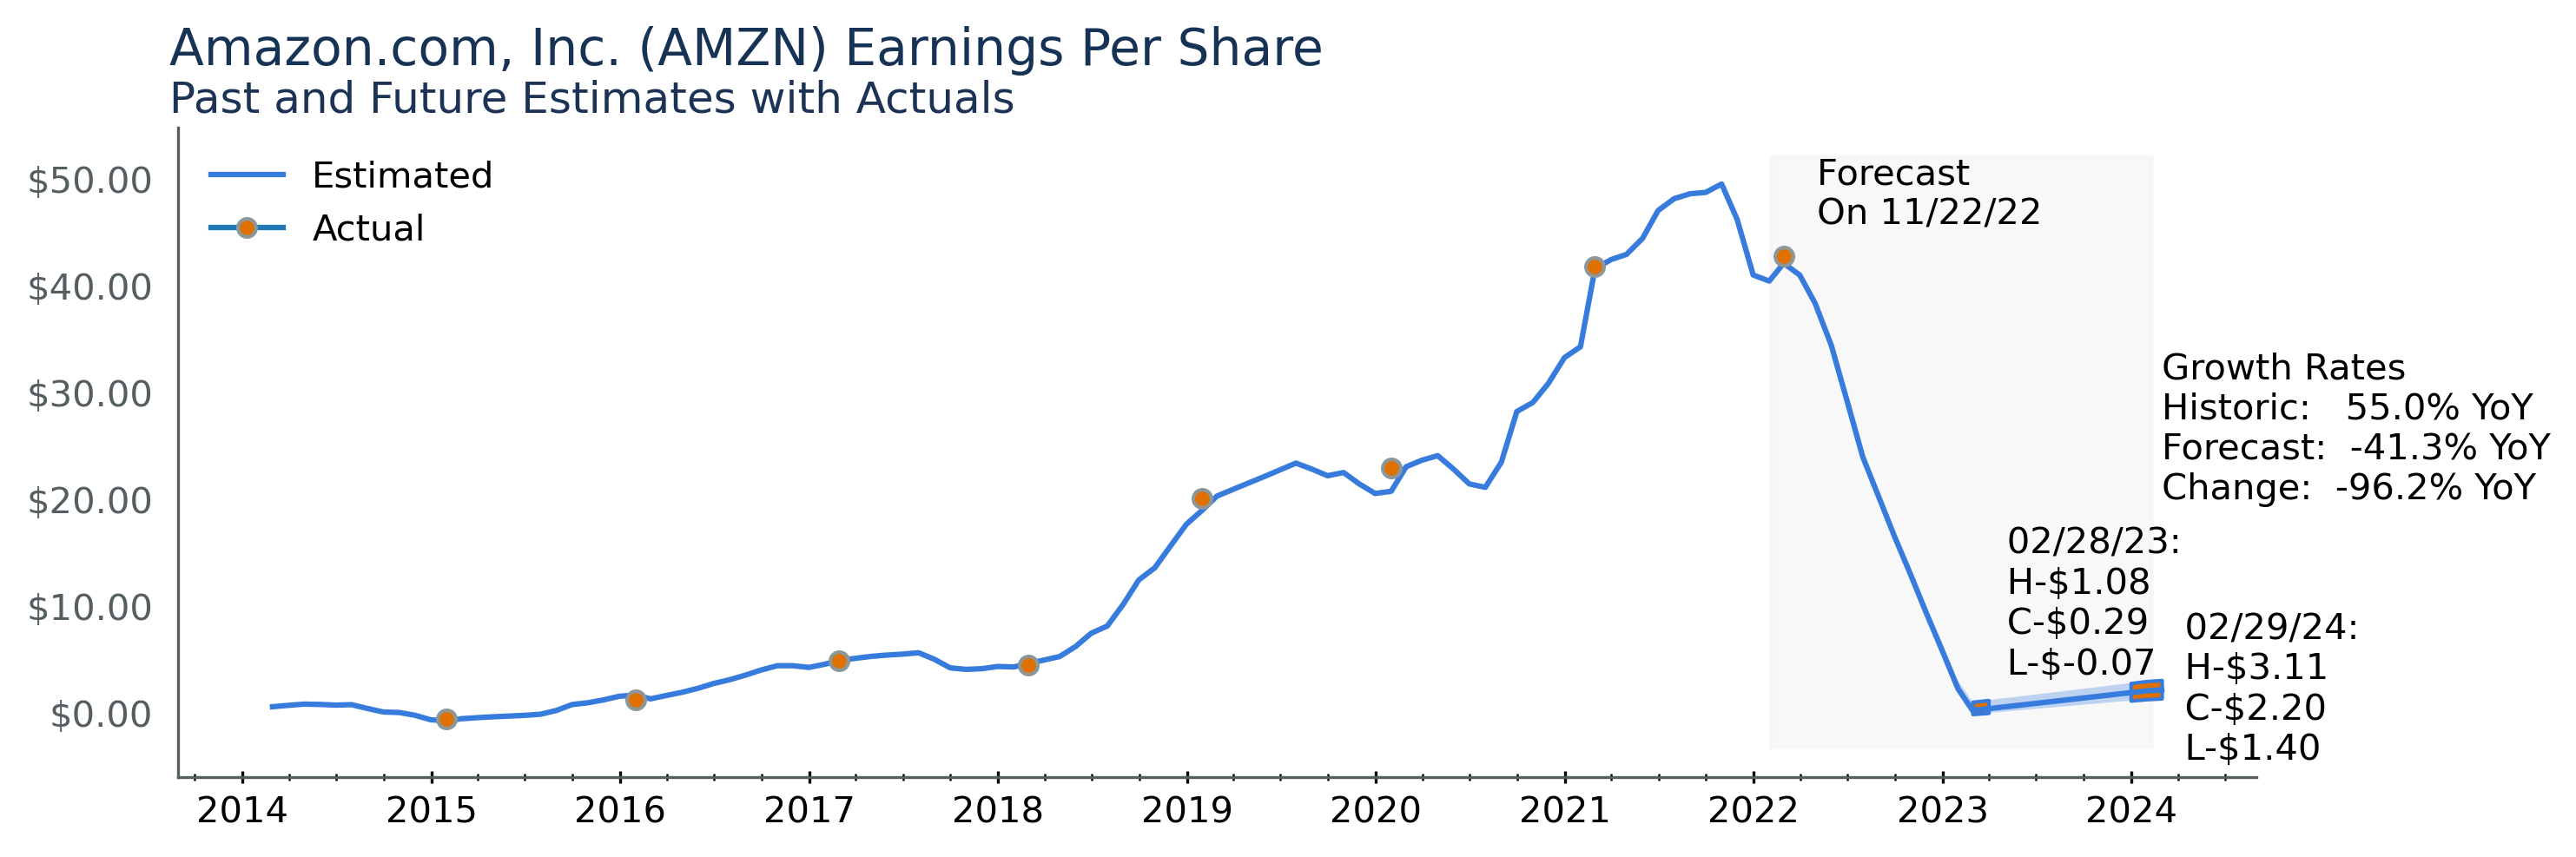
Amazon has seen a slight drop in revenue growth and a major drop in earnings. The important point to note is that forecasts are well known and therefore priced into any reasonably efficient market including the market for Amazon stock.
Amazon’s earnings estimates change a lot though. I am working toward a quantification of how much this change affects share prices to quantify what Warren Buffet calls ‘bob around’ earnings.’ While I am working on that, you can see the effects of estimate changes in the above two plots. See how the revenue curves look smooth, but the earnings curve jumps around. The curve represents analyst forecast change over time. Any change in slope is a change in analyst estimates at that time.
I can’t tell you how earnings estimates will change moving forward, but just realize they could swing up or down by significant amounts.
Analyst Sentiment
We therefore need to look at recent analyst change which I consider analyst sentiment. The below chart summarizes analyst behavior for all stocks in the S&P across the last 2 decades. The neutral point shows analysts tend to increase estimates by 1.3% monthly and are currently pessimistic on the S&P having decreased estimates by -1.0% over the past 30 days. Amazon shows extremely positive sentiment at a 10.1% increase over the past month.
Authors Image from Financial Modeling Prep Data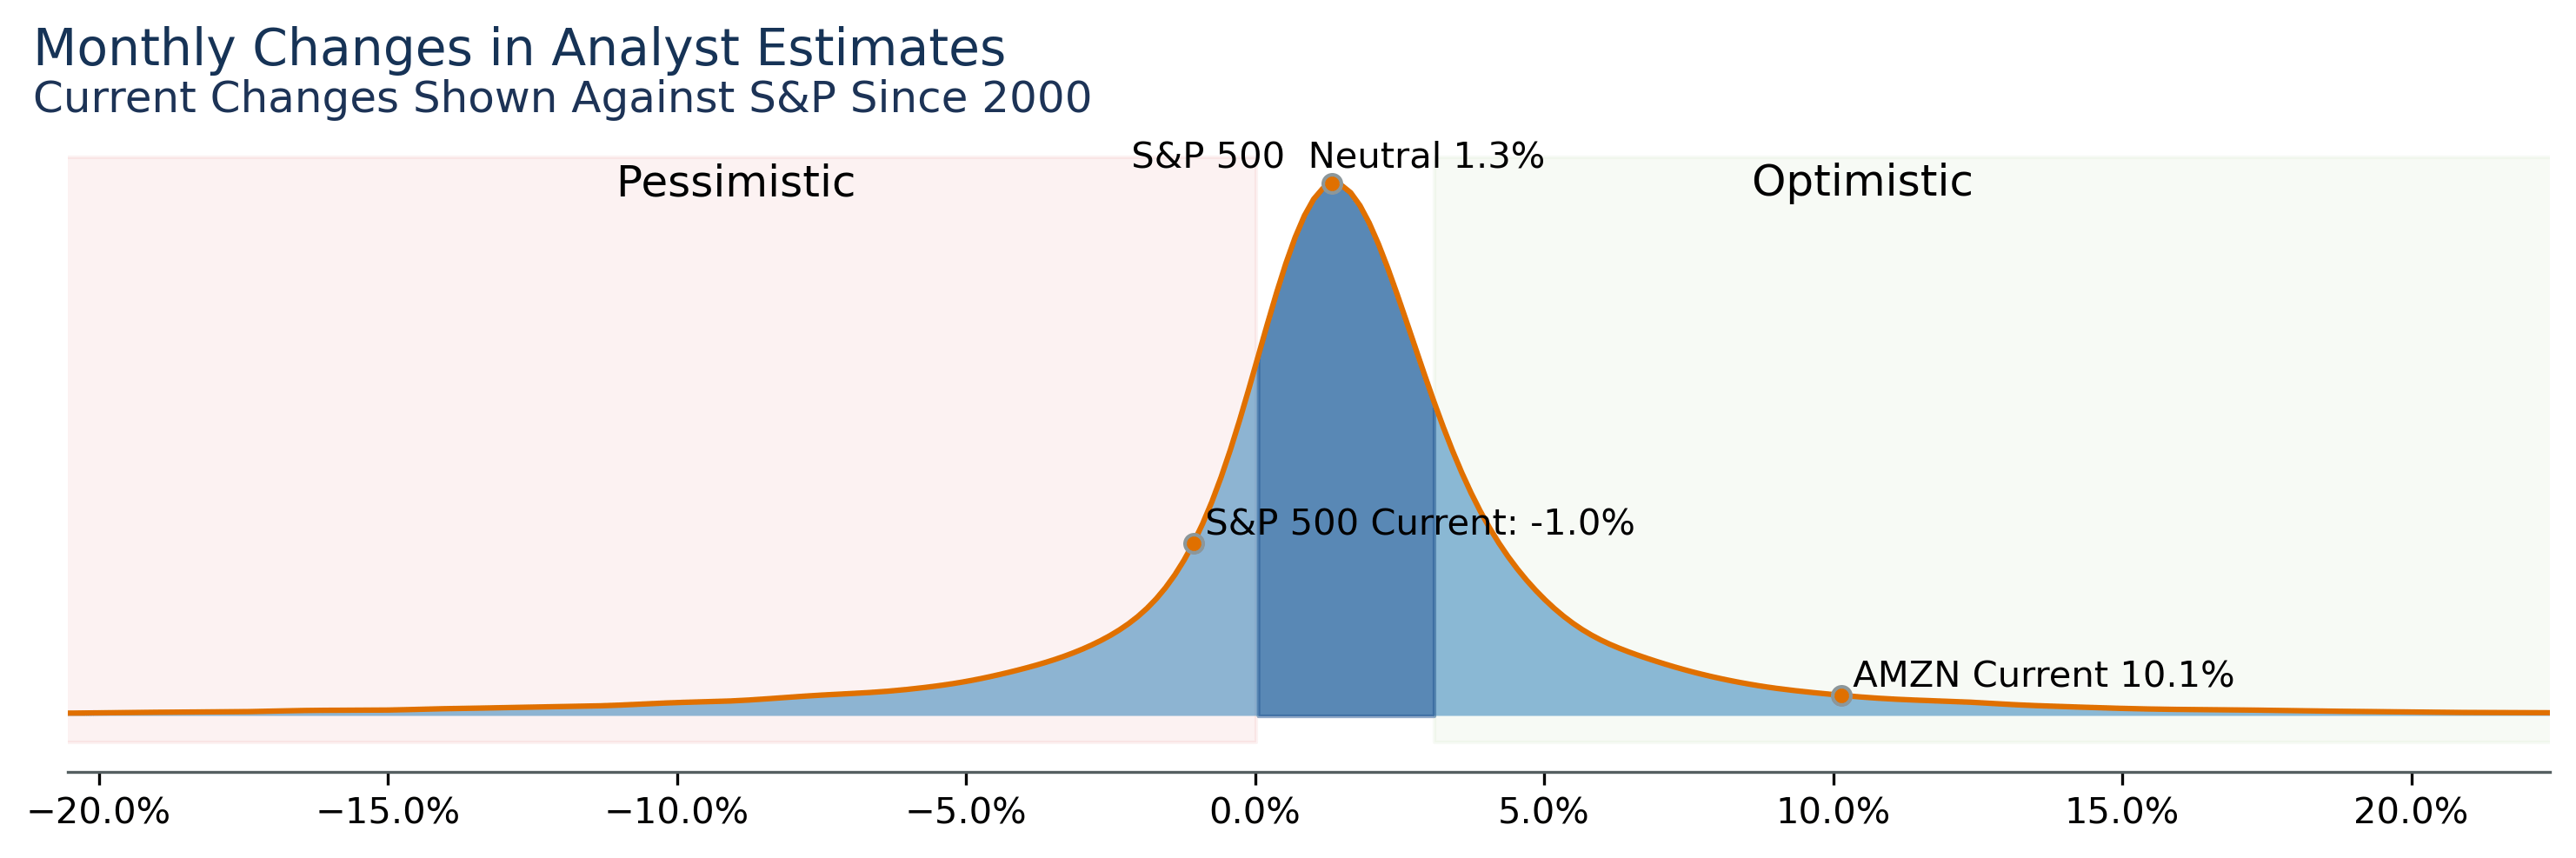
The above chart looks bullish, but we need to temper it with the realization that a 10% increase after the massive decrease in earnings forecasts, we have seen only indicates it isn’t as bad as we thought.
Final Word
As shown in the Risk Return forecast, it is likely to take at least a year for price levels to return to 2021 values. Given that revenue growth is intact and competitive advantage through sheer size of net tangible assets is a formidable moat, Amazon will likely return to previous earnings levels. Get ready for your Prime membership fee to increase, and likely a split of prime video as a separate offering, but Amazon’s earnings will return. It’s just a matter of when, and how much we pay for it as consumers.
Be the first to comment