


Guang Niu
NYSE:BABA has lost two-thirds (>$500 billion) in market cap since its peak in late 2020. This article will review the tangible economic effects of the SAMR’s anticompetition policies on BABA’s business performance, including: (i) lower profitability, (ii) slower growth and (iii) higher risk premiums / required rates of returns by investors. Current market valuations are effectively assuming these effects will persist into perpetuity. Out of the three, lower profitability is likely reflective of a structural shift, but the other two may prove to be temporary and could change with time.
Lower profitability
A direct consequence of SAMR’s rules was to tilt the market landscape in favour of number two and smaller players relative to the incumbent. Indeed, management have repeatedly mentioned “increased competition” impacting the company’s core e-commerce segment on earnings calls since the regulatory shakeout.
To cope, (as well as to proactively portray the image of a good socially-responsible corporate citizen in front of government authorities), BABA is forced to:
- Provide more subsidies to merchants and partners (effectively discounted pricing)
- In its Dec 2021 results conference call, the deputy CFO said “We have also made strategic reductions in selected service fees to lower merchants’ operational expenses in a slowing consumption environment.” Lower fees, merchant support and similar language has also appeared in earlier call transcripts in 2021.
- Step up investment, either in the form of direct sales and marketing dollars or “strategic initiatives” investment
- Before the clampdown on anti-competitive behaviour, BABA’s EBITA drag came from Cainiao (logistics), Lazada (international e-commerce) and Ele.me (local consumer services). In 2020, BABA launched Taobao Deals and Taocaicai (previously Taobao Grocery) and these latest additions to the strategic initiatives portfolio have become the focus of management spending. Taobao Deals and Taocaicai were launched to compete with lower income market incumbent Pinduoduo. These appear to be lower income business initiatives with relatively high cost of user acquisition and lower retention rates that yield smaller profit margins. It is debatable whether growing the user base at all costs in this manner is worthwhile or whether management is better off focusing on its core mid-to-high income consumer profile (and gain more wallet share there).
This has resulted in EBITA margins dropping from 27% (average of 8 quarters leading up to the quarter ending Dec 2020 (3QFY21)) to 16% (average of 4 quarters leading up to the quarter ending Dec 2021 (3QFY22)).
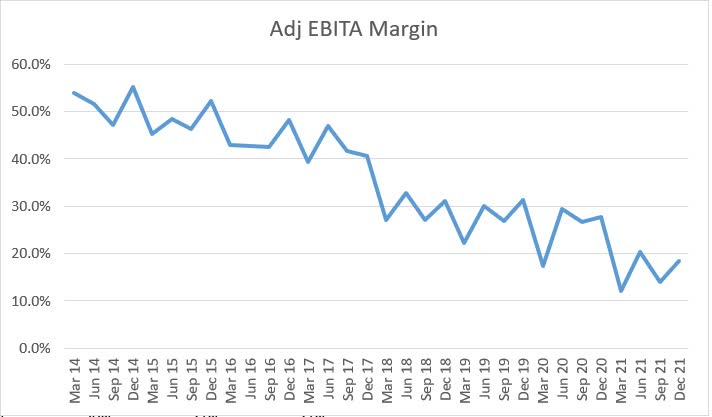
Company filings
Looking back to early 2018, EBITA margins similarly dropped drastically from 40% to 30% when the company first launched its “new retail” initiative and remained at that lower level since. Similarly, BABA’s current investments in strategic initiatives reflect structural changes to the company’s business mix, and the most recent gap-down in margins may be here to stay.
Slower Growth
I include slowing growth as one of the economic effects resulting from SAMR’s anticompetition policies, but anticompetitive regulations drag on BABA’s growth only to the extent that they pressure BABA to reduce merchant fees (mentioned in point 1 under “Lower Profitability” above), which result in customer management revenue growing slower than GMV growth.
Given BABA’s 950 million annual active consumers covers two-thirds of the country’s 1.4 billion population, it is inevitable that the company’s growth trajectory will be affected by the macroeconomic picture, and this is regardless of what SAMR does and says. I review the latest macro indicators and then express my thoughts on how I view these levels of growth rates.
Beijing is targeting 5.5% annual GDP growth for 2022, but with first half growth at 2.5%, most analysts / economists do not expect that to be achieved. The marked deceleration was in 2Q when numerous cities implemented anti-virus curbs starting in March, in line with the country’s zero tolerance towards COVID. 2Q 2022 GDP growth was 0.4% YoY, barely escaping a contraction, and is below the 1.2% forecast by economists, and down from the 4.8% recorded in 1Q 2022.
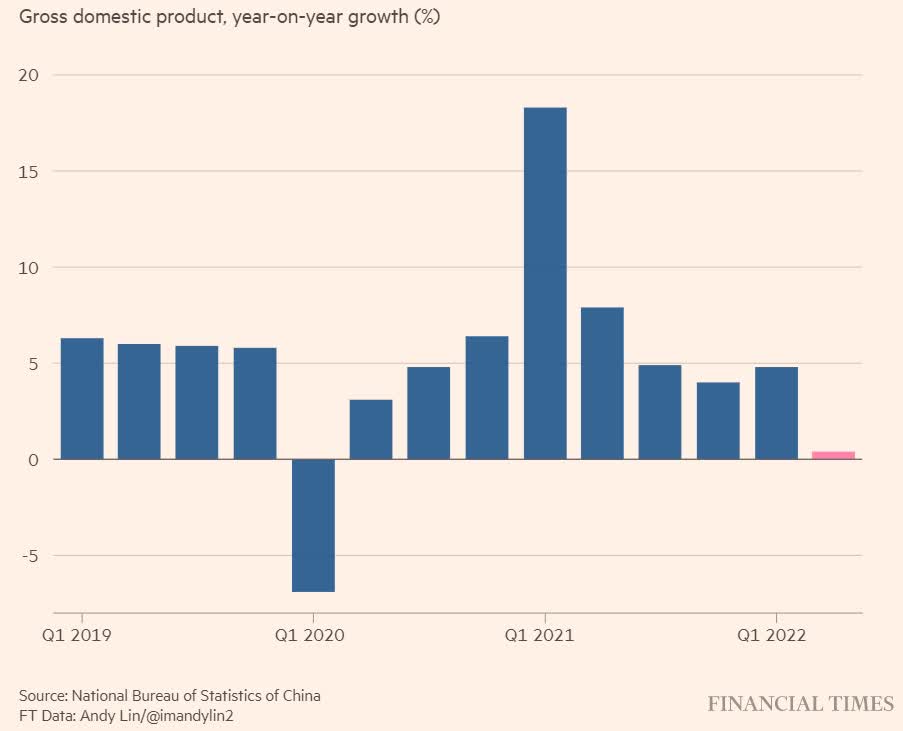
Financial Times
As far as BABA is concerned, a more relevant metric is perhaps retail sales growth. BABA’s growth in retail GMV and GTV (combined) have slowed from 20% to 30% before 2019 to an average of 14% in 2021 (average of 4 quarters from Mar 2021 (4QFY21) to Dec 2021 (3QFY22)). A rough graph plotting that against the index of YoY change in China Retail Sales Value suggests a certain degree of correlation between the two. Retail sales over 4Q 2021 was USD 1.9 trillion, a paltry 7% increase over 4Q 2020 (even with the Singles Day shopping festival in November). BABA is due to report 1Q 2023 results around August (so there is no company GMV / GTV datapoints yet for 2022) but I note that China retail sales growth was negative for 3 out of the first 6 months of 2022.
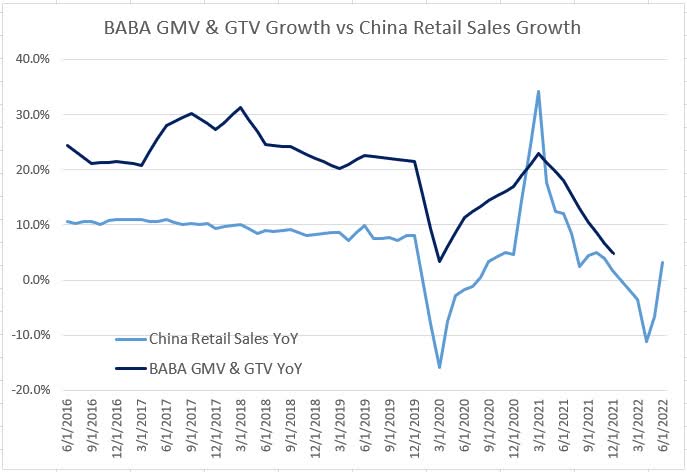
Bloomberg, BABA company filings
Even though there is a lot of talk about China growth being “slowest in three decades” etc., I propose to frame the picture in another way. China population (1.4 billion) is slightly more than 4 times that of US (320 million). Intuitively, that implies that when the average Chinese is one-quarter as rich as the average American*, their consumption economy will be same size as that of US. In other words, there is a long runway for growth, provided that China is able to shift from “easy” growth (large-scale infrastructure projects) to quality growth (improved labour productivity, technological advancements, etc.). If so, then even after the Chinese consumption economy catches up with that of the US in terms of absolute size, there is still the differential between income per capita to bridge.
*The average Chinese is less than one-quarter as well off as the average American. As of 2021, China constant GDP per capita was $11,200 vs US constant GDP per capita of $61,280 according to data from the St Louis Fed.
Higher risk premiums / required rates of return
Most people are likely to agree that the stock is currently trading at an undervaluation, regardless of whether you are a BABA fan or not. Lower profitability and slower growth are two explaining factors, but they seem insufficient to fully account for such a large gap – $500 billion is a lot. The last component is higher risk premiums / required rates of returns by investors. This is what people call the “unknowns”, “uncertainties”, or CCP wildcard risk, hanging over the stock, which should be thought of scientifically as risk premiums (multiple compression in some ways is the flip side of the same coin) instead of some elusive construct. Investors are spooked and they need higher required returns to compensate.
This “China risk” is not new and comes and goes in phases. For clarification, I refer to “China risk” in the sense of China regulatory risk instead of China country risk premium (which focuses on country default probabilities per classic textbook definitions). One thing is clear – the 2020 to 2021 risk levels represent extremes and to interpret these as normalised levels (i.e., if you think “things will be forever like this”) is incorrect.
Closing Remarks
Companies can survive, and even thrive, following intense regulatory cycles. Take the Dodd-Frank Act as example, the introduction of close to 28,000 new rules and restrictions curtailed banks’ revenue pools, doubled their capital requirements and compliance costs. On the upside, in the years following the passage of Dodd-Frank, banks restructured, changed their business mix, became more efficient, learned to optimize capital, and developed new competitive edges in areas of technology and marketing. This regulatory adaptation separated the winners from the losers. Starting in 2013, a few large bank stocks went on to significantly beat the broader market over the rest of the decade. In BABA’s case, the market has reacted to the 2020-2021 developments as if they are killer blows to the company, when instead they are more catalysts for change.
Be the first to comment