

Canadian Dollar Talking Points
USD/CAD trades to a fresh monthly low (1.2569) following the limited reaction to the Bank of Canada (BoC) interest rate decision, and the advance from the February low (1.2468) may turn out to be correction in the broader trend rather than a change inbehavior like the price action seen in 2020.
USD/CAD Pullback from 50-Day SMA Leads to Break of March Opening Range
USD/CAD snaps the monthly opening range for March as it continues to pullback from the 50-Day SMA (1.2694), and the updated to Canada’s Employment report may keep the exchange rate under pressure as job growth is expected to rebound in February.
Canada is projected to add 75K jobs after shedding 212.8K jobs in January, and a positive development may encourage the BoC to retain the current course for monetary policy as “the Governing Council judges that the recovery continues to require extraordinary monetary policy support.”
It seems as thought the BoC is in no rush to scale back its emergency measures as the central bank plans to carry out its quantitative easing (QE) program “at its current pace of at least $4 billion per week,” but it remains to be seen if the central bank will adjust the forward guidance at the next meeting on April 21 as Governor Tiff Macklem and Co. are scheduled to update the Monetary Policy Report (MPR).
Until then, key market themes may sway USD/CAD as major central banks rely on their balance sheet to achieve their policy targets, and the US Dollar may continue to reflect an inverse relationship with investor confidence as the Federal Reserve stays on track to “increase our holdings of Treasury securities by at least $80 billion per month and of agency mortgage-backed securities by at least $40 billion per month.”
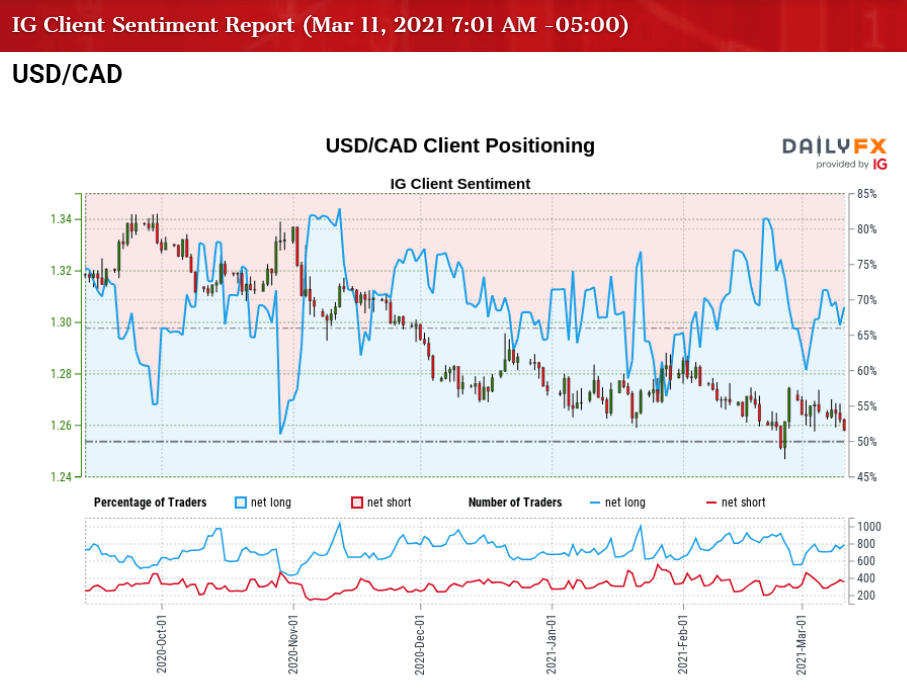
At the same time, the tilt in retail sentiment looks poised to persist as traders have been net-long USD/CAD since May 2020, with the IG Client Sentiment report showing 68.91% of traders currently net-long the pair as the ratio of traders long to short stands at 2.22 to 1.
The number of traders net-long is 10.38% higher than yesterday and unchanged from last week, while the number of traders net-short is 1.34% higher than yesterday and 8.01% lower from last week. The rise in net-long interest has fueled the crowding behavior as 67.87% of traders were net-long USD/CAD ahead of the BoC rate decision, while the decline in net-short interest could be a function of profit-taking behavior as the exchange rate trades to a fresh monthly low (1.2569).
With that said, key market themes may continue to influence USD/CAD amid the ongoing tilt in retail sentiment, and the advance from the February low (1.2468) may turn out to be correction in the broader trend rather than a change inbehavior like the price action seen in 2020.

Recommended by David Song
Learn More About the IG Client Sentiment Report
USD/CAD Rate Daily Chart

Source: Trading View
- Keep in mind, USD/CAD cleared the January 2020 low (1.2957) following the US election, with the exchange rate trading to fresh yearly lows in November and December as the Relative Strength Index (RSI) established a downward trend during the same period.
- USD/CAD started off 2021 by taking out last year’s low (1.2688) even though the RSI broke out of the bearish formation, with lack of momentum to hold above the 1.2770 (38.2% expansion) region pushing the exchange rate briefly below the Fibonacci overlap around 1.2620 (50% retracement) to 1.2650 (78.6% expansion).
- A break/close below the Fibonacci overlap around 1.2620 (50% retracement) to 1.2650 (78.6% expansion) materialized in February, which pushed USD/CAD to fresh yearly lows, and advance from the February low (1.2468) may turn out to be correction in the broader trend rather than a change in behavior as the exchange rate continues to pullback from the 50-Day SMA (1.2694).
- It seems as though USD/CAD is respond to the moving average like the price action seen earlier this year, with the close below the Fibonacci overlap around 1.2620 (50% retracement) to 1.2650 (78.6% expansion) bringing the 1.2510 (78.6% retracement) region back on the radar.
- Next area of interest comes in around 1.2440 (23.6% expansion) followed by the 1.2360 (100% expansion) region.

Recommended by David Song
Traits of Successful Traders
— Written by David Song, Currency Strategist
Follow me on Twitter at @DavidJSong
Be the first to comment