

Pgiam/iStock via Getty Images
The American Association of Individual Investors (AAII) released their investor sentiment survey on Thursday, and it showed 20% more bears than bulls. But one week’s results can vary widely, and we think there is a better way to use this sentiment indicator.
Surveys
The accuracy of any survey depends on the size of the sample. Polling 20 people for the presidency tells us little; polling 200,000 gives us something significant. Without knowing how many AAII members submit their opinion each week in the survey, it’s difficult to correctly evaluate the significance of the numbers.
There is a way through this, however, and we believe we’ve developed a very good way to use this historic sentiment indicator and want to explain the method. The method also allows us to incorporate the AAII sentiment results into our Master Sentiment Indictor.
The key is to increase the sampling size by adding up the weekly results over a specified period – to form an extended moving average of the weekly opinions. While this increases the sampling size it does have a drawback. Since opinions on the market change over time, one isn’t quite comparing an orange with an orange.
There is a compromise, however. It’s to not give equal importance to the opinions in this larger sample. One gives more weight to the most recent opinions and less weight to the older ones. To accomplish this, we created what’s called a time weighted moving average. For example, we assign market opinions eight weeks ago one third the weight of the current opinion. Opinions four weeks ago have about 60% the weight.
By systematically doing this, we create a larger investor sampling survey that balances survey size with changing market opinion. We found it particularly useful at signaling intermediate term market moves of from six to nine months. It forms the basis of one of the eight sentiment indicators that goes into making the Master Sentiment Index.
S&P 500 plotted against our ranking of AAII sentiment (Michael McDonald)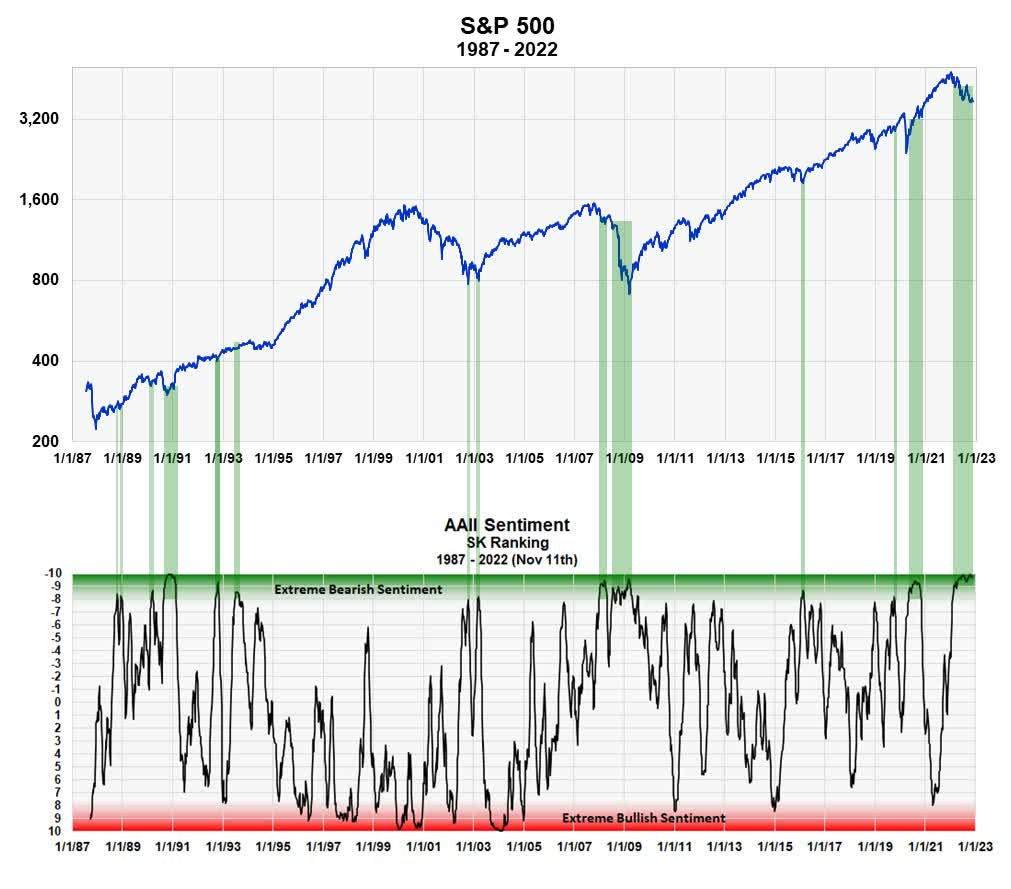
Our Sentiment Scale or Ranking
We created a scale that allows us to combine different sentiment indicators into one Master Indicator. It goes from minus 10 to plus 10. Zero is completely neutral. Minus 9 to minus 10 is as bearish as sentiment can get. That zone represents 5% of history’s most extreme bearish sentiment readings of the time weighted average. We color these extremes reading green. Red represents the most bullish sentiment. There is no sudden demarcation line but a graduated area that shows greater or lesser degrees.
A complete explanation of the scale and the red and green zones is found in our earlier article: Master Sentiment Index.
The graph shows 35 years of AAII Sentiment on our ranking scale. We’ve indicated with green bands those places on the S&P 500 where the indicator was minus 8 or less. This represents 10% of the most extreme bearish readings on our scale.
Almost every band represented a good, intermediate term buy signal. The signal of the 2008 financial crisis was obviously early, creating a very broad band. The timing of the bottom of 2001-02 bear market, however, was perfect.
Takeaway
This bear market has had one of the longest periods of extended bearish sentiment I’ve ever seen, which goes back to 1970. It is at least comparable to 2008-09. We believe this extended time period is a positive factor and shouldn’t be underestimated. We think it’s added confirmation that this bear market is probably over. It does suggest at least that we have started a six to nine-month rally.
Be the first to comment