

Nattakorn Maneerat
Thesis
Leading retail net-lease REIT Realty Income Corporation (NYSE:O) has seen its stock recover remarkably from its October lows, as we urged investors in our previous article to buy the panic selloff.
Accordingly, O posted a total return of 11.4% since our update, slightly above its 10Y total return CAGR of 10.6%. Notwithstanding, investors who bought at the start of 2022 are still down by 7.5% on a total return basis.
Realty Income’s Q3 earnings commentary suggested that the company has continued to exercise its cost advantage and capital allocation scale in large, institutionally-driven deals. Hence, it has allowed the company to raise its acquisition cap rates by about 50 bps QoQ, despite the rising cost of financing. Accordingly, it has allowed Realty Income to maintain a solid realized investment spread of 165 bps in FQ3 (Vs. 161 bps YTD).
Furthermore, Realty Income narrowed its FY22 AFFO per share guidance range, as it saw strong visibility in its earnings dispersion, helping the company to maintain the midpoint of its guidance range.
Therefore, we believe the mean-reversion rally by buyers at its October lows is justified, as the market forced holders to panic, leading to a positively-skewed reward/risk at those levels. Moreover, these buyers had correctly anticipated a robust Q3 earnings performance by the consistently reliable Realty Income, with most of its recent gains garnered pre-Q3 earnings.
With the sharp reversal spike into its current resistance zone, we believe some caution is warranted for investors considering adding more exposure at the current levels.
O’s valuation is no longer dislocated at levels seen at its October lows, with price action suggesting a pullback looking increasingly likely. Hence, we encourage investors to bide their time and wait for a healthy retracement before assessing the opportunity to add more positions.
Revising from Buy to Hold.
Q4 Guidance Is Solid But Expect A Normalized FY23 Cadence
Realty Income’s Q3 release was particularly positive in a worsening macro backdrop that has thrown a curveball against retail tenants. Also, it has led to a sharp rise in the cost of funds, behooving buyers and sellers to negotiate on appropriate cap rates accordingly.
Furthermore, Realty Income did not expect a marked deterioration in Regal that could upend its ability to collect rent moving ahead. As such, the critical risks that impacted the company in September/October were likely linked to headwinds from the rapid surge in the Dollar Index (DXY).
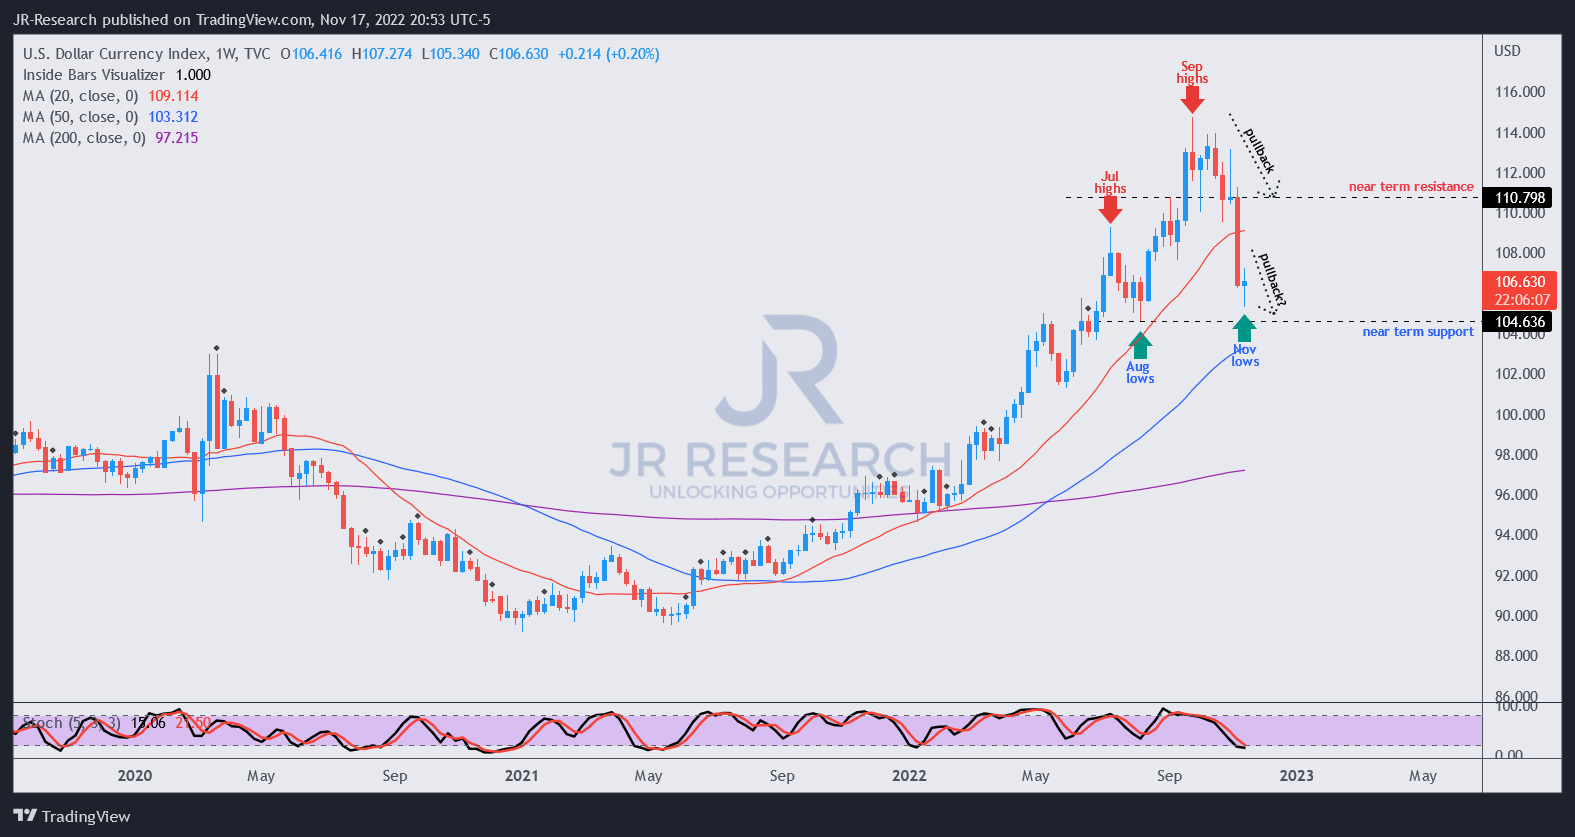
DXY price chart (weekly) (TradingView)
As seen above, the DXY has pulled back significantly from its September highs, settling around its near-term support. Therefore, the momentum remains with the dollar bulls, as we didn’t glean any remarkable bull trap that suggested the market could force the DXY to fall significantly further.
With Realty Income hedging about 50% of its earnings against forex risks, investors should continue to expect the dollar’s volatility to impact market sentiments on O.
Furthermore, with the pullback in DXY likely supported above its 50-week moving average (blue line), we believe it’s prudent to expect forex headwinds to impact Realty Income’s operating metrics through early H1’23 until there’s more clarity on the Fed’s rate hikes cadence.
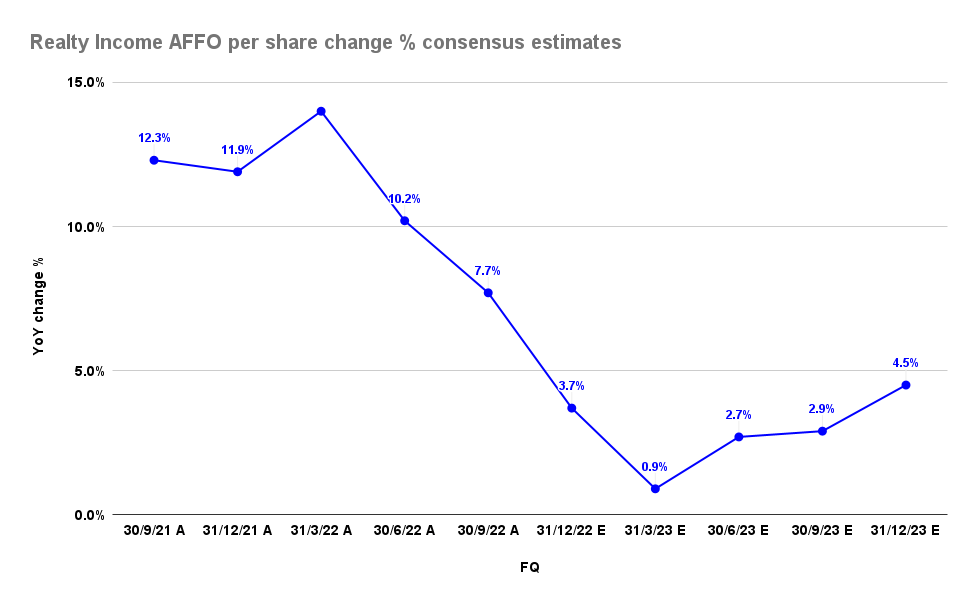
Realty Income AFFO per share change % consensus estimates (S&P Cap IQ)
Accordingly, we believe the consensus estimates remain in line with the company’s FY22 guidance.
Realty Income delivered AFFO per share growth of 7.7% in Q3. However, investors should expect further moderation in Q4, with an increase of 3.7%, pointing to a full-year AFFO per share estimate of $3.9 (Vs. revised guidance of $3.905 at the midpoint).
Notably, the macro headwinds impacting its sourcing volume, and acquisitions, should normalize the company’s growth cadence in FY23. Therefore, investors expecting O to post its remarkable growth momentum in FY21/22 could be sorely disappointed.
Hence, the critical question is whether its current valuation has reflected the potential normalization.
Is O Stock A Buy, Sell, Or Hold?
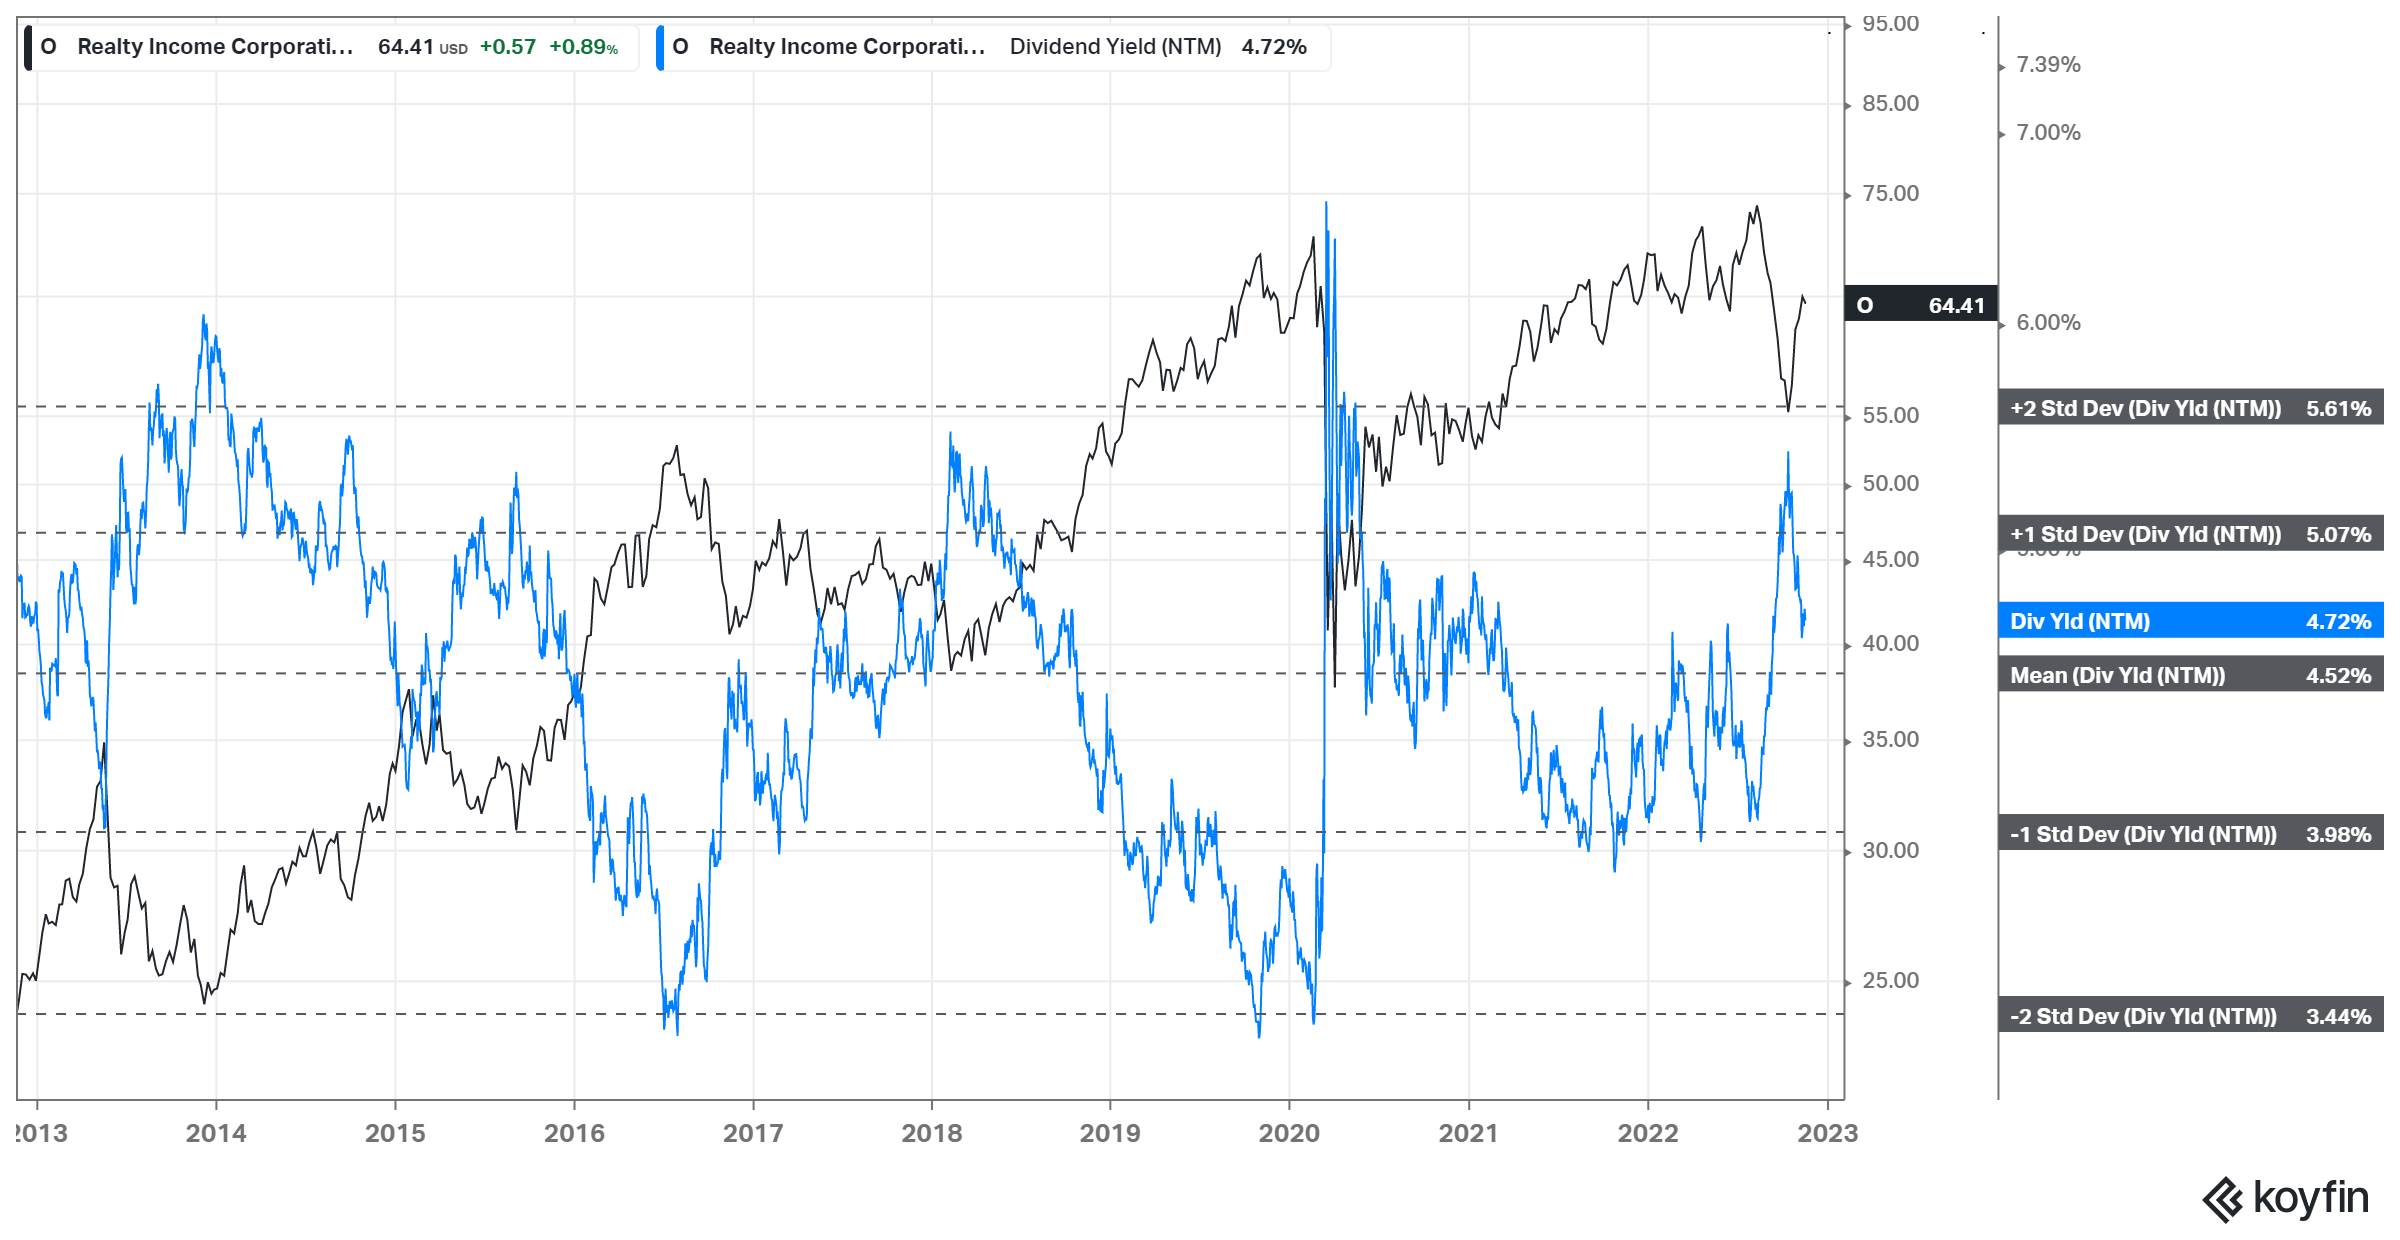
O NTM Dividend yields % valuation trend (koyfin)
With its remarkable recovery from its October lows, O is no longer undervalued relative to its historical averages. As a result, it last traded at an NTM dividend yield of 4.7%, just slightly above its 10Y mean of 4.5%.
Furthermore, O’s NTM AFFO per share multiple of 16.1x is also well ahead of its peers’ median of 13.8x (according to S&P Cap IQ data). While the bifurcation could be justified based on Realty Income’s scale and competitive moat, we believe a near-term re-rating is unlikely at these levels.
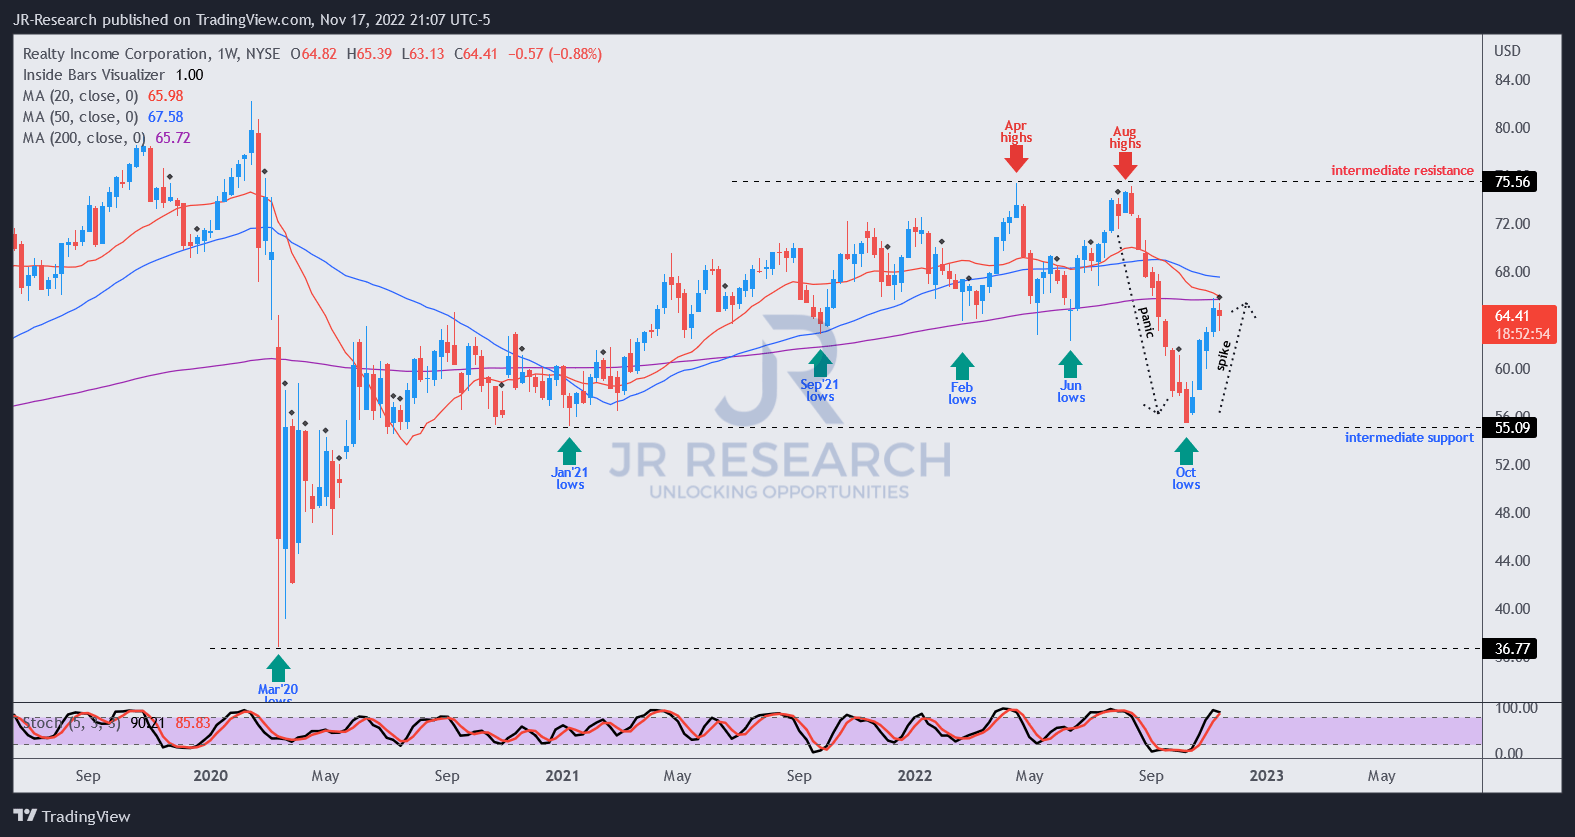
O price chart (weekly) (TradingView)
Furthermore, O’s price action indicating a sharp spike from its October lows warrants buyers’ caution.
We parse that the market has already mean-reverted the panic capitulation from its August highs toward its October lows.
With the 50-week moving average (blue line) looking increasingly like a defensible region for sellers, O’s buying upside could be significantly impeded from these levels unless the market anticipates a significant growth driver to lift its earnings profile.
Revising from Buy to Hold, we urge investors to remain patient.
Be the first to comment