

The irrational market melt-up from the June 16th market low continues.
YCharts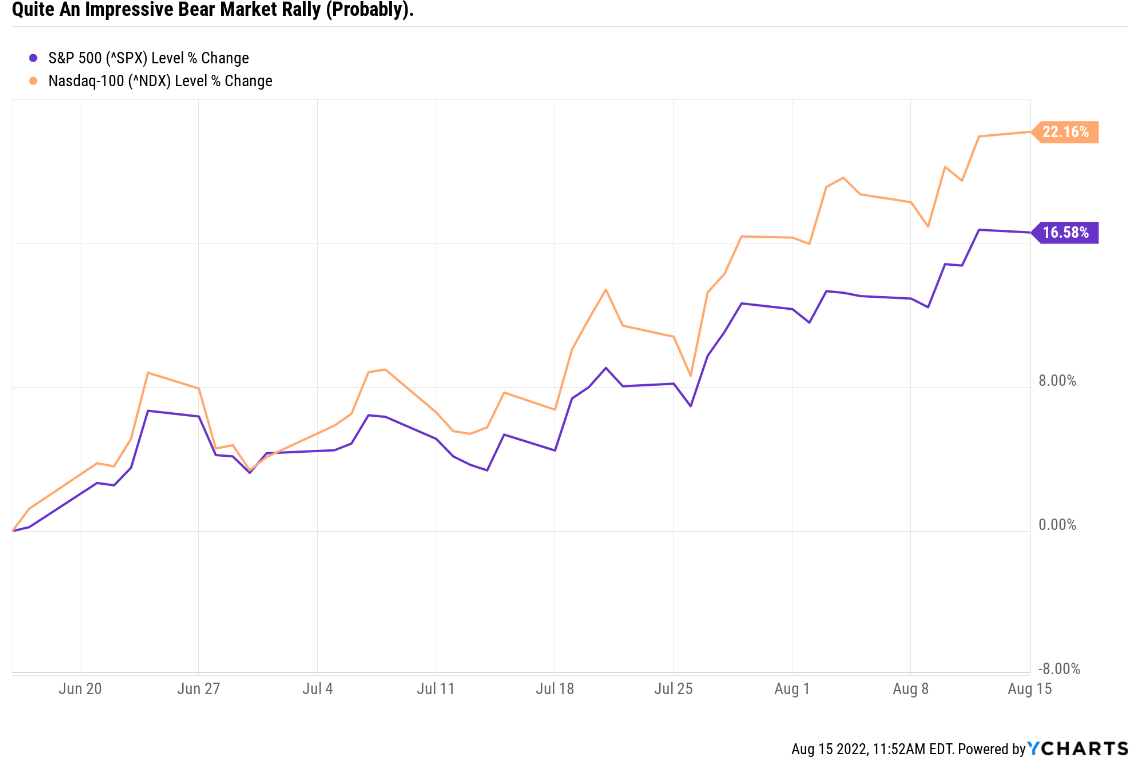
Why is this rally so irrational? Aren’t I always telling readers that after big market declines, market nirvana soon follows?
Charlie Bilello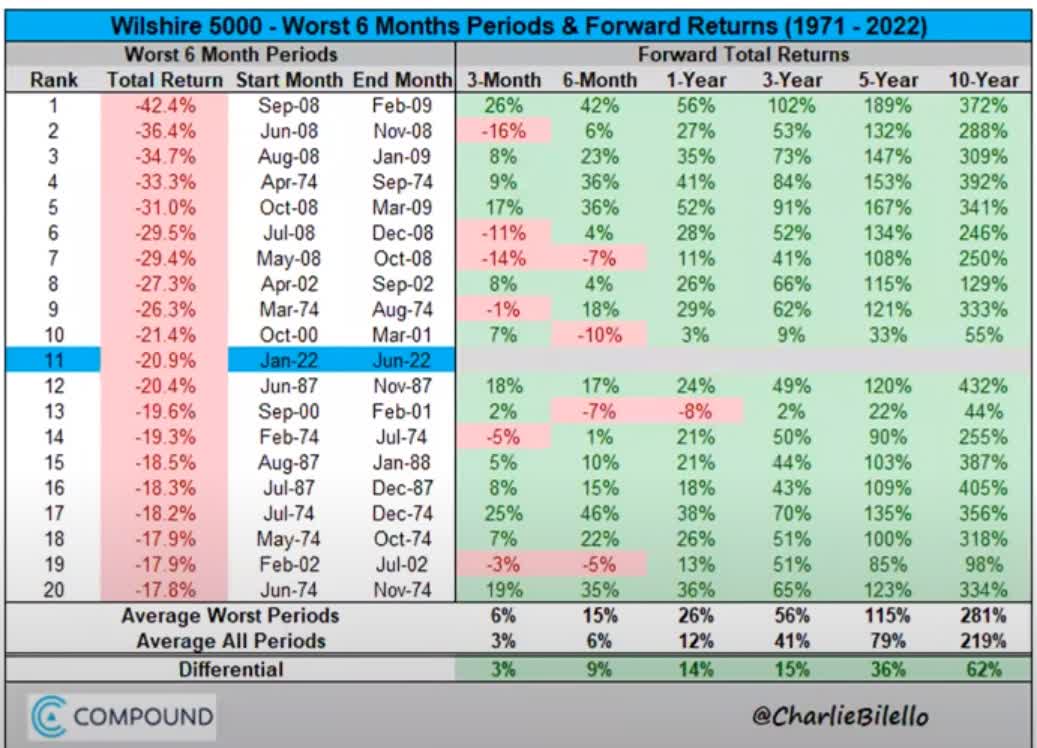
That’s true, BUT let’s not forget what Ben Graham said.
The intelligent investor is a realist who buys from pessimists and sells to optimists. – The Intelligent Investor
This likely bear market rally is irrational because it’s based almost entirely on technical indicators and short covering, not fundamentals.
- six Fed presidents have come out to debunk the “fed pivot” meme
- inflation is likely to remain high for several years, causing the Fed to not cut rates until 2024
- corporate earnings estimates are falling by 0.3% to 0.4% per week
- the market’s forward P/E of 18.2X is now back in the danger zone
Daily Shot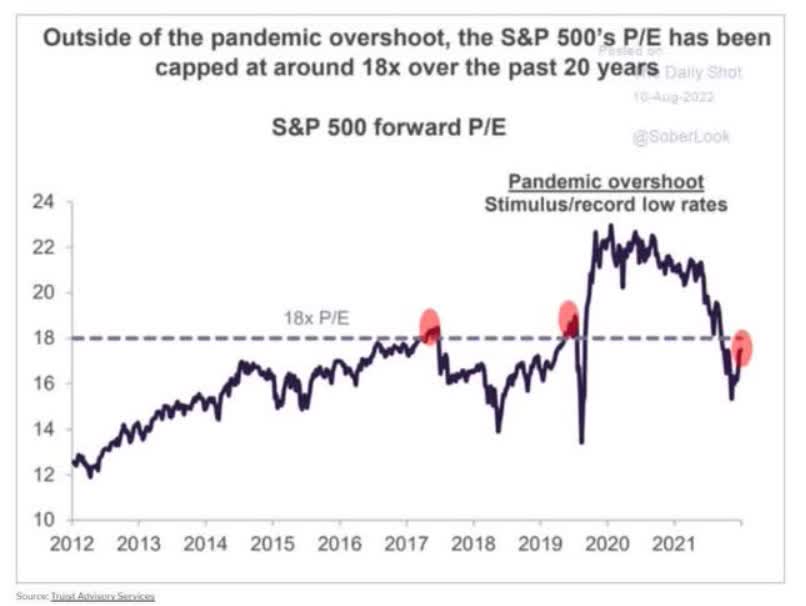
The S&P has never been able to sustain a forward P/E of 18 or higher without significant short-term correction risk.
That doesn’t mean stocks can’t keep rising in the short-term; it just means anyone buying the broader market hoping for quick profits driven by momentum is playing musical chairs.
And today, there are a lot of risks that could cause the music to stop.
- historically 20+% bear markets have NEVER bottomed until AFTER the Fed has cut at least once
- the Fed is SAYING it has no plans to cut until 2024
- historically Fed hiking cycles don’t see peak interest rates until the Fed funds rate climbs above inflation (the Fed could hike above 4%, well above current expectations)
- recession risk is rising: a mild recession is now an 80% risk starting in January 2023
I’m hardly the only analyst skeptical of this rally, which is well within historical norms for bear market fakeouts.
- Federated Hermes
- Morgan Stanley
- Fundastrat
These are just some analyst teams who expect the market to resume falling soon and not bottom until later this year (potentially about 30% lower).
Daily Shot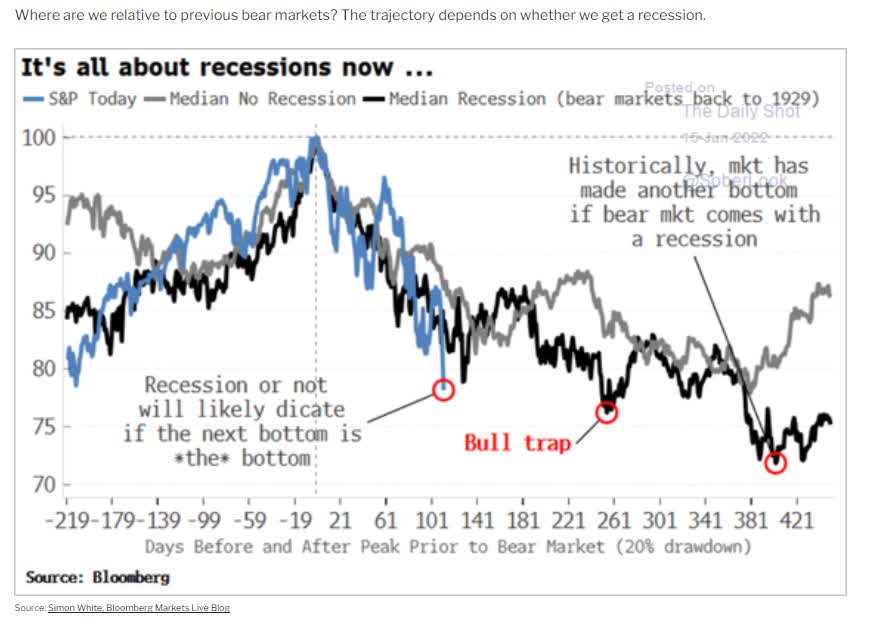
Historically, recessionary bear markets have four bear market rallies, and the last plunge is the most severe.
Daily Shot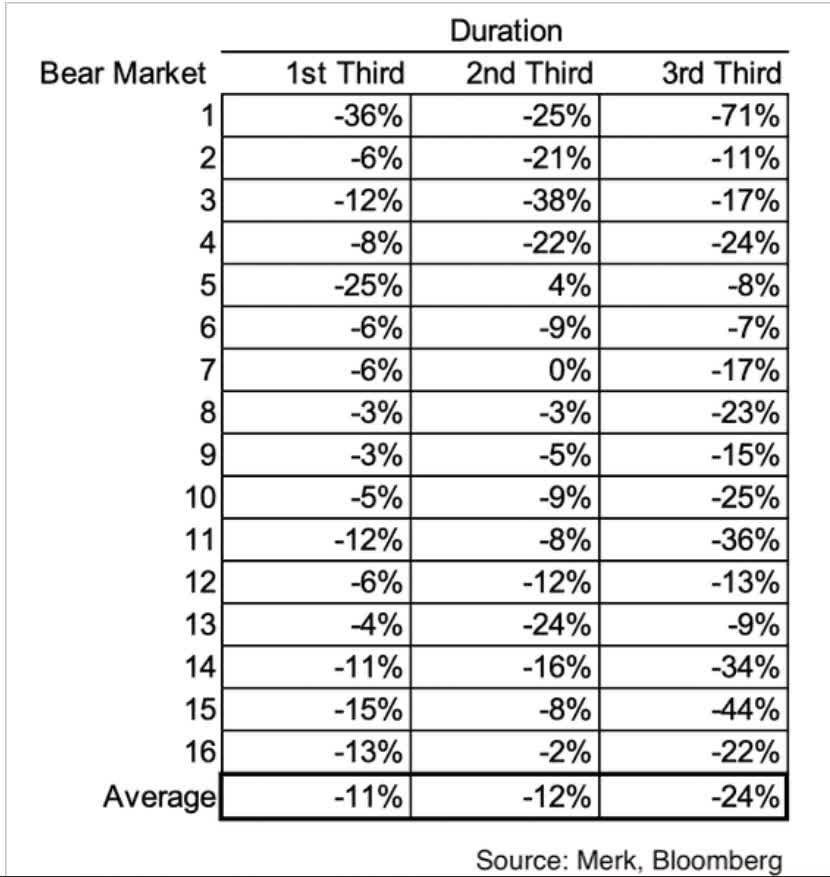
But Wall Street runs on probabilities, and it’s always possible that the market keeps melting up, even hits new highs, and the bear market ends. Mind you the recession that the bond market and economic fundamentals say is likely in January 2023 could result in a new bear market in 2023.
- We could potentially even have two bear markets in the same year
- it would be the first time in history but the risk of this unprecedented scenario is growing
So what’s an investor to do? Hide in cash? Triple leverage short the market? Buy deep out of the money puts? Stockpile canned food, guns, and gold?
Nothing so extreme is necessary to stay safe or sane in this dangerous market.
Morgan Stanley, Bank of America, and Schwab are recommending their clients follow a common sense approach.
- long duration US treasuries as a recession hedge (25% to 50% upside potential is the consensus in a recession)
- dividend blue-chips (which tend to be defensive in falling markets)
Ok, that makes sense, but what is a defensive dividend blue-chip? There are many ways to estimate defensiveness, but one approach I like to use is the four priorities of success long-term income investors.
Dividend Kings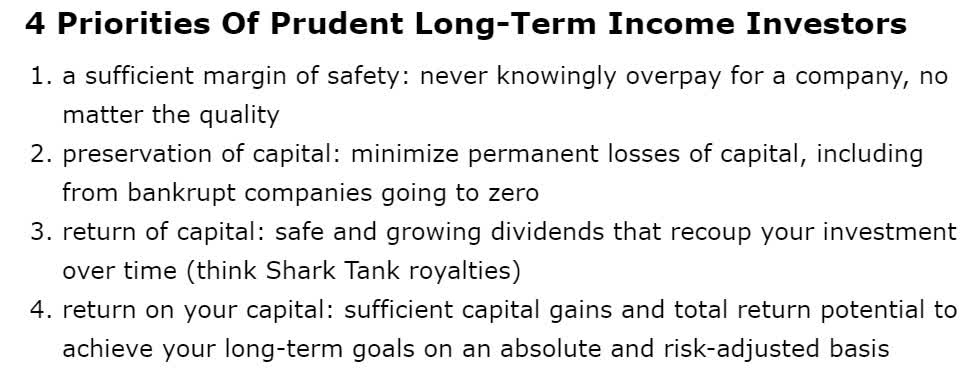
We’ve taken these four priorities and built an entire tool around them that can be sorted by dozens of metrics, including the Automated Investment Decision score.
- compares each company’s fundamental priorities against the S&P 500
- the default alternative for many investors
100% A+ Exceptional Long-Term Investing Opportunities
Dividend Kings Automated Investment Decision Tool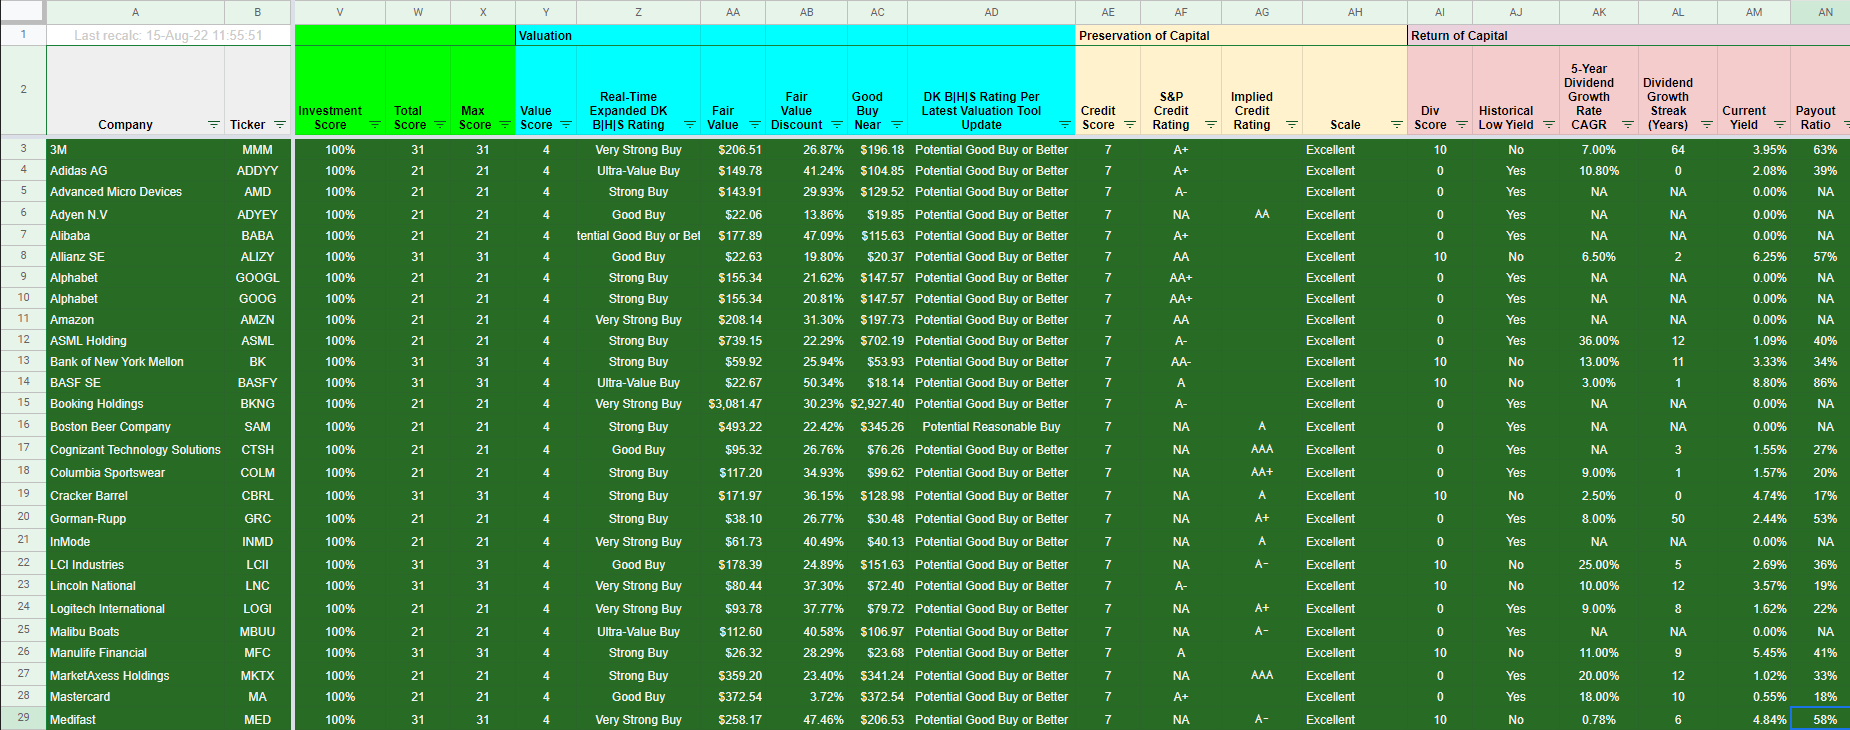
Going through this list, sorted by as close to perfect quality investment opportunities as can exist on Wall Street, I selected eight high-yield blue-chips I can confidently recommend for anyone nervous about this dangerous market.
And by using the Dividend Kings Zen Research Terminal’s watchlist builder, we can analyze all eight of them individually and as a mini-portfolio.
So let me show you why these eight impeccable high-yield blue-chip bargains are potentially wonderful, safe long-term investments, no matter which way the market moves next.
8 Near Perfect High-Yield Blue-Chip Bargains To Buy Now
Dividend Kings Zen Research Terminal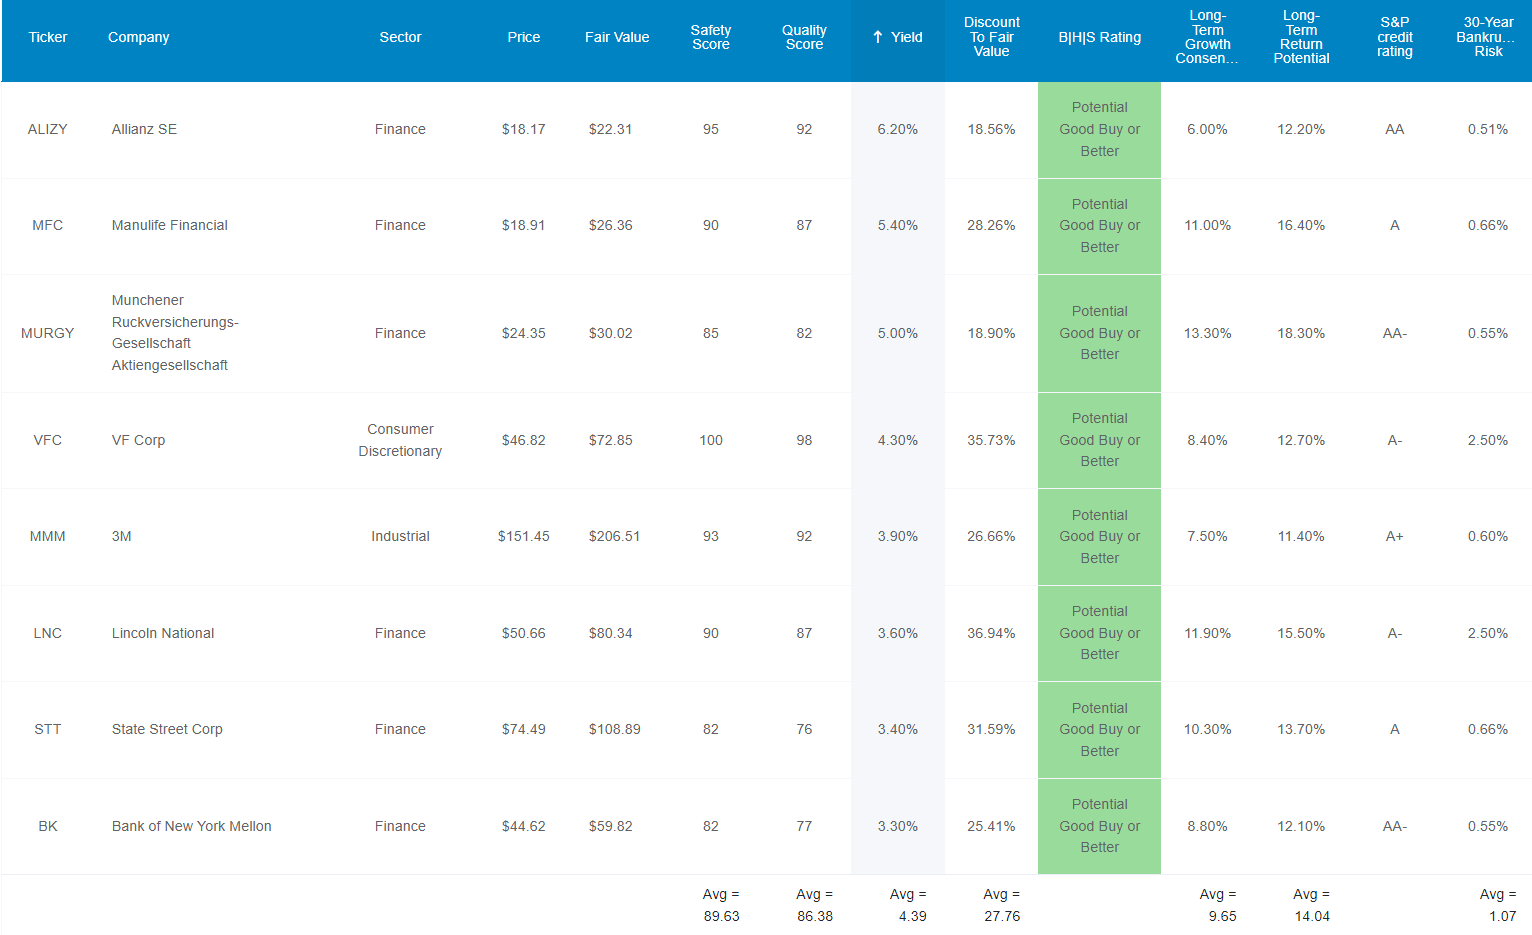
I’ve linked to articles exploring each company’s investment thesis, risk profile, growth prospects, valuation, and total return potential.
Tax Note
- ALIZY and MURGY are German companies
- 26.375% dividend tax withholding for investors
- own in a taxable account in order to be able to recoup the withholding via a tax credit (with some paperwork involved)
- retirement accounts are NOT eligible for the tax credit
FAST Graphs Up Front
Allianz 2024 Consensus Total Return Potential (1.1 Book Value = 12X Earnings)
(Source: FAST Graphs, FactSet)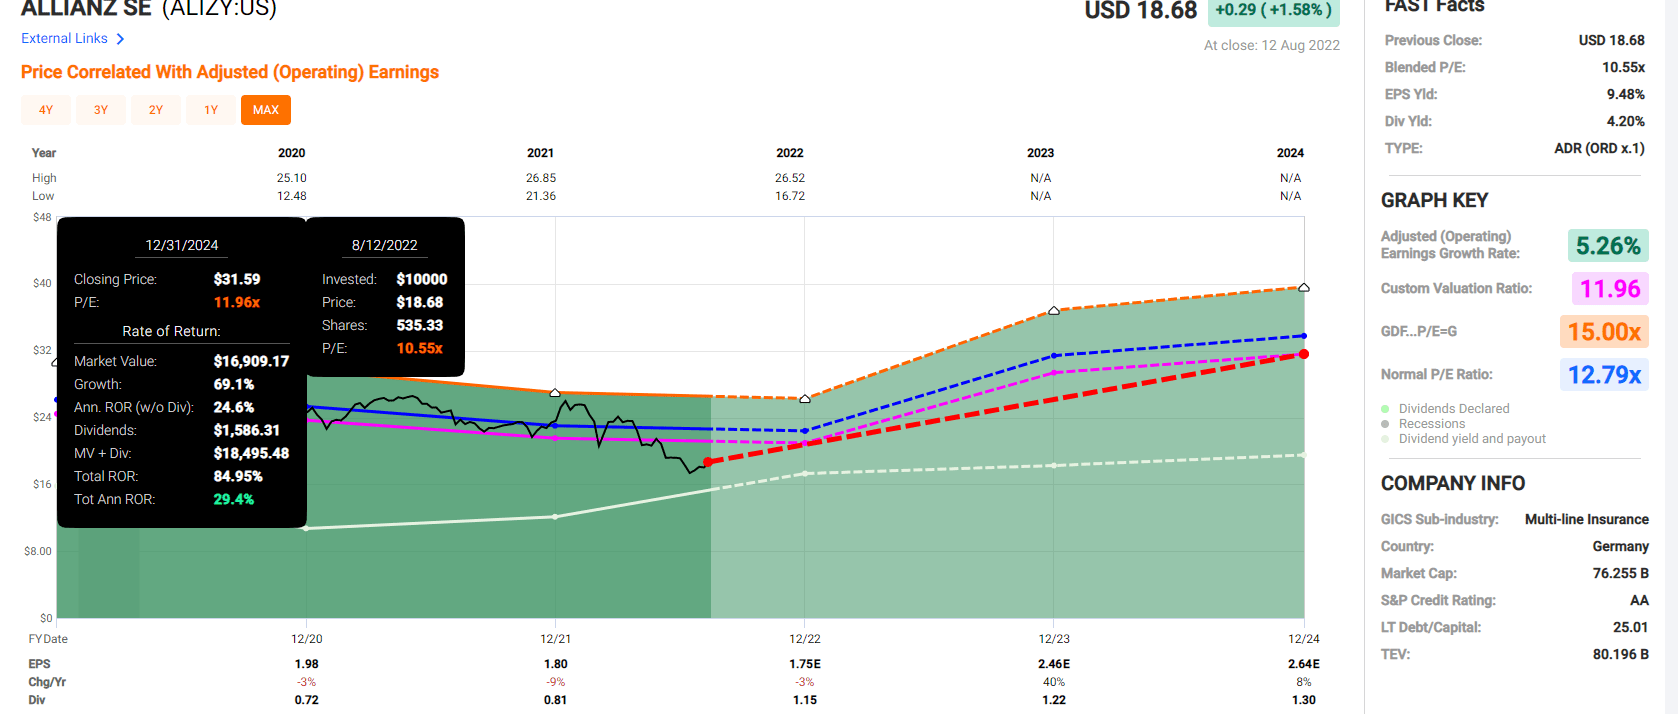
Manulife 2024 Consensus Total Return Potential
(Source: FAST Graphs, FactSet)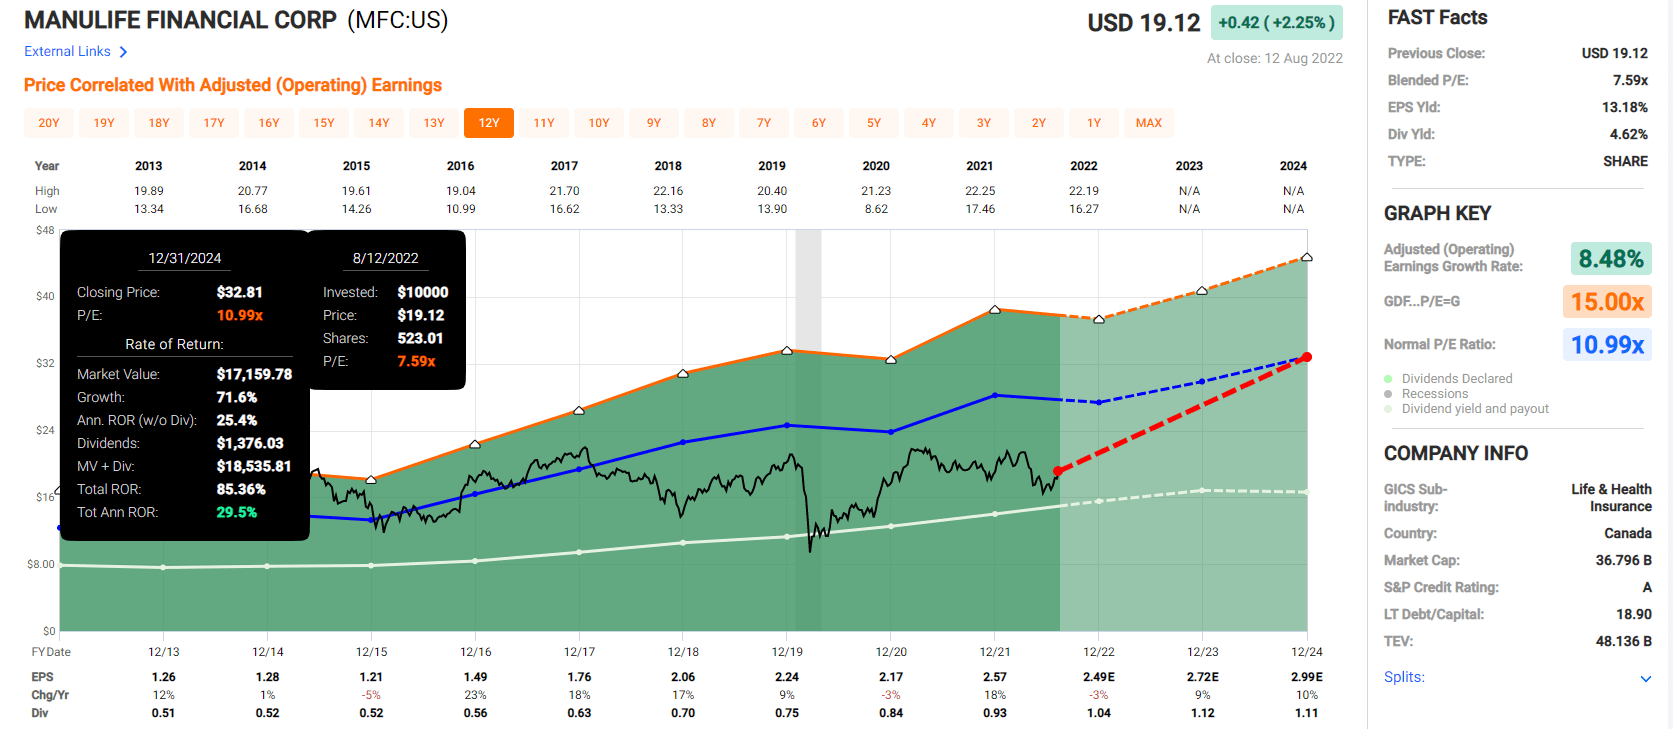
Munich Re 2024 Consensus Total Return Potential
(Source: FAST Graphs, FactSet)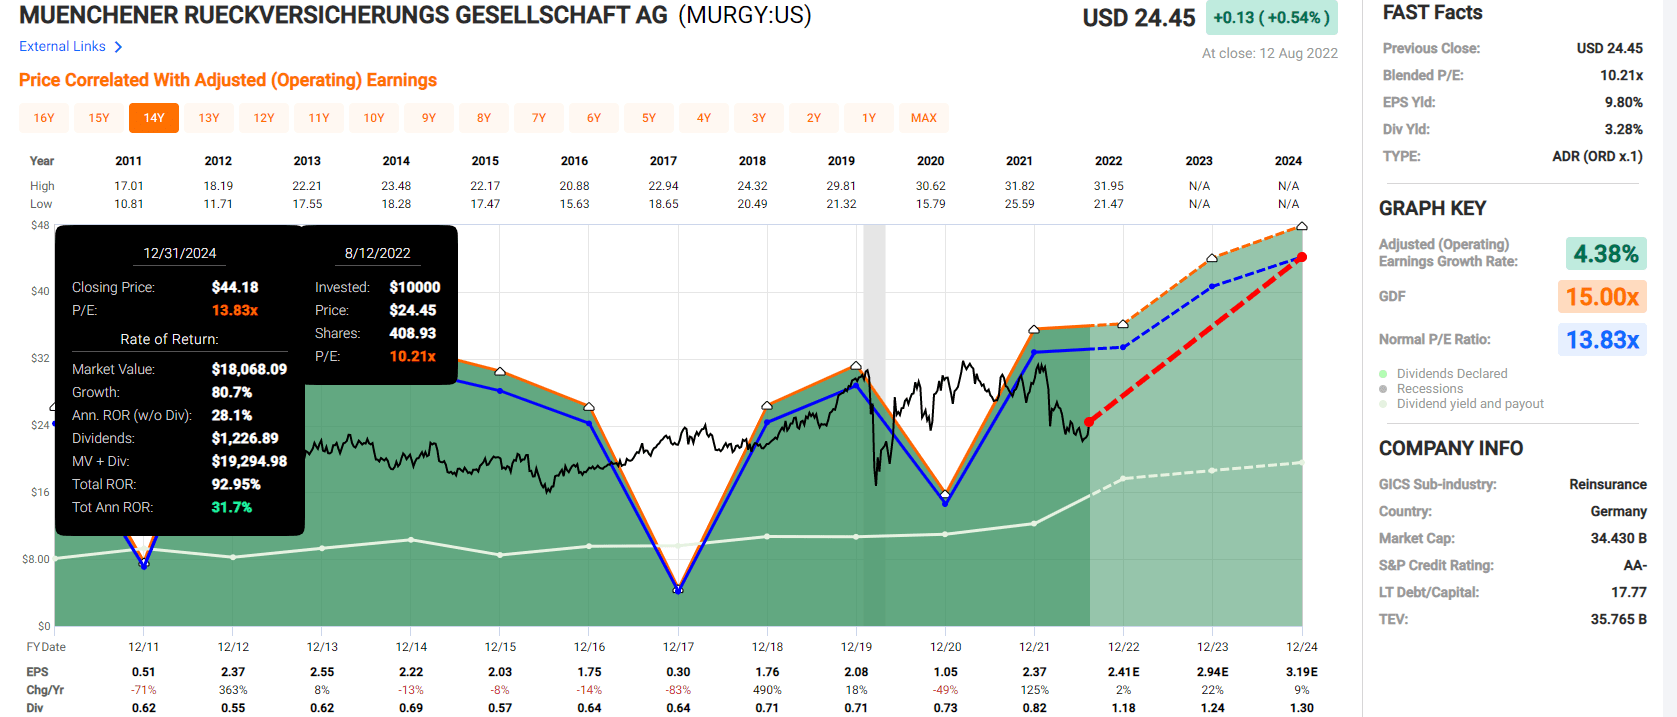
V.F. Corp 2024 Consensus Total Return Potential
(Source: FAST Graphs, FactSet)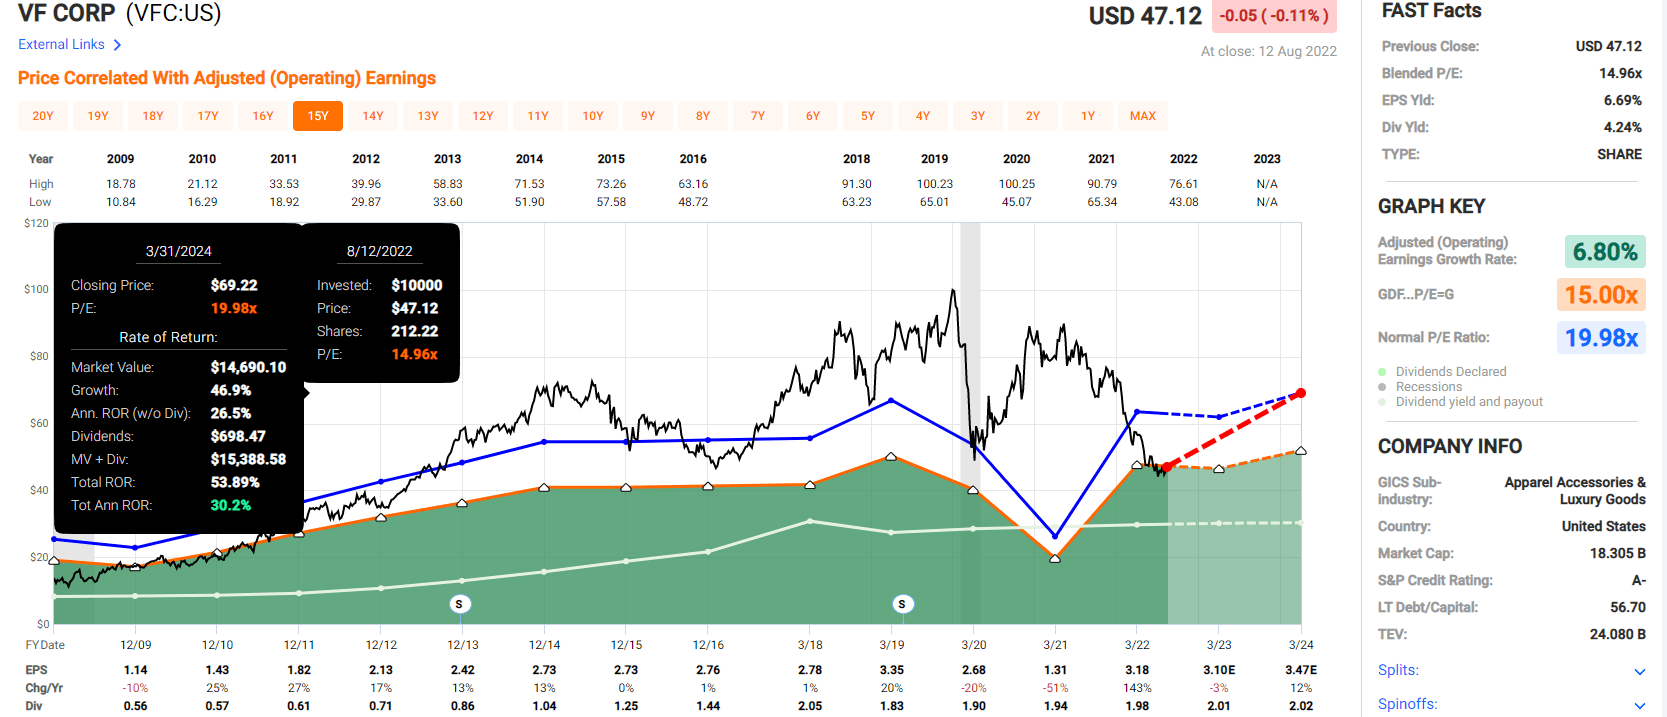
3M Corp 2024 Consensus Total Return Potential
(Source: FAST Graphs, FactSet)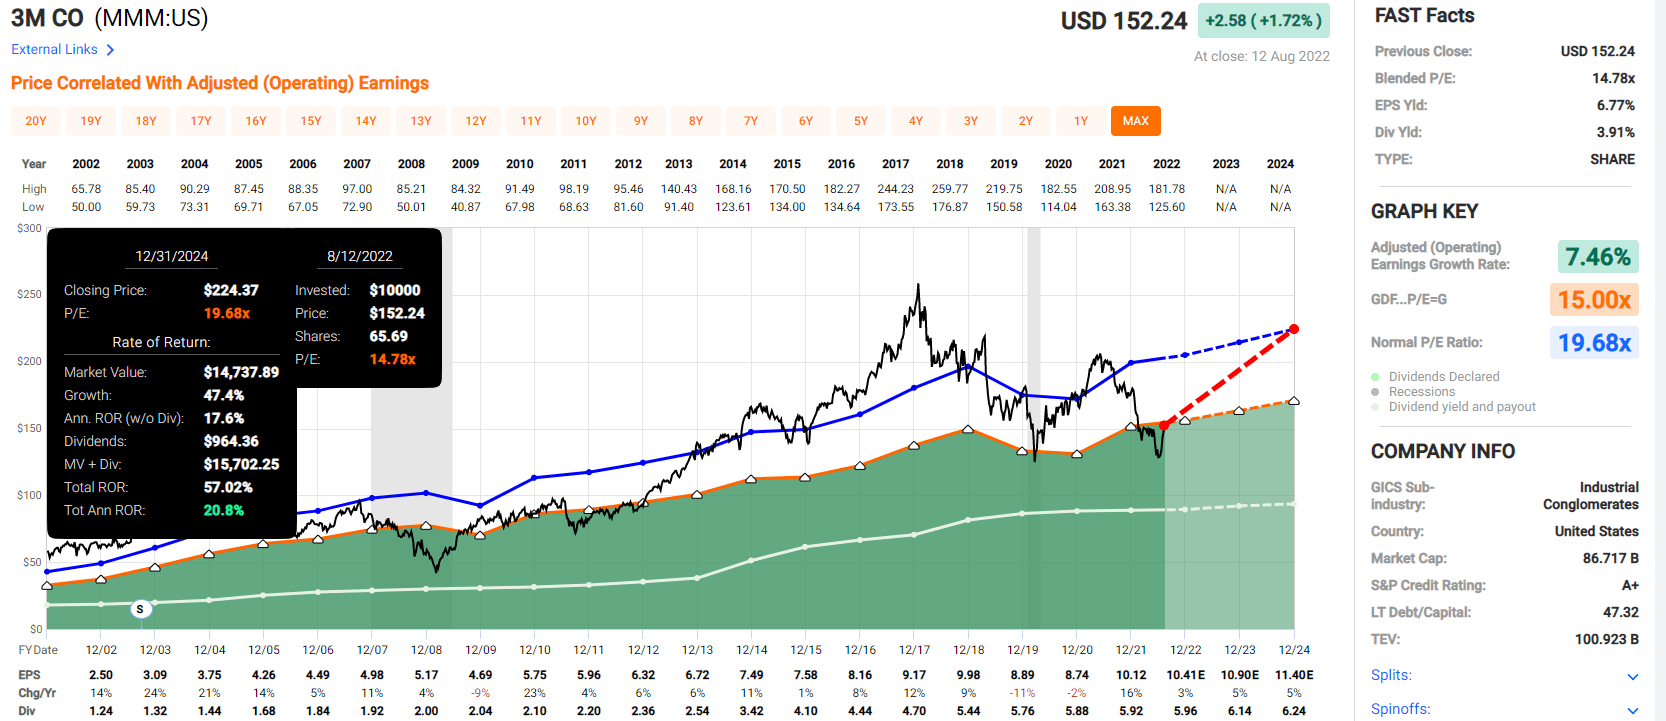
Lincoln National 2024 Consensus Total Return Potential
(Source: FAST Graphs, FactSet)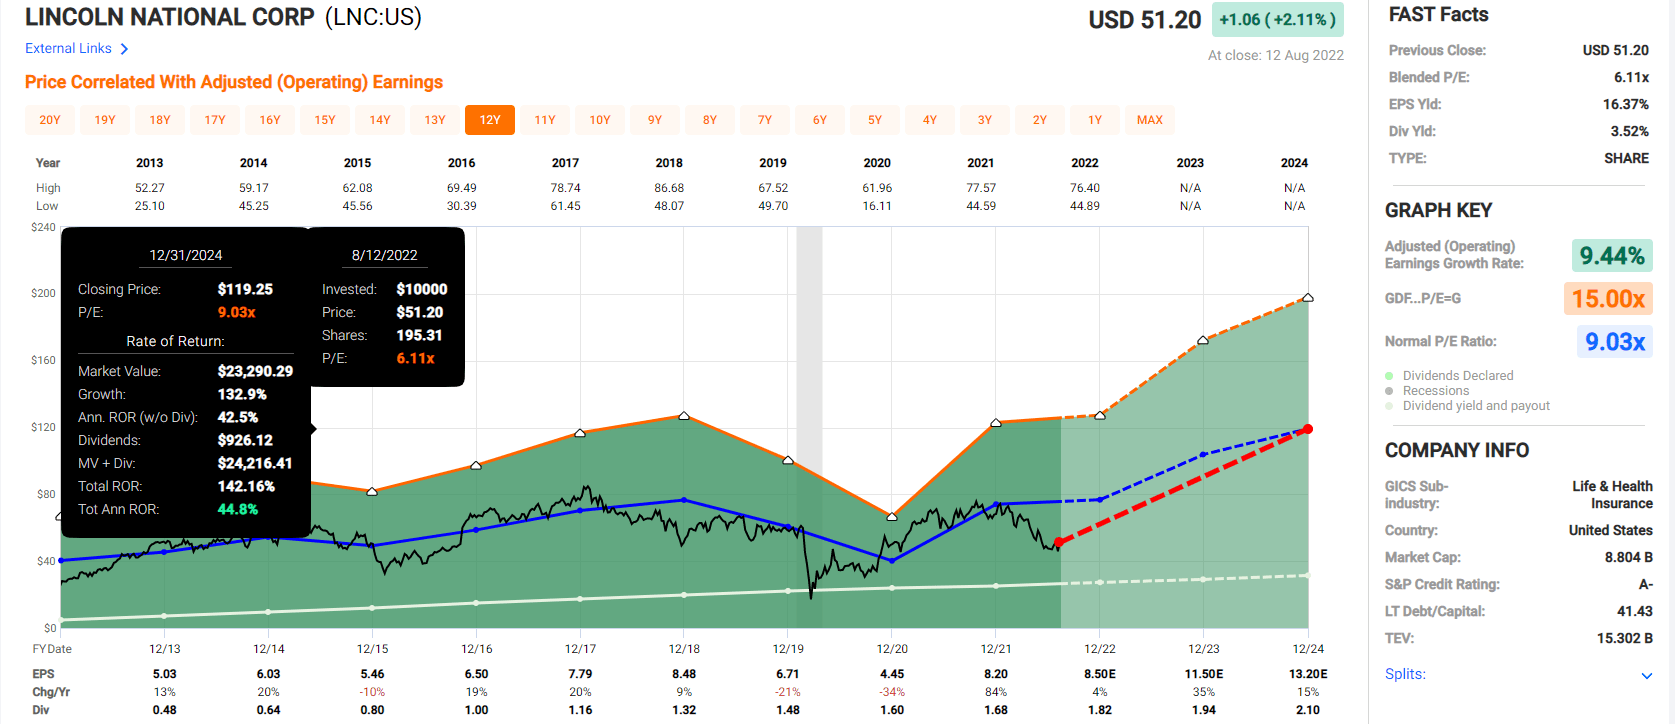
State Street 2024 Consensus Total Return Potential
(Source: FAST Graphs, FactSet)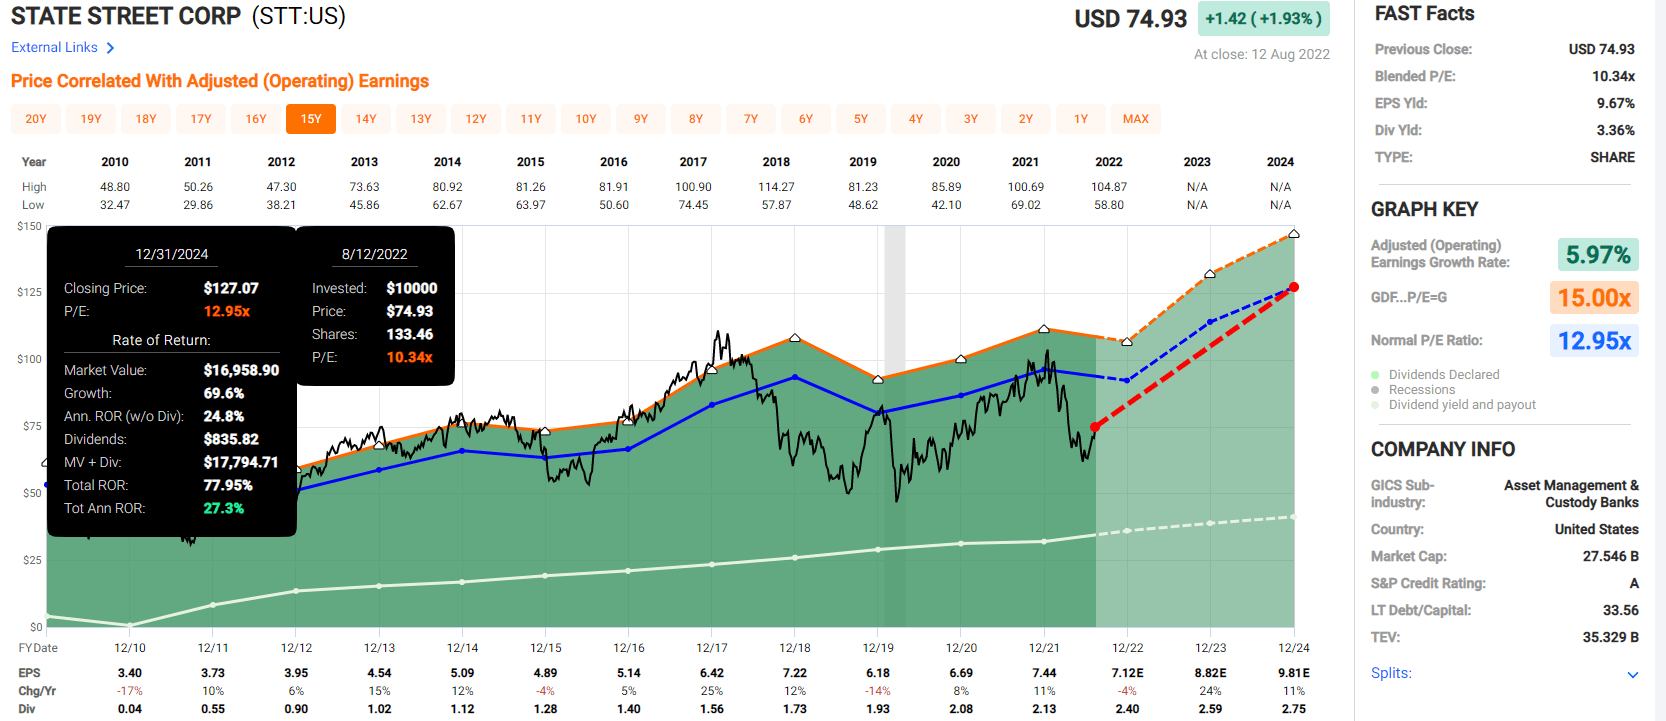
Bank of New York Mellon 2024 Consensus Total Return Potential
(Source: FAST Graphs, FactSet)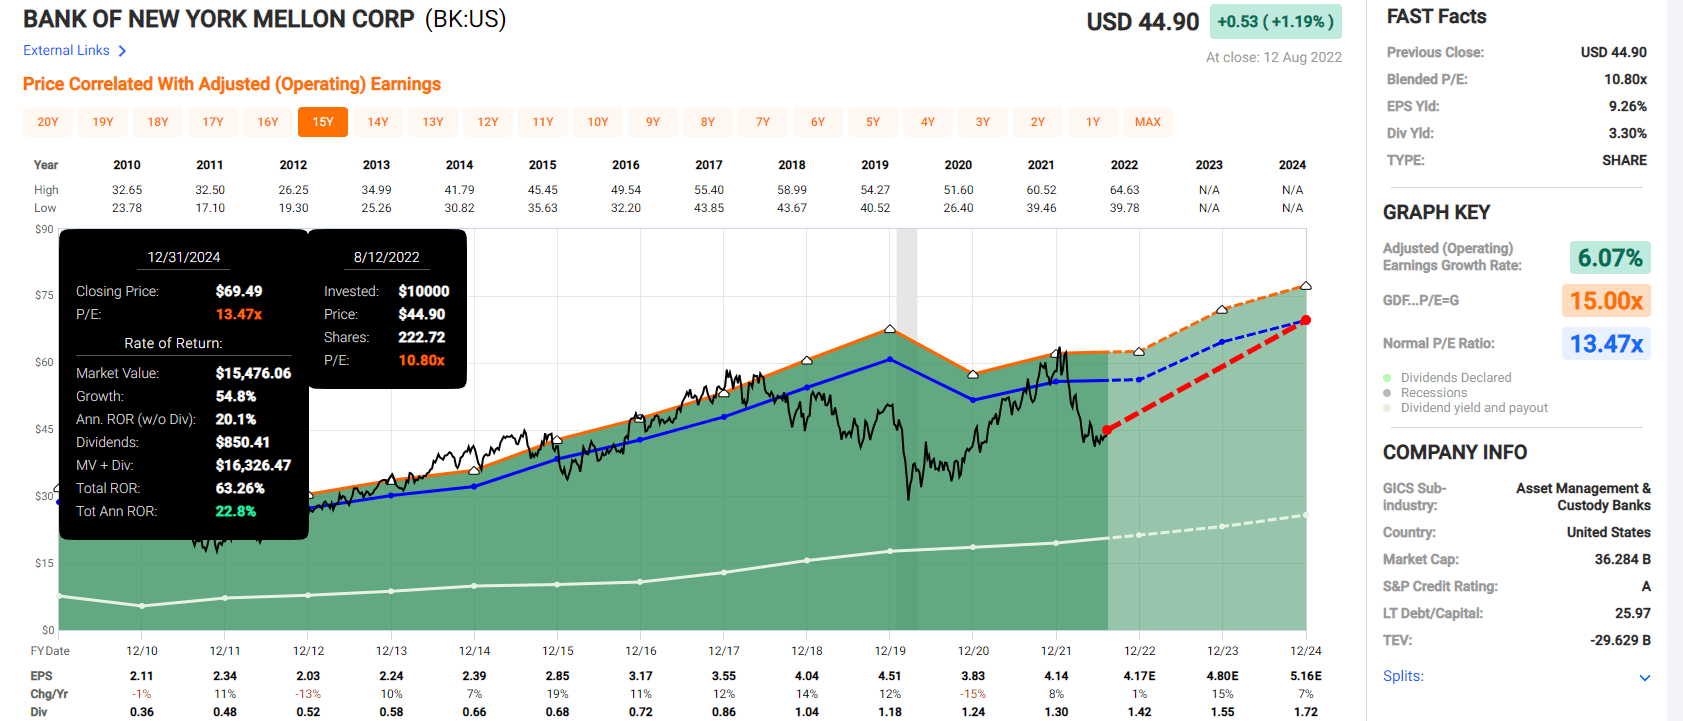
Now compare that to the S&P 500 consensus return potential.
S&P 500 2024 Consensus Total Return Potential
(Source: FAST Graphs, FactSet)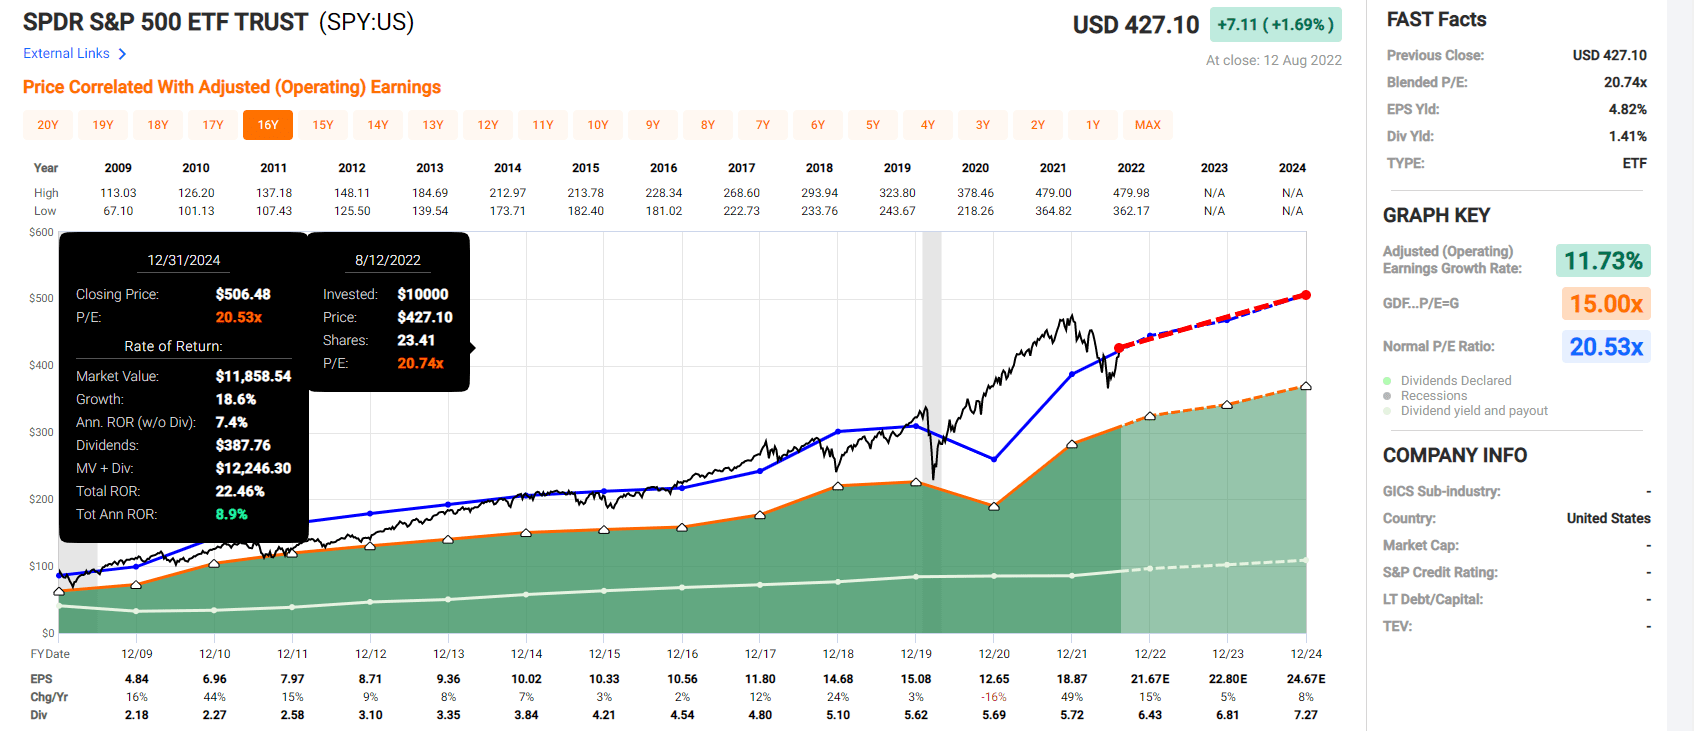
Analysts expect about 23% total returns from the market through 2024, or about 9% annually.
They expect a 93% total return, or 30% annually, from these high-yield A-rated blue-chips.
- 4X the market’s consensus return potential through 2024
- and 3X the market’s yield
- Buffett-like return potential from blue-chip bargains hiding in plain sight
But my goal isn’t to help you potentially double your money in 2.5 years, my goal is to help you achieve financial freedom with the world’s best dividend blue-chips.
8 Of The World’s Highest Quality Dividend Blue-Chips
(Source: Dividend Kings Zen Research Terminal)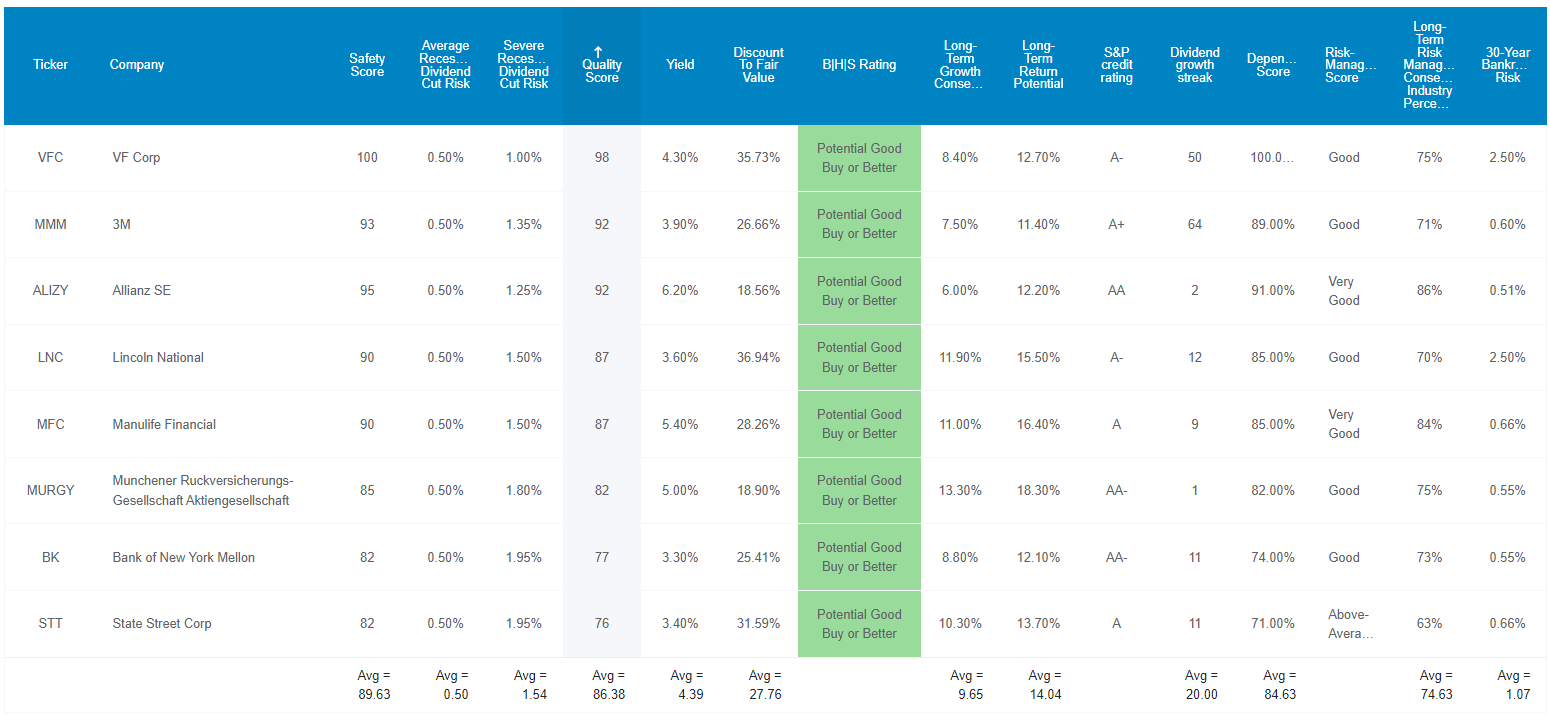
These aren’t just very safe blue-chips, they are A-rated Super SWANs (sleep well at night), some of the world’s most dependable dividend stocks.
How can we tell? By comparing their fundamentals to the bluest of blue-chips the dividend aristocrats.
Quality On Par With The Dividend Aristocrats And Far Better Investment Prospects
| Metric | Dividend Aristocrats | 8 Near-Perfect High-Yield Blue Chip Buys | Winner Dividend Aristocrats |
Winner 8 Near-Perfect High-Yield Blue Chip Buys |
| Quality | 87% | 86% | 1 | |
| Safety | 90% | 90% | 1 | 1 |
| Average Recession Dividend Cut Risk | 0.5% | 0.5% | 1 | 1 |
| Severe Recession Dividend Cut Risk | 1.5% | 1.5% | 1 | 1 |
| Dependability | 84% | 85% | 1 | |
| Dividend Growth Streak (Years) | 44.8 | 20.0 | 1 | |
| Long-Term Risk Management Industry Percentile | 67% Above-Average | 75% Good | 1 | |
| Average Credit Rating | A- Stable | A Stable | 1 | |
| Average Bankruptcy Risk | 3.04% | 1.07% | 1 | |
| Average Return On Capital | 88% | 38% | 1 | |
| Average ROC Industry Percentile | 69% | 88% | 1 | |
| 13-Year Median ROC | 74% | 51% | 1 | |
| Forward PE | 20.8 | 9.5 | 1 | |
| Discount To Fair Value | -3% | 28% | 1 | |
| DK Rating | Hold | Strong Buy | 1 | |
| Yield | 2.4% | 4.4% | 1 | |
| LT Growth Consensus | 8.7% | 9.7% | 1 | |
| Total Return Potential | 11.1% | 14.1% | 1 | |
| Risk-Adjusted Expected Return | 7.5% | 9.5% | 1 | |
| Inflation & Risk-Adjusted Expected Return | 5.3% | 7.3% | 1 | |
| Conservative Years To Double | 13.5 | 9.9 | 1 | |
| Total | 7 | 17 |
(Source: Dividend Kings Zen Research Terminal)
These exceptional high-yield Super SWANs are on par with the dividend aristocrats in safety and quality.
- identical 0.5% average recession dividend cut risk
- identical 1.5% severe recession dividend cut risk
Their average dividend growth streak might not match the aristocrats’ 45 years, but they are 20 years, the Ben Graham standard of excellence.
Pandemic Dividend Cuts By Dividend Growth Streak
Justin Law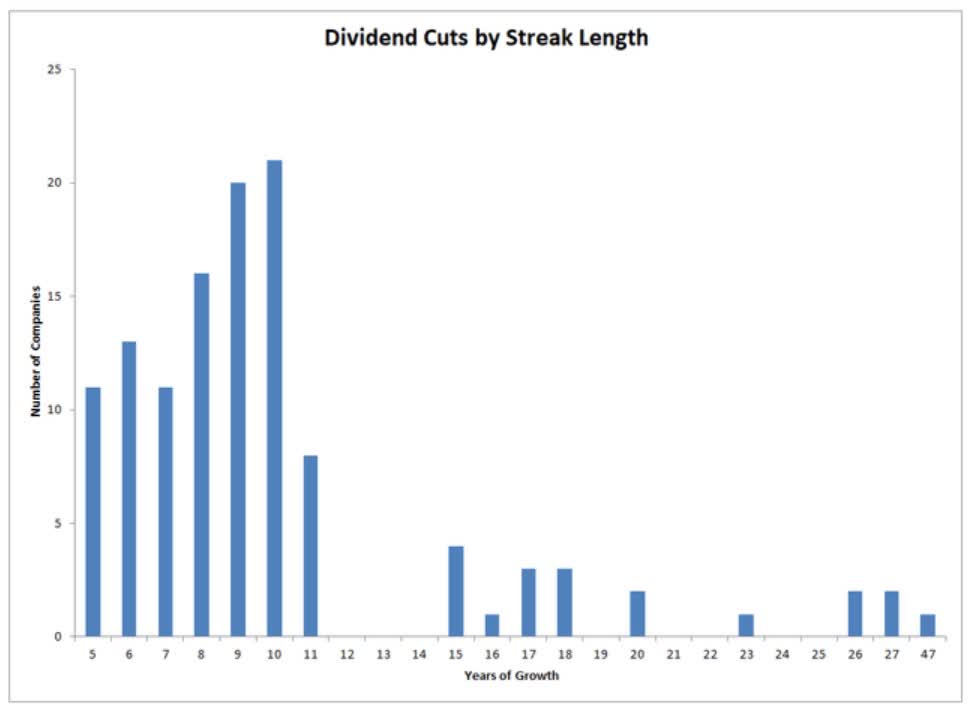
And it’s almost twice the 12-year dividend growth streak that protected income investors from most dividend cuts during the Pandemic, the worst economic shock in over 75 years.
Joel Greenblatt considers return on capital, or ROC, his gold standard proxy for moatiness and quality.
- annual pre-tax profit/the cost of running the business
The S&P 500’s ROC is 14.6%, and the aristocrat’s is 88%. These high-yield Super SWANs have 38%, below the aristocrats but nearly 3X that of the S&P 500.
Their ROC is in the 88th percentile of their respective industries, above the aristocrat’s 69%.
And their 13-year median ROC is 51%, indicating relatively wide and stable moats across industry and economic cycles.
S&P estimates their average credit rating at A stable, slightly above the aristocrats A- stable.
That means a 1.07% average 30-year bankruptcy risk compared to the Aristocrat’s 3%.
- almost 2X the yield and 1/3 the fundamental risk
Six rating agencies estimate these Super SWAN’s long-term risk management, especially crucial for financials, at the 75th industry percentile. How good is that?
Average Long-Term Risk Management Is The 116th Best In The Master List (77th Percentile)
| Classification | Average Consensus LT Risk-Management Industry Percentile |
Risk-Management Rating |
| S&P Global (SPGI) #1 Risk Management In The Master List | 94 | Exceptional |
| Strong ESG Stocks | 78 |
Good – Bordering On Very Good |
| 8 Near Perfect High-Yield Blue-Chip Buys | 75 | Good |
| Foreign Dividend Stocks | 75 | Good |
| Ultra SWANs | 71 | Good |
| Low Volatility Stocks | 68 | Above-Average |
| Dividend Aristocrats | 67 | Above-Average |
| Dividend Kings | 63 | Above-Average |
| Master List average | 62 | Above-Average |
| Hyper-Growth stocks | 61 | Above-Average |
| Monthly Dividend Stocks | 60 | Above-Average |
| Dividend Champions | 57 | Average |
(Source: DK Research Terminal)
These Ultra SWAN’s average risk-management consensus is in the top 23% of the world’s highest quality companies and similar to that of such other blue-chips as
- Novo Nordisk (NVO): Ultra SWAN global aristocrat
- Philip Morris International (PM): Ultra SWAN dividend king
- Canadian National Railway (CNI): Ultra SWAN global aristocrat
- Target (TGT): Ultra SWAN dividend king
- Texas Instruments (TXN): Ultra SWAN
- Royal Bank of Canada (RY): Ultra SWAN
- Bank of Montreal (BMO): Ultra SWAN
- Qualcomm (QCOM): Ultra SWAN
- Moody’s (MCO): Ultra SWAN
- Visa (V): Ultra SWAN
All companies have risks, but these eight high-yield blue-chips are good at managing theirs according to:
- five credit rating agencies
- ten risk rating agencies
- 153 analysts that cover them on Wall Street
- the bond market provides real-time fundamental risk updates via credit default swap spreads
OK, now that you know why I trust these near-perfect high-yield Super SWAN buys, here’s why you might want to buy them today.
Wonderful Companies At Wonderful Prices
(Source: Dividend Kings Zen Research Terminal)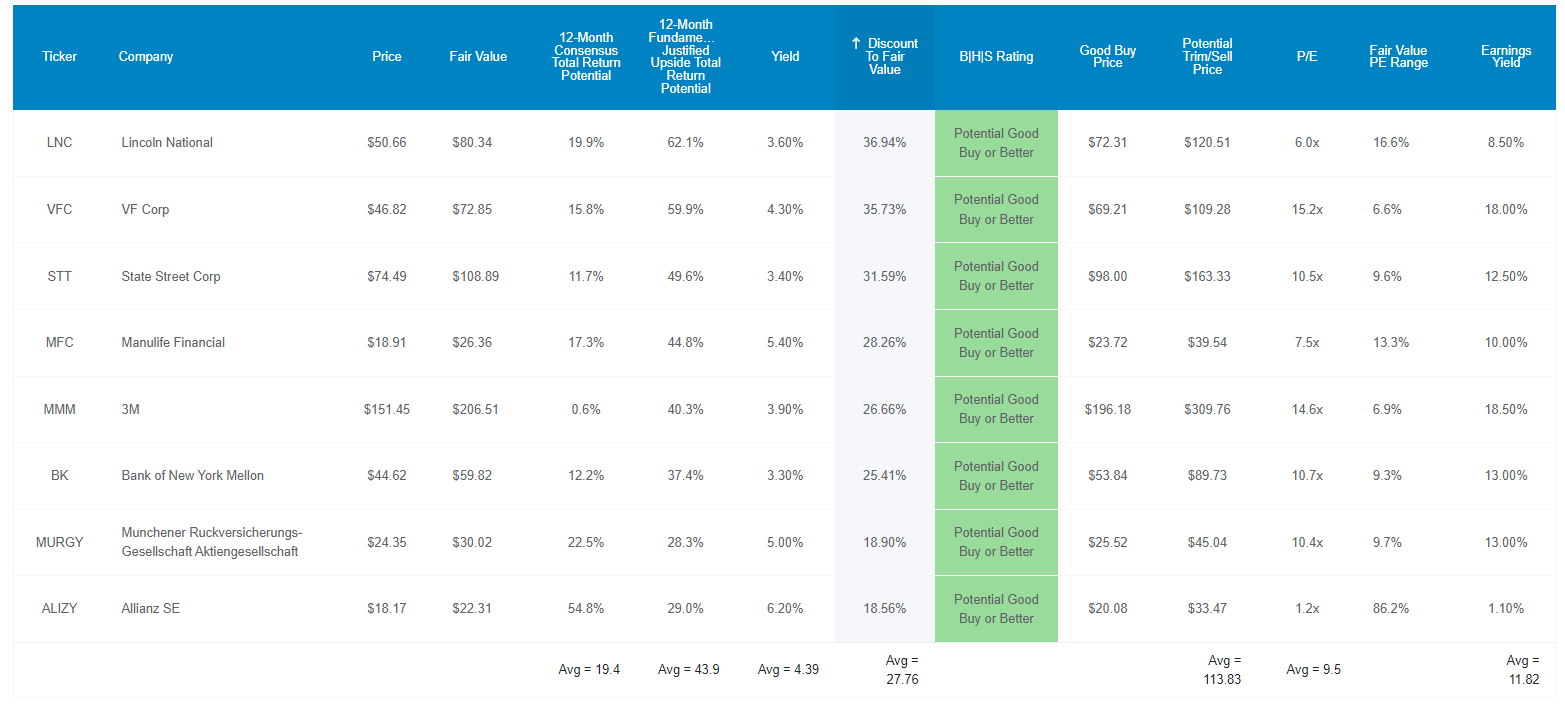
For context, the S&P 500 trades at 18.2X earnings, an 8% historical premium.
The dividend aristocrats trade at 20.8X earnings, a 3% historical premium.
These near-perfect high-yield blue-chip investment opportunities trade at 9.5X earnings. How low is that?
- the S&P 500’s lowest P/E in the Great Recession was 10.4X
These Super SWANs are literally trading at Great Recession valuations and a 28% historical discount.
That’s why analysts expect them to deliver 19% total returns within a year, and that’s with a recession bearing down on us.
They are so undervalued that their 12-month fundamentally justified total return potential is 44%.
- how much you’d earn if all of them grew as expected and returned to historical midrange market-determined fair value
Or another way to put it is that if these Super SWANs soared 44% in the next year, it would be 100% fundamentally justified by fundamentals.
What if the S&P soared by 44% in the next year? That would be a 23.8X forward P/E, a 41% overvalued market, the 2nd biggest bubble in history, 2nd only to the tech bubble.
- 25.2X forward earnings, a 50% historical premium
But my goal isn’t to help you earn 19% returns or even 44% returns in a year or double your money in 2.5 years. My goal is to help you potentially earn 10X to 20X returns over decades. All while swimming in safe and steadily growing dividends.
High-Yield Blue-Chips That Could Deliver 10X to 20X Returns Over Decades
(Source: Dividend Kings Zen Research Terminal)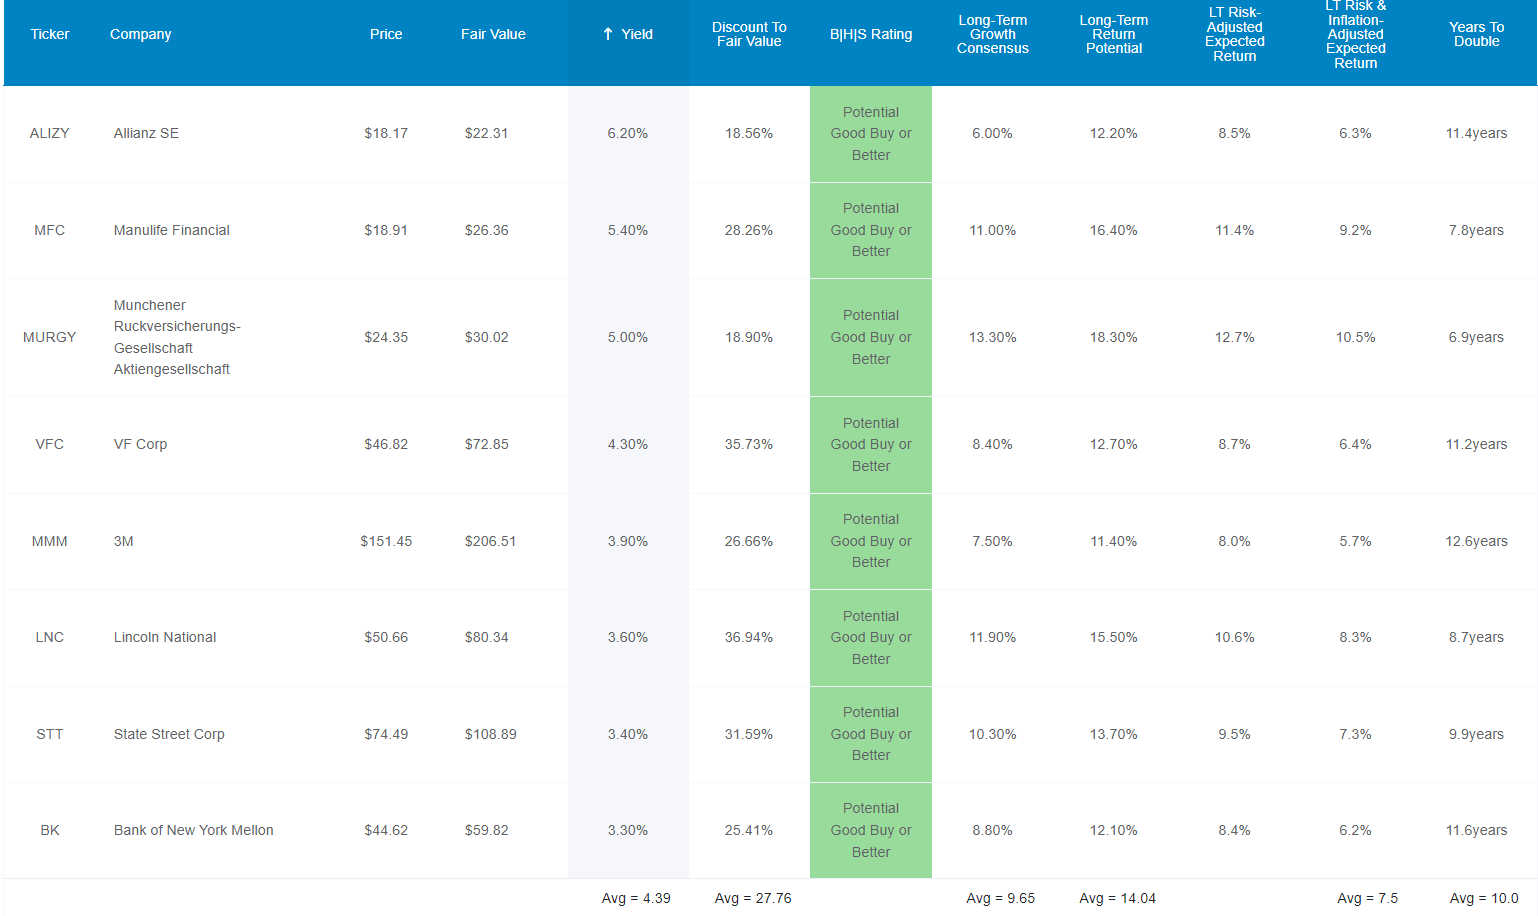
Not only do these near-perfect high-yield Super SWAN bargains offer one of the world’s safest 4.4% yields, but analysts think they could grow at 9.7% in the future.
I’m a bit skeptical of that, though at 9.5X earnings, buybacks could easily provide 33% to 50% of that growth rate.
The risk-adjusted expected returns is 9.5% CAGR, which adjusts for the historical risk of these companies not growing as expected and bankruptcy.
I consider this a conservative estimate of the kinds of realistic returns investors can expect in the future.
Adjust for the bond market’s long-term inflation expectations of 2.2%, and you get a risk and inflation-adjusted return potential of 7.5% CAGR, which doesn’t sound very exciting.
But it could very well change your life over decades.
Inflation And Risk-Adjusted Expected Return Forecast: $1,000 Initial Investment
| Time Frame (Years) | 4.9% CAGR Inflation And Risk-Adjusted S&P Consensus | 5.3% Inflation-Adjusted Aristocrat Consensus | 7.3% CAGR Inflation-Adjusted 8 Near Perfect High-Yield Blue-Chip Buys Consensus | Difference Between Inflation-Adjusted 8 Near Perfect High-Yield Blue-Chip Buys And S&P Consensus |
| 5 | $1,270.22 | $1,294.62 | $1,422.32 | $152.11 |
| 10 | $1,613.45 | $1,676.04 | $2,023.01 | $409.56 |
| 15 | $2,049.43 | $2,169.83 | $2,877.37 | $827.94 |
| 20 | $2,603.21 | $2,809.10 | $4,092.55 | $1,489.34 |
| 25 | $3,306.64 | $3,636.72 | $5,820.94 | $2,514.30 |
| 30 | $4,200.15 | $4,708.16 | $8,279.26 | $4,079.11 |
| 35 | $5,335.09 | $6,095.27 | $11,775.80 | $6,440.70 |
| 40 | $6,776.72 | $7,891.05 | $16,749.00 | $9,972.28 |
| 45 | $8,607.90 | $10,215.90 | $23,822.51 | $15,214.61 |
| 50 | $10,933.88 | $13,225.70 | $33,883.33 | $22,949.45 |
(Source: DK Research Terminal, FactSet Consensus)
Even using the most conservative adjustments, these high-yield Super SWANs are capable of 34X returns over an investing lifetime, far more than the S&P 500 or dividend aristocrats.
| Time Frame (Years) | Ratio Aristocrats/S&P Consensus | Ratio Inflation-Adjusted 8 Near Perfect High-Yield Blue-Chip Buys vs. S&P consensus |
| 5 | 1.02 | 1.12 |
| 10 | 1.04 | 1.25 |
| 15 | 1.06 | 1.40 |
| 20 | 1.08 | 1.57 |
| 25 | 1.10 | 1.76 |
| 30 | 1.12 | 1.97 |
| 35 | 1.14 | 2.21 |
| 40 | 1.16 | 2.47 |
| 45 | 1.19 | 2.77 |
| 50 | 1.21 | 3.10 |
(Source: DK Research Terminal, FactSet Consensus)
So higher quality, superior yield, unimaginable value, and the potential for life-changing long-term returns.
But what evidence is there that these high-yield Super SWANs can deliver anything like these theoretical returns?
Historical Returns Since October 1999 (Equal Weight, Annual Rebalancing)
The future doesn’t repeat, but it often rhymes. – Mark Twain
Past performance is no guarantee of future results. Still, studies show that blue-chips with relatively stable fundamentals over time offer predictable returns based on yield, growth, and valuation mean reversion.
Bank of America
Since late 1999 we’ve had some of the worst market crashes in US history.
- the tech crash (worst bubble in US history)
- the Great Recession (2nd worst market crash in history)
- the Pandemic (fastest bear market in history)
We’ve also had two regular bear markets and dozens of corrections and pullbacks.
How have these high-yield Super SWANs performed compared to both the S&P 500 and US financials?
Portfolio Visualizer Premium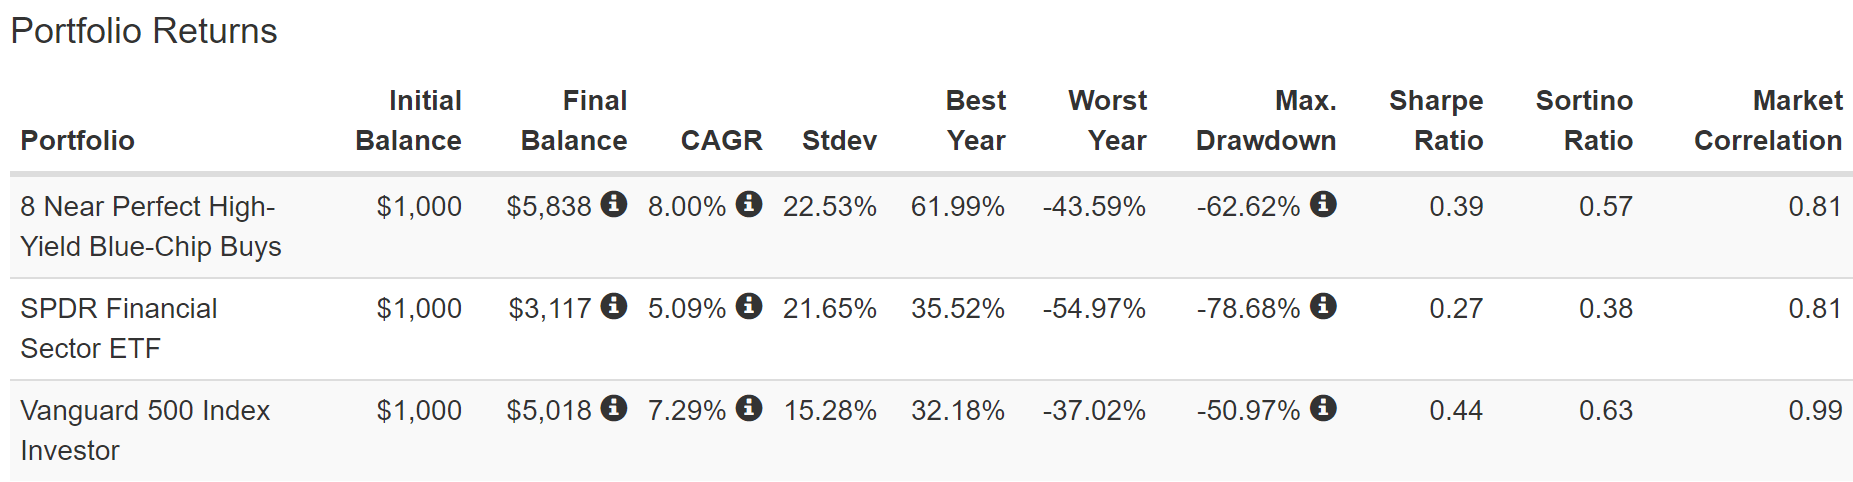
During the financial crisis, US financials fell almost 80%, while these mostly financials Super SWANs fell a far less terrifying 63%.
Despite that incredible decline, they’ve outperformed the S&P 500 for the last 22 years.
- a 92% statistical probability they are superior quality to the market
And compared to the financial sector in general, they delivered far better returns.
Portfolio Visualizer Premium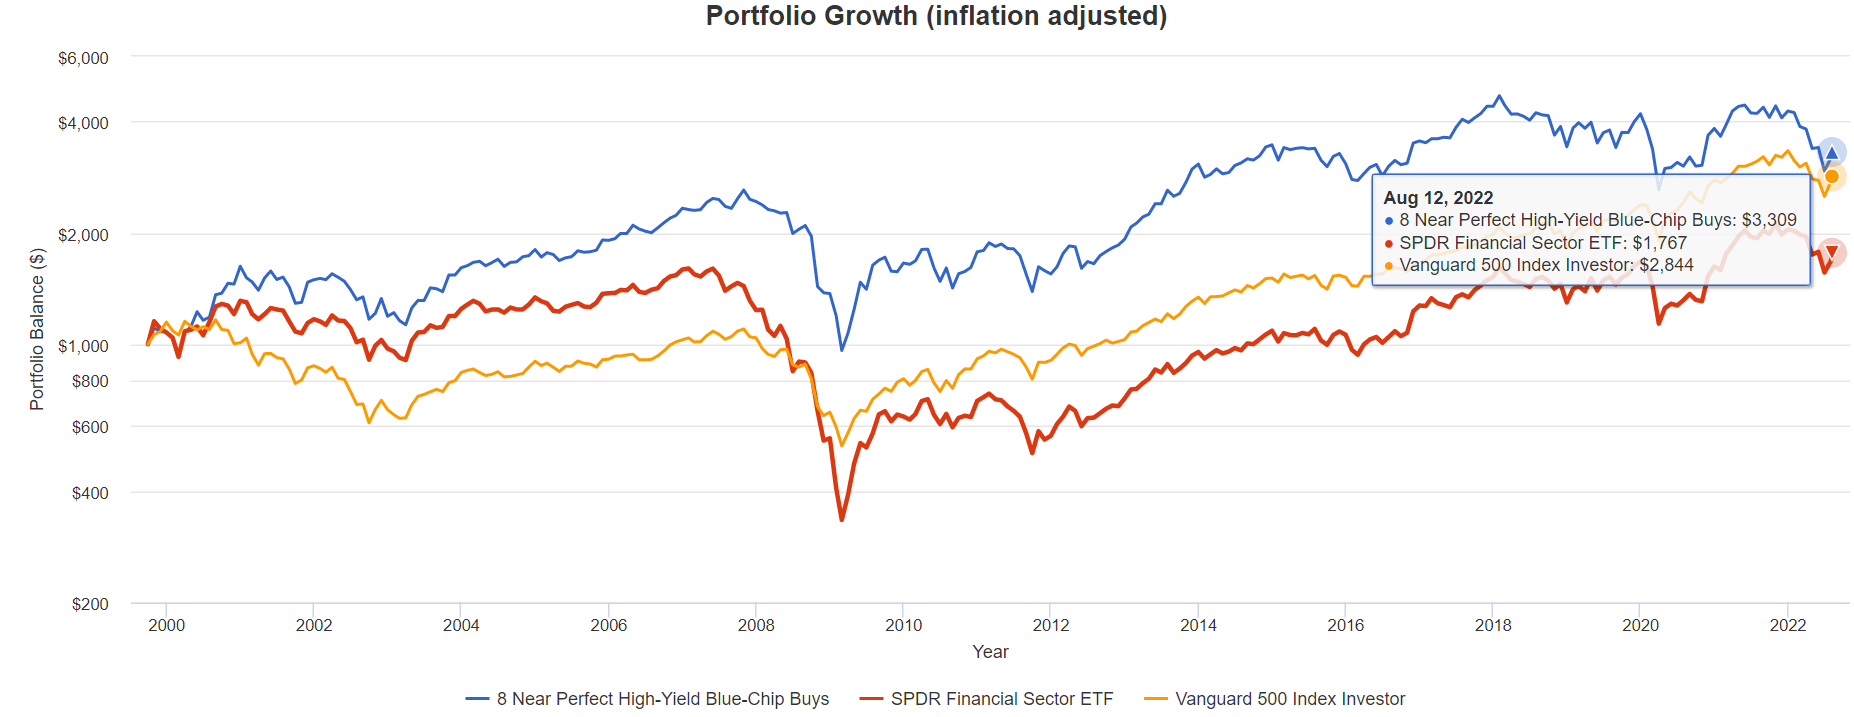
Adjusting for inflation:
- XLF: 2.6% CAGR real returns
- S&P 500: 4.9% CAGR (S&P 500’s risk and inflation-adjusted consensus future return potential)
- 8 Near-Perfect High-Yield Blue-Chip Buys 5.6% CAGR
When everything that can go wrong did, these high-yield blue-chips still managed to deliver decent returns that beat the market and ran circles around their peers.
The banks will not get this country in trouble, I guarantee it. – Warren Buffett
That quote is from 2013; US financial institutions have gotten even stronger, with higher capital buffers and more conservative portfolios and balance sheets.
I’m extremely confident their returns in the next 22 years will be far superior to the 8% they’ve delivered in the last 22 years.
Portfolio Visualizer Premium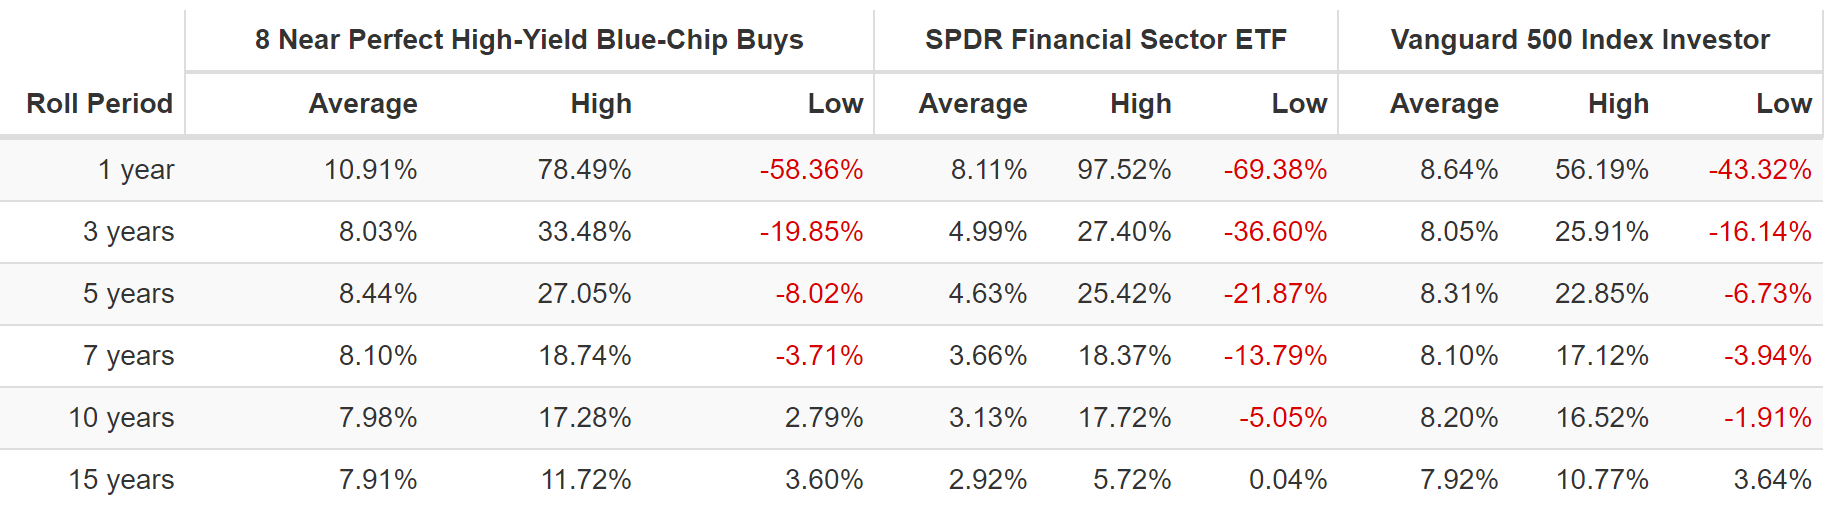
Their average 12-month rolling return since 1999 is almost 11% annually, far higher than the S&P 500’s or financials.
And what about income growth?
Far Superior Income Growth Over Time
(Source: Portfolio Visualizer Premium)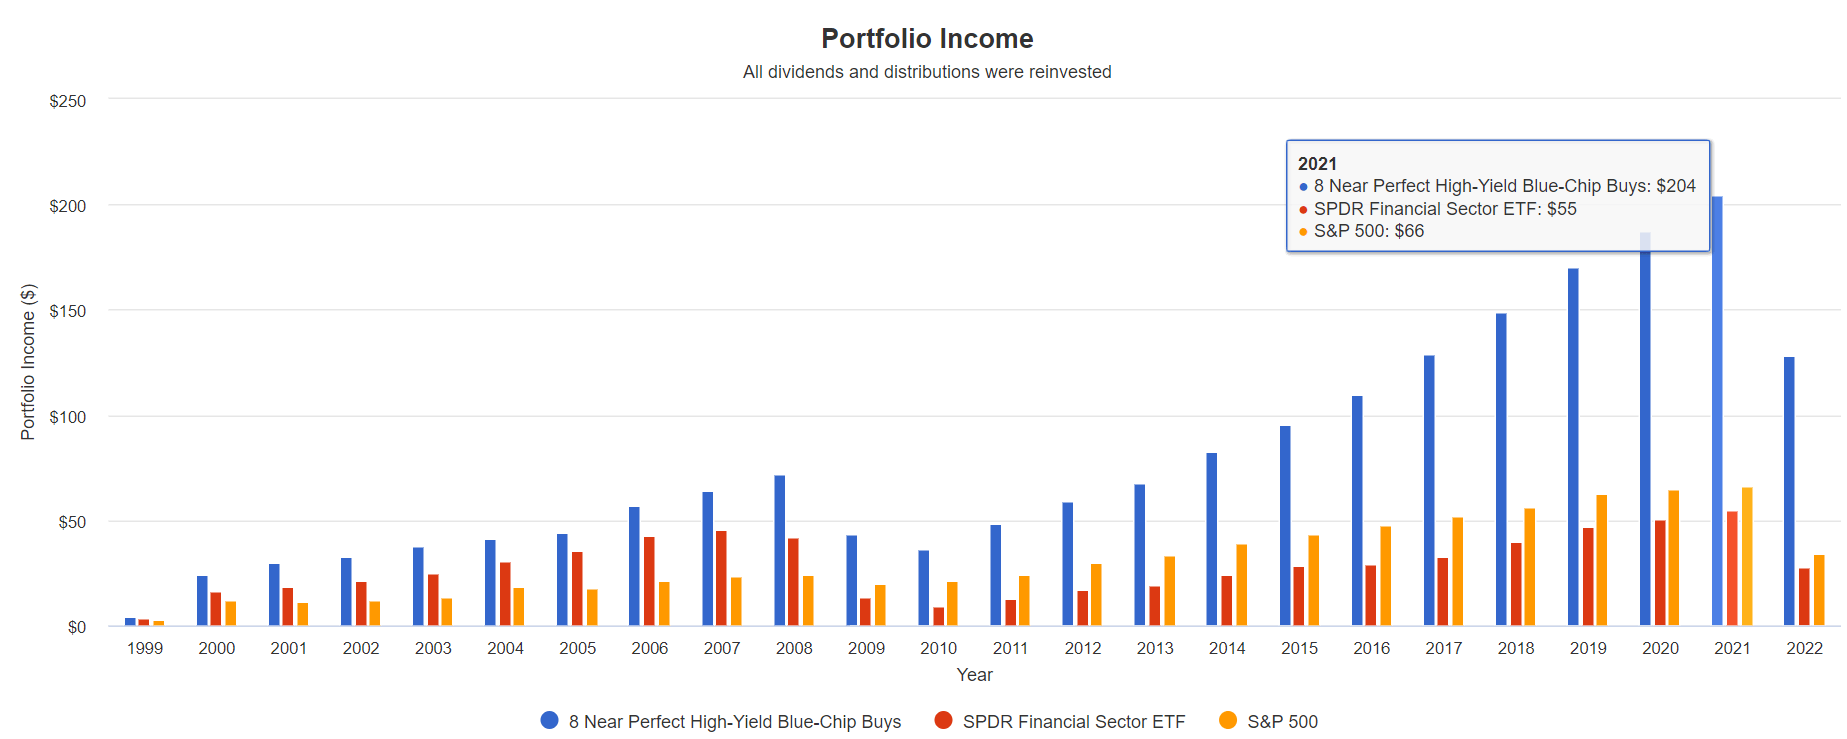
During the Financial Crisis, the Fed forced many big financials to cut their dividends as part of the bailout. That’s why XLF’s dividends fell 80% from 2007 to 2010.
- these high-yield blue-chips’ dividends fell 44% during this time
But new record dividends were achieved by 2014 compared to 2019 for XLF.
Cumulative Dividend Since 2000: $1,000 Initial Investment
| Metric | S&P 500 | SPDR Financial Sector ETF |
8 Near Perfect High-Yield Blue-Chip Buys |
| Total Dividends | $782 | $715 | $2,041 |
| Annualized Income Growth Rate | 8.63% | 5.04% | 10.24% |
| Total Income/Initial Investment | 0.78 | 0.72 | 2.04 |
| Inflation-Adjusted Income/Initial Investment | 0.44 | 0.41 | 1.16 |
| More Inflation-Adjusted Income Than The S&P 500/ETF | 2.61 | 2.85 |
(Source: Portfolio Visualizer Premium)
These high-yield blue-chips delivered 10% annual income growth, even with their GFC cuts, and delivered a total of 2X your initial investment in dividends.
- a 25.6% yield on cost means that number is rising very quickly now
Investors have recouped 1.16X their initial investment in inflation-adjusted dividends.
- 2.6X more inflation-adjusted income than the S&P 500
- 2.85X more than the financial sector
Consensus Future Income Growth Potential
| Analyst Consensus Income Growth Forecast | Risk-Adjusted Expected Income Growth | Risk And Tax-Adjusted Expected Income Growth |
Risk, Inflation, And Tax Adjusted Income Growth Consensus |
| 14.6% | 10.2% | 8.7% | 6.5% |
(Source: DK Research Terminal, FactSet)
Analysts think these high-yield blue-chips could deliver superior 14.6% annual income growth in the future, which, adjusted for the risk of the company not growing as expected, inflation, and taxes, is 6.5% real expected income growth.
Now compare that to what they expect from the S&P 500.
| Time Frame | S&P Inflation-Adjusted Dividend Growth | S&P Inflation-Adjusted Earnings Growth |
| 1871-2021 | 1.6% | 2.1% |
| 1945-2021 | 2.4% | 3.5% |
| 1981-2021 (Modern Falling Rate Era) | 2.8% | 3.8% |
| 2008-2021 (Modern Low Rate Era) | 3.5% | 6.2% |
| FactSet Future Consensus | 2.0% | 5.2% |
(Sources: S&P, FactSet, Multipl.com)
- 1.7% post-tax inflation-adjusted income growth from the S&P 500
- S&P 500’s historical post-tax inflation-adjusted income growth rate (current tax code) is 5.8% CAGR
S&P is now dominated by companies favoring buybacks over dividends, potentially explaining the slower income growth in the future.
What about a 60/40 retirement portfolio?
- 0.5% consensus inflation, risk, and tax-adjusted income growth.
In other words, they could generate about 4X faster real income growth than the S&P 500 and 13X faster income growth than a 60/40.
- And with a very safe 3X higher yield on day one
Bottom Line: These 8 High-Yield Blue-Chips Are As Close To Perfect Investment Opportunities As Exist On Wall Street
There are no actual perfect stocks, but some come close. When it comes to long-term investing success, risk-management, return of capital, return on capital, and margin of safety are four sound criteria for making smart investments that can help you retire in safety and splendor.
MMM, ALIZY, BK, LNC, MFC, MURGY, STT, and VFC are eight high-yield blue-chips that score a perfect 100% A+ exceptional on the Dividend Kings Automated Investment Decision tool and are as close to perfect high-yield investment opportunities as exist on Wall Street today.
- 4.5% very safe yield
- dividend aristocrat level quality
- A stable average credit rating
- 75th industry percentile risk management
- double-digit consensus long-term return potential (11% average annual returns for 20 years)
- 28% undervalued
- 9.5X earnings
If you’re worried about the market today, you’re not alone.
This is a market for bears, technical traders, and the nervous. – Bloomberg
But do you know how you can stop worrying about the market and start sleeping well at night? By buying the world’s best dividend blue-chips within a diversified and prudently risk-managed portfolio.
Want to know a secret to not losing your mind when most investors do? Get paid handsomely in safe and growing dividends while you wait for the storm to pass.
Are you tired of praying for luck on Wall Street? Then high-yield A+ rated blue-chips like these are a great way to make your own luck on Wall Street.
Am I saying you should only buy these eight blue-chips? No, I’m saying that they represent some of the most reasonable and prudent high-yield options you can safely buy today.
That doesn’t mean they can’t fall in a market downturn; few stocks avoid pain in a bear market. But if you have the correct time horizon of 5+ years, then buying these near-perfect high-yield blue-chip bargain opportunities today is how you can secure your financial future.
Or to put it another way, buy high-yield blue-chips like these at these kinds of valuations, and over time you can retire rich, and stay rich in retirement.
Be the first to comment