


hamzaturkkol/iStock via Getty Images
Get ready for charts, images, and tables because they’re better than words. The ratings and outlooks we highlight here come after Scott Kennedy’s weekly updates in the REIT Forum. Your continued feedback is greatly appreciated, so please leave a comment with suggestions.
Are you concerned about inflation? You might be concerned about the wrong thing. Inflation isn’t the big bad monster today. The Federal Reserve has taken over that role.
Inflation is being driven by massive deficits and weak supply chains. The deficits are a result of government policies outside the Federal Reserve’s control. The Federal Reserve had relatively minimal impact on inflation. Their balance sheet was expanding since the GFC (Great Financial Crisis). For over a decade, growth in the balance sheet had minimal impact on inflation. It’s insanity to believe that something which did not create inflation for over a decade is driving massive inflation.
What’s new? The magnitude of deficit spending over the last three years. Likewise, disruptions in global supply chains are much worse than before. Those two factors combined are driving inflation.
Did lower mortgage rates increase home prices? Sure. However, “shelter” inflation is tracked using rent levels. It does not use home prices. Since lower mortgage rates encouraged construction and made buying more affordable, lower rates made rent growth more difficult. Higher rates have the opposite impact. They should push home prices down, but they drive rents higher.
Do Deficits Matter?
Obviously. Who wants to step forward and say that deficit spending of $6 trillion had no impact? Is anyone really going to make that argument? It’s cool. The deficit should be under $1 trillion now. Right, that’s still big. It’s still increasing the debt. This is hardly a political statement. I haven’t advocated specifically for cutting spending or raising taxes. I haven’t said anything about how to get there. Only that the deficit should be much lower.
Are Supply Side Issues Real?
Absolutely. Look at the plunge in domestic auto production:
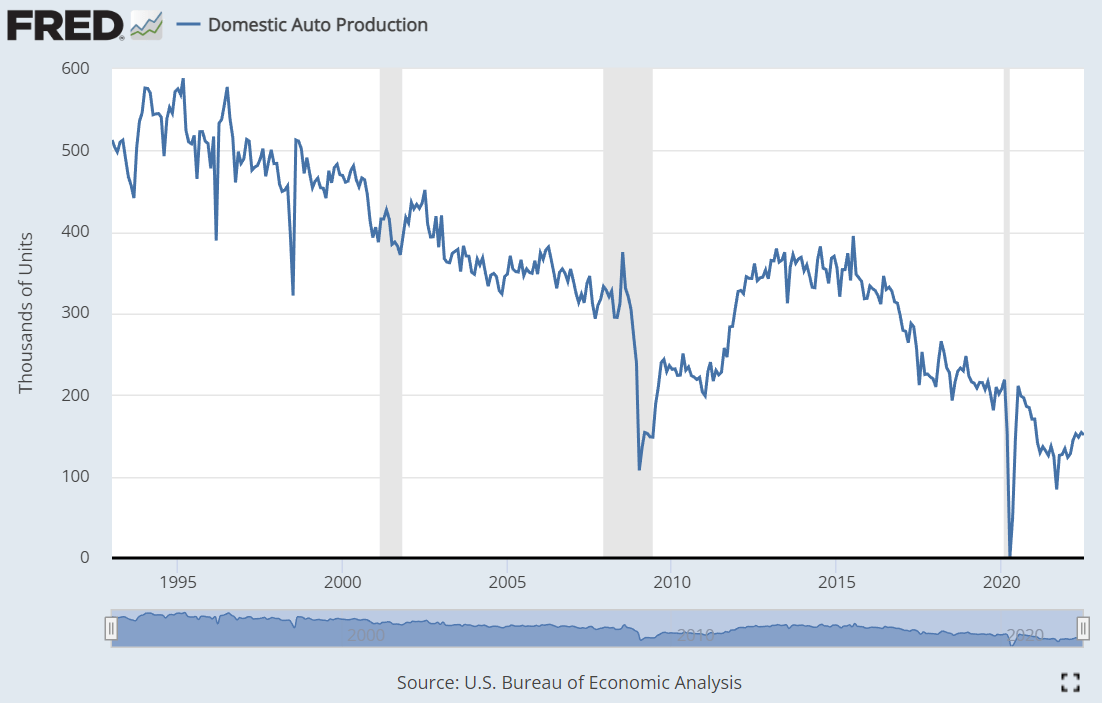
Federal Reserve
That’s a clear example. Cars have a very complex supply chain and disruptions in the supply chain limited production. It already was trending lower, but in percentage terms car production is still only at 75% of the pre-pandemic level.
Neither of these factors are solely responsible for inflation. Both factors were important.
Swinging Rates
The bond market was swinging quickly as it attempted to track developments:
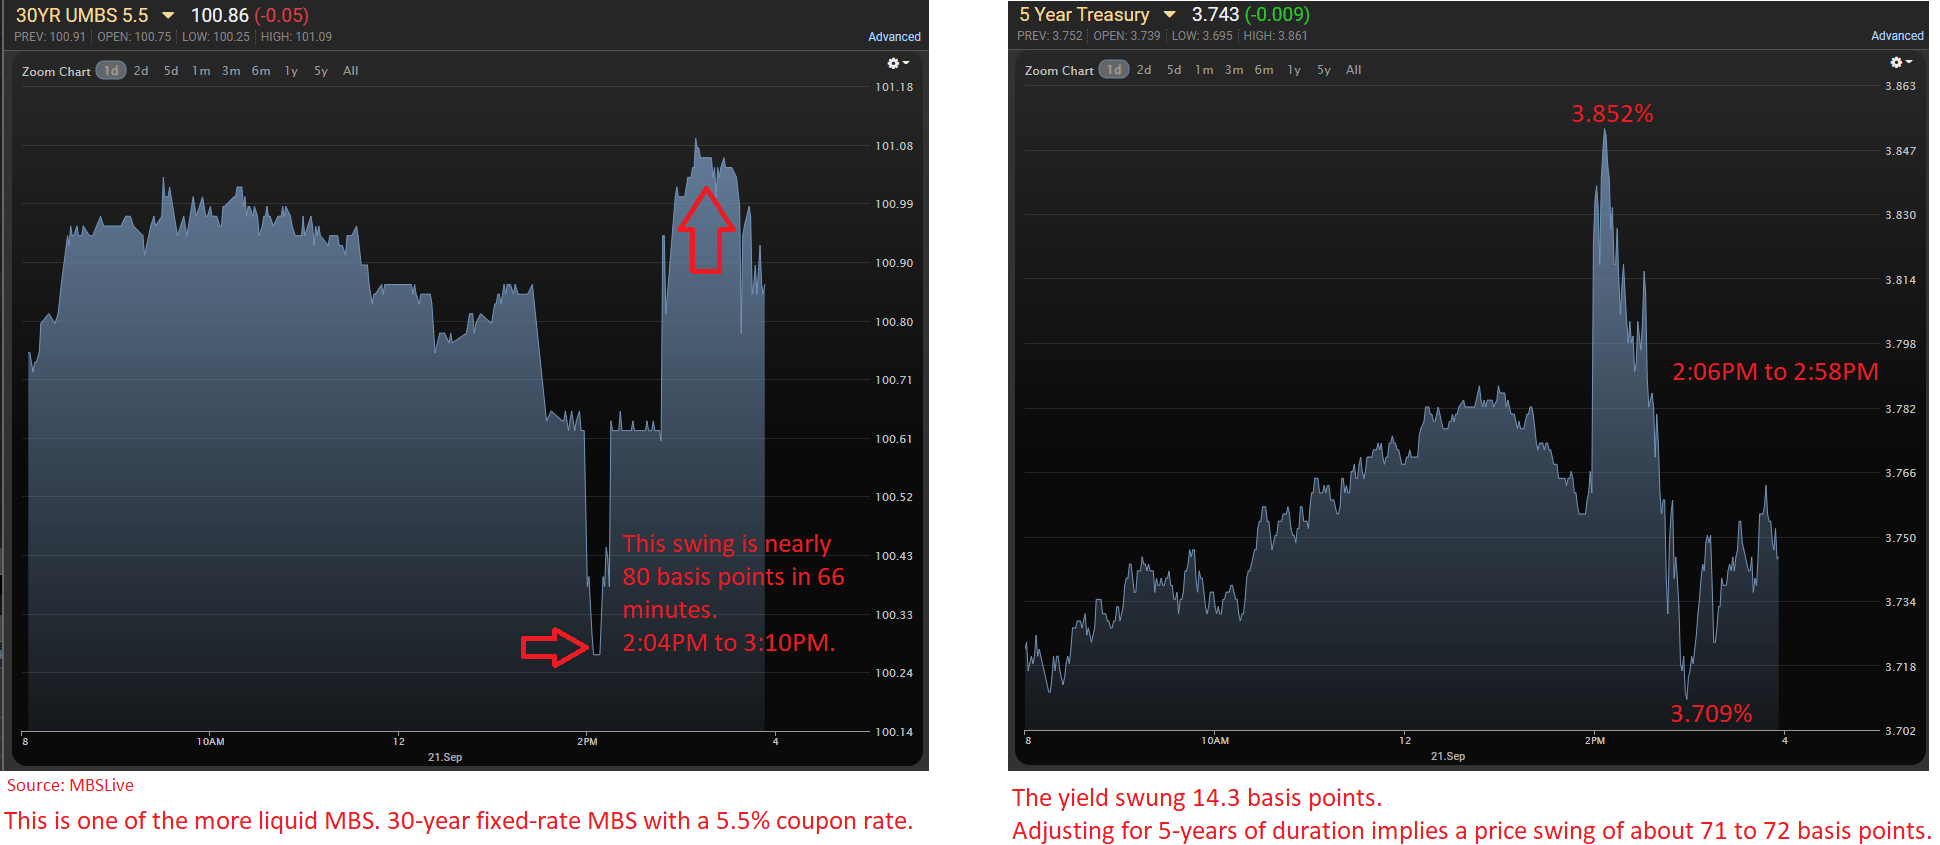
MBSLive
While the chairman’s remarks moved markets, they had a very different impact across the yield curve:

MBSLive
This brings the spread between 2-year and 10-year Treasury rates to negative 52 basis points:
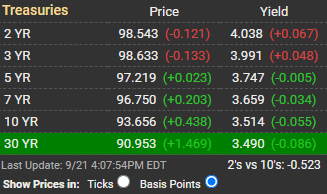
MBSLive
That puts us below any of the prior end-of-month values since the early 1980s:
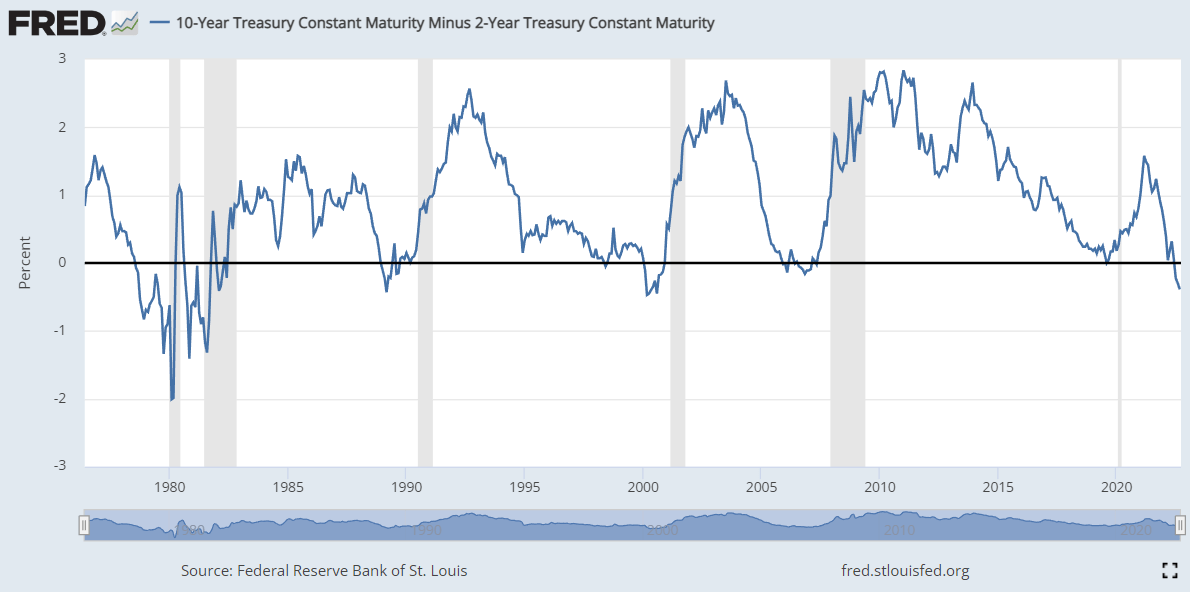
Federal Reserve
Put simply, this is the bond market screaming that the Federal Reserve is severely mismanaging monetary policy. I agree entirely and I’ll go into more depth in another article. I was going to do it here, but it’s really time to get to the picks.
Shares That Can Thrive on High Rates
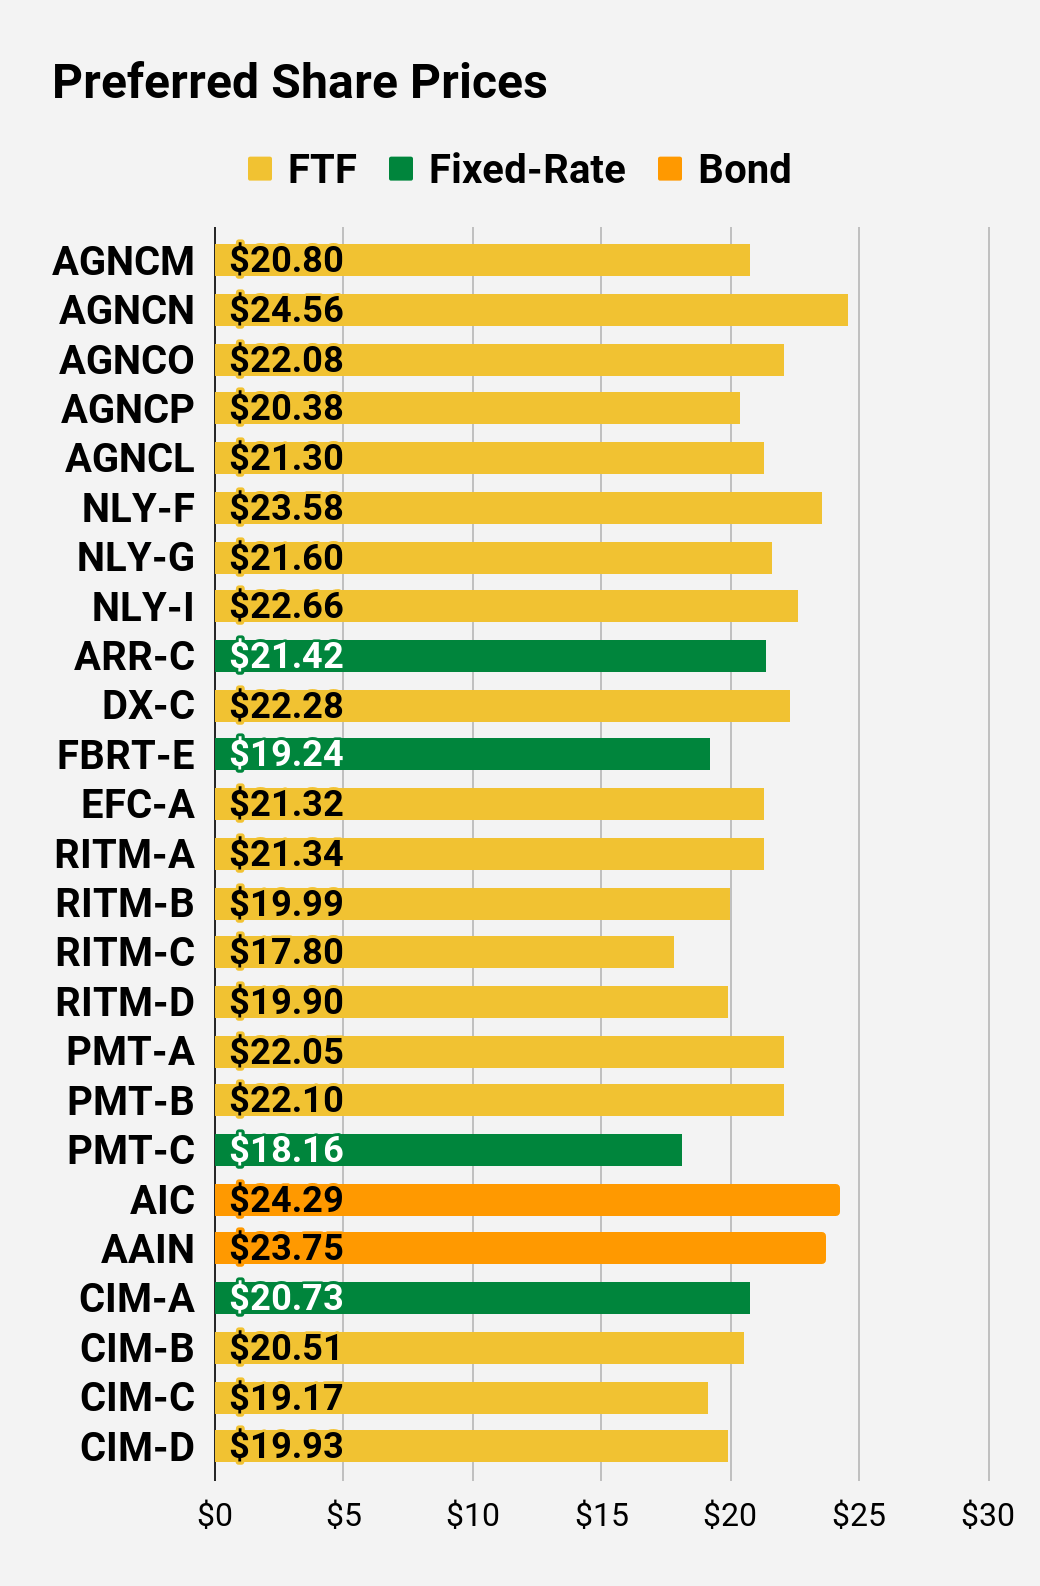
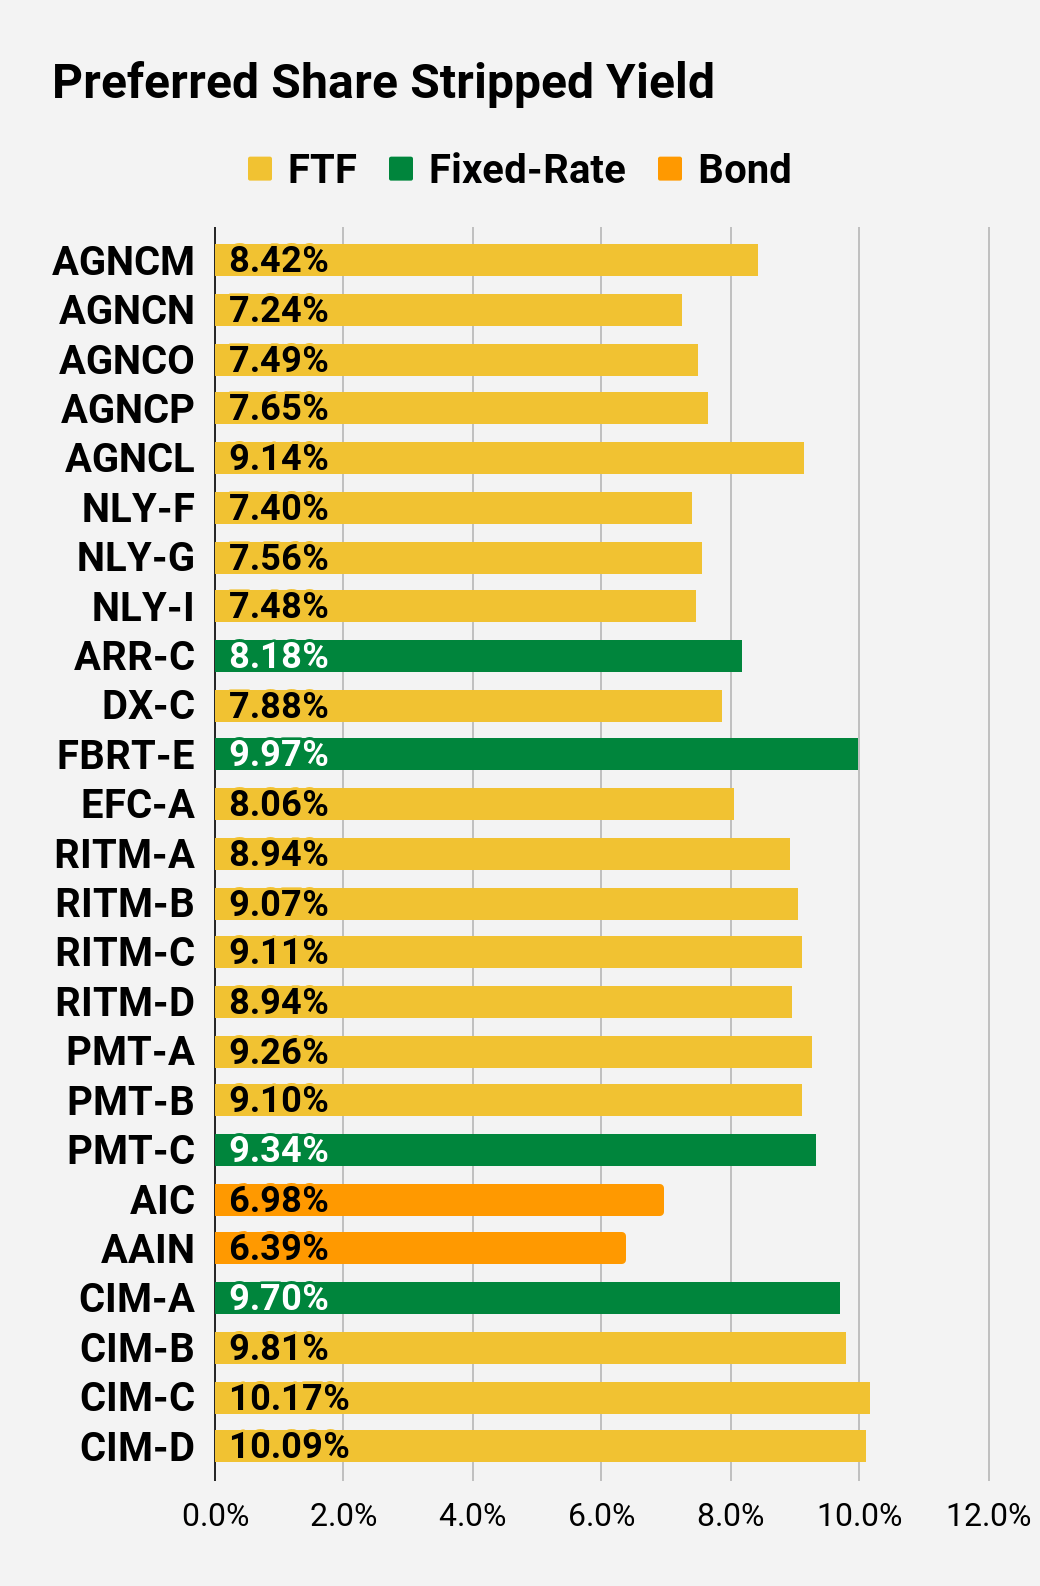
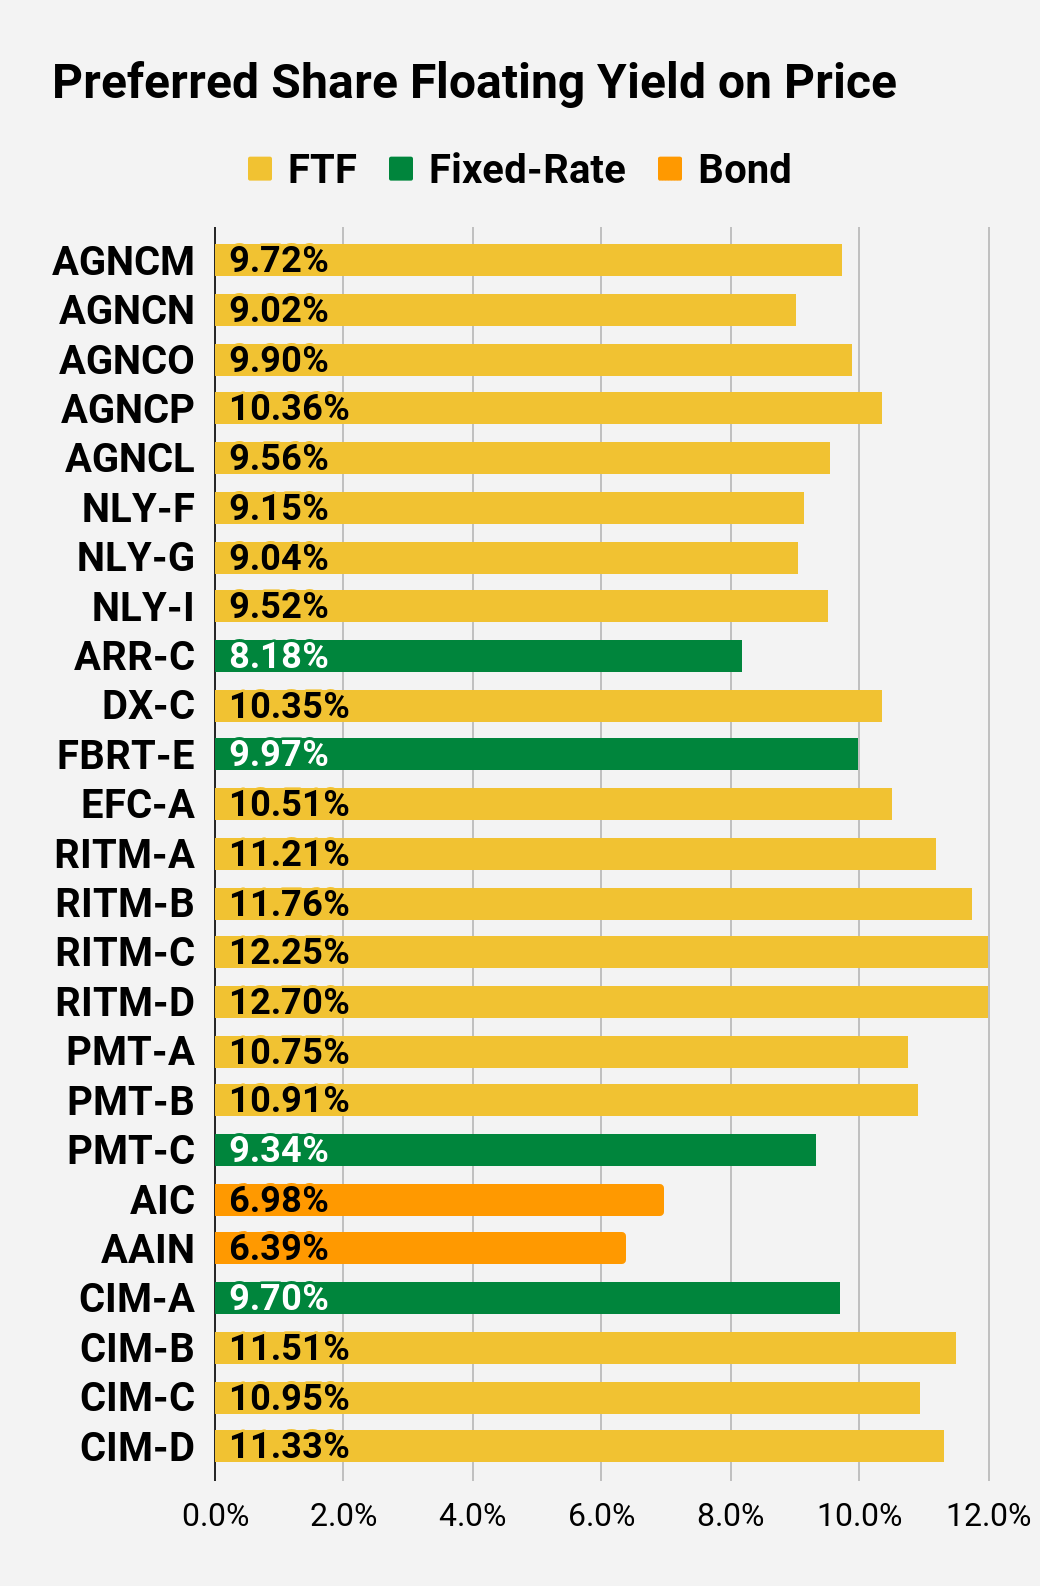
Many of the mortgage REIT preferred shares switch over to a floating rate within a few years. The process starts soon as NLY-F (NLY.PF) switches to a floating rate on 9/30/2022. Using the current 3-month LIBOR rates, the stripped yield would jump from 7.4% to 9.16%. That’s a good deal. It’s not the best deal among the mortgage REIT preferred shares, but it’s a good ideal. With shares at $23.57, investors would get a nice capital gain if called. If they are not called, the 9.16% yield will be great.
For AGNCN, the stripped floating yield based on today’s three-month rates would hit 9.00%. That’s an attractive rate of return and it’s the factor that carried share prices up to $24.60. The floating rate starts on 10/15/2022. The other AGNC preferred shares are even more attractive. Investors have to wait longer for the floating yield, but the shares are discounted so severely that buyers could pocket the difference in share prices, and it would more than cover the future difference in dividends for a very long time to come.
Waiting for a higher yield may sound awful, but investors are getting the extra cash flows today in the form of a lower price. Cash today is better than cash over the next two years.
Sound obvious to some of you? I assure that many people often argue in the comments. They would rather pay an extra $2.00 to get an extra $1.50 in dividends. Math is hard, right?
I’m a big fan of AGNCM, AGNCO, AGNCP, and AGNCL at these prices.
Yes, AGNCL. I know, I ripped AGNCL apart less than two weeks ago: Yield Chasers Wrecked.
I argued that before AGNCM goes ex-dividend (expected 9/29/2022), AGNCL should trade at about $.54 cents above AGNCM.
Today, AGNCL is about $.43 above AGNCM. Well, that’s pretty close to my estimate. When we first warned investors about buying AGNCL too early, shares were $24.50. They dropped 13%. Hope you appreciated the warning.
Will Rates Ever Decline?
The 10-year Treasury rate suggests rates will decline. The Federal Reserve thinks they won’t need to reduce rates for quite a while. That makes sense. Few people stand before a crowd and say:
“We’re making a bad choice and will need to reverse our course within the next few years because this decision is unsustainable.”
What can you do to have shares that would succeed in that environment?
Shares That Thrive If Rates Fall
Allow me to introduce you to RC-E (RC.PE), ARR-C (ARR.PC), PMT-C (PMT.PC), and CIM-A (CIM.PA). These are four choices investors can use to lock in a big yield. Yields on this batch range between 8.22% and 9.73%. Upside to call value is dramatic. For PMT-C, at $18.16 the upside to call value is over 37%. Why would we consider the upside to call value when shares are extremely unlikely to be called in the near future? Because it gives us a feeling for the soft cap on share prices. It’s much harder for share prices to rise materially above $25.00 after they are callable, because that would be stupid.
Anyone who pays $26.50 for a share that can be called the next month for $25.00 is choosing to gamble their money.
Since shares are so far below call value (at $18.16), it means shares have the potential to rally substantially if we see rates and/or credit spreads shrink.
The rest of the charts in this article may be self explanatory to some investors. However, if you’d like to know more about them, you’re encouraged to see our notes for the series. The part below is reproduced in each article to provide investors with easy access to the updated charts. It is my gift to readers.
Stock Table
We will close out the rest of the article with the tables and charts we provide for readers to help them track the sector for both common shares and preferred shares.
We’re including a quick table for the common shares that will be shown in our tables:
Let the images begin!
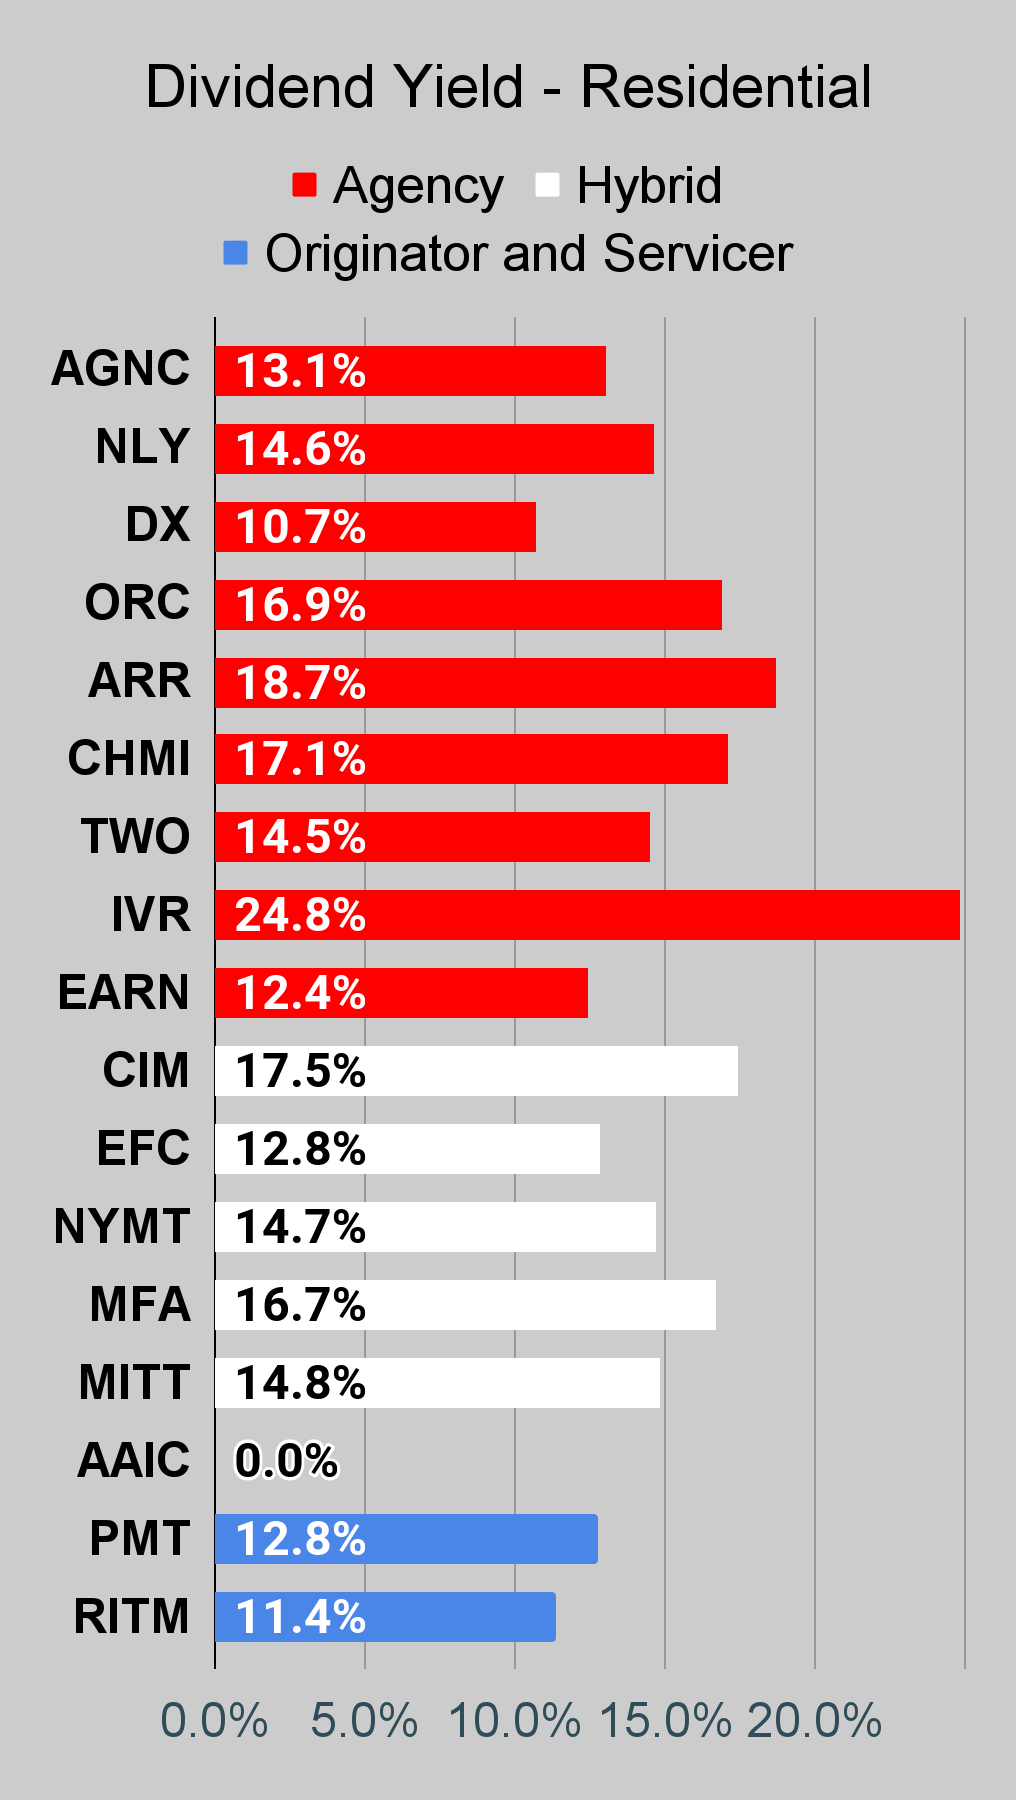
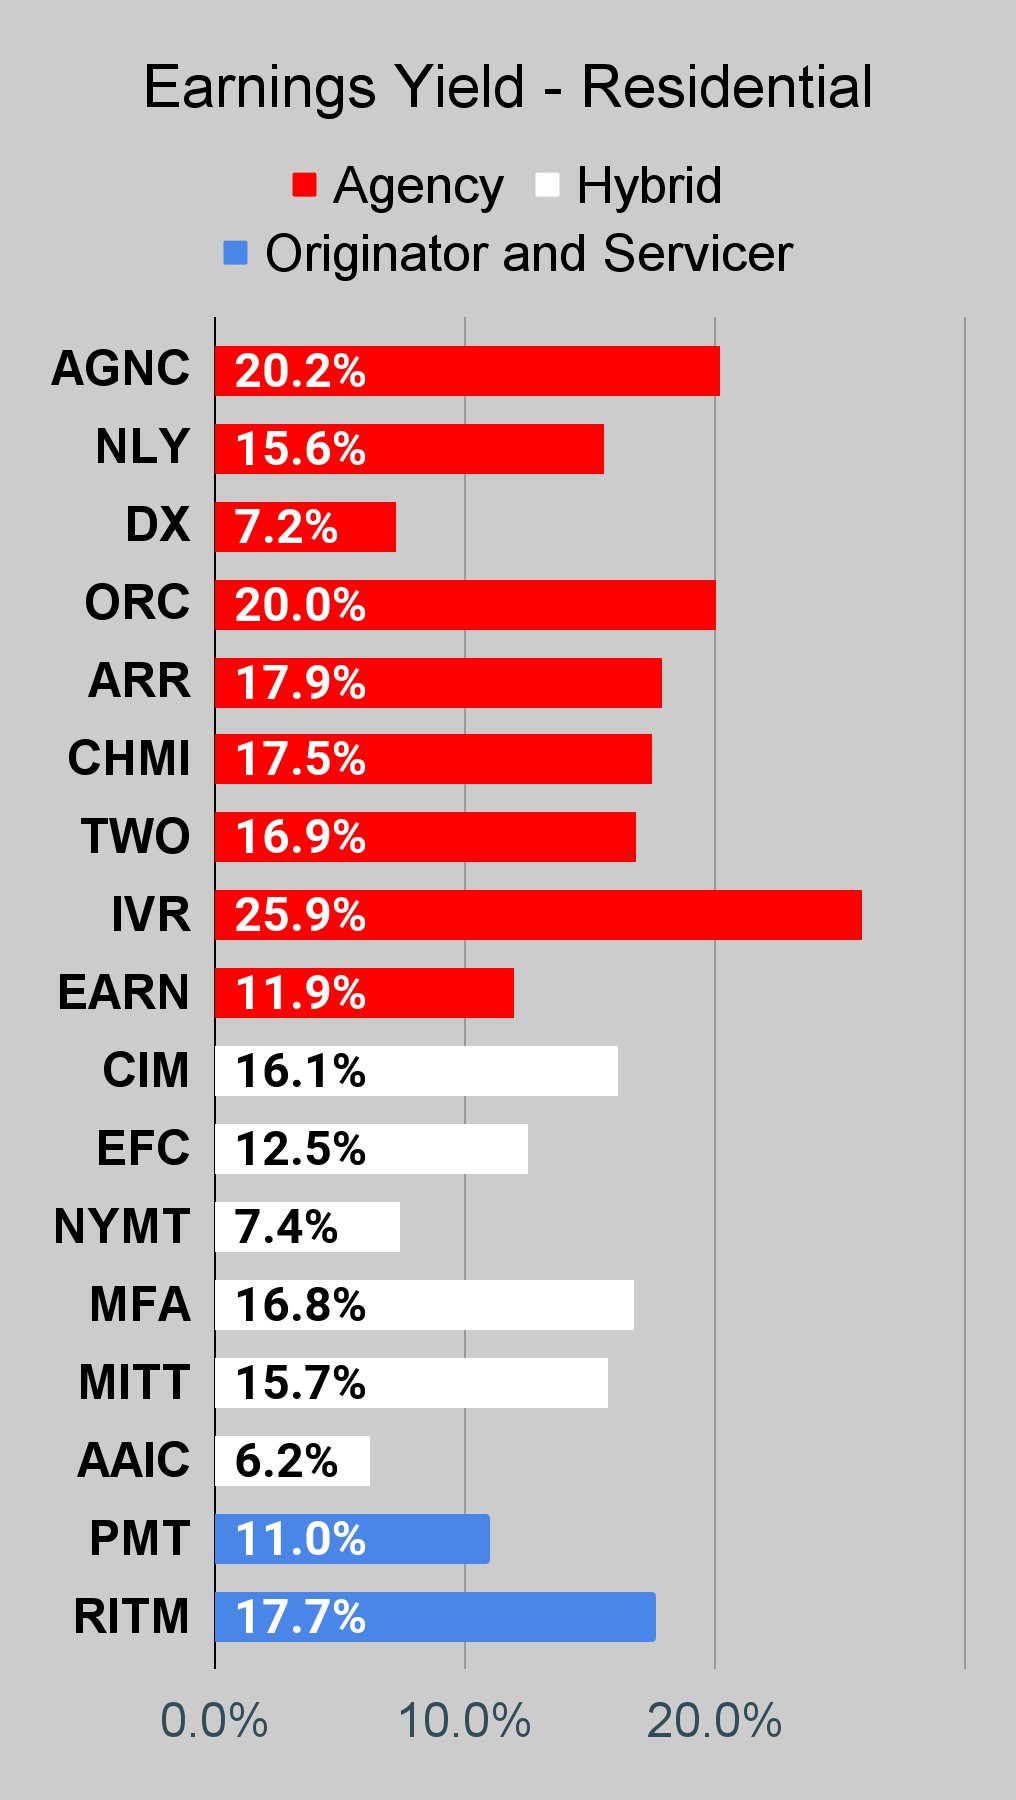
Residential Mortgage REIT Charts
Note: The chart for our public articles uses the book value per share from the latest earnings release. Current estimated book value per share is used in reaching our targets and trading decisions. It is available in our service, but those estimates are not included in the charts below.
 The REIT Forum |
 The REIT Forum |
 The REIT Forum |
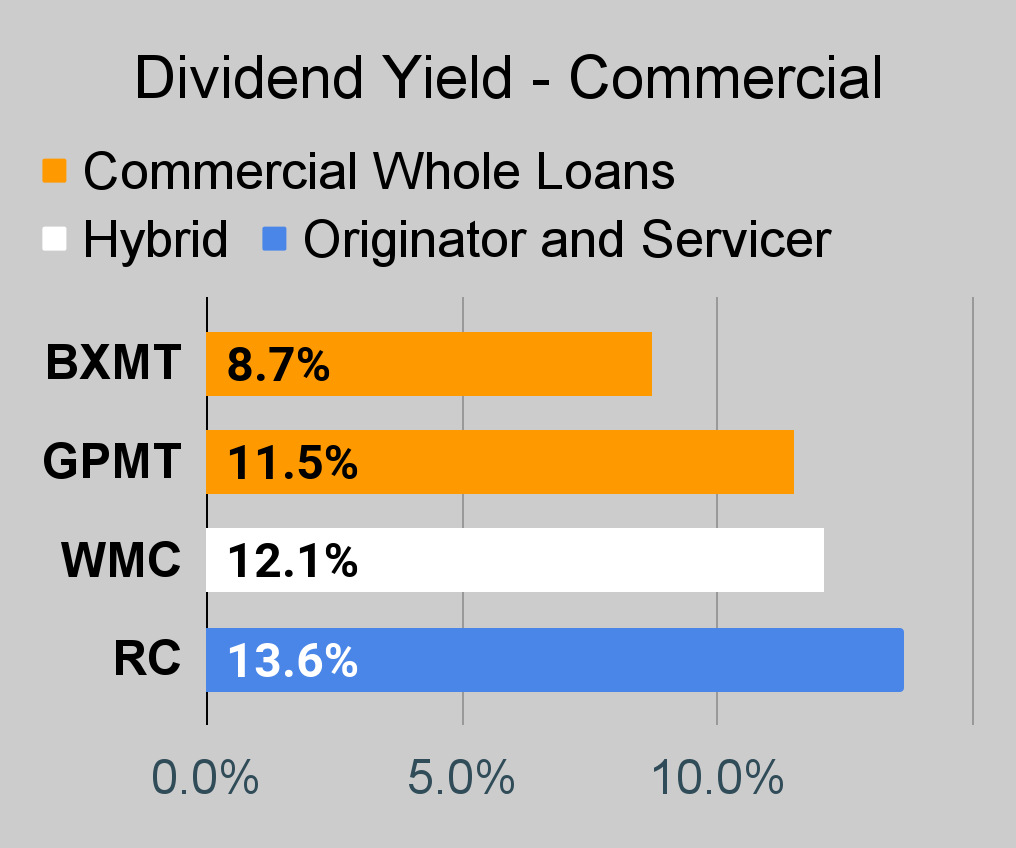
Commercial Mortgage REIT Charts
 The REIT Forum |
 The REIT Forum |
 The REIT Forum |
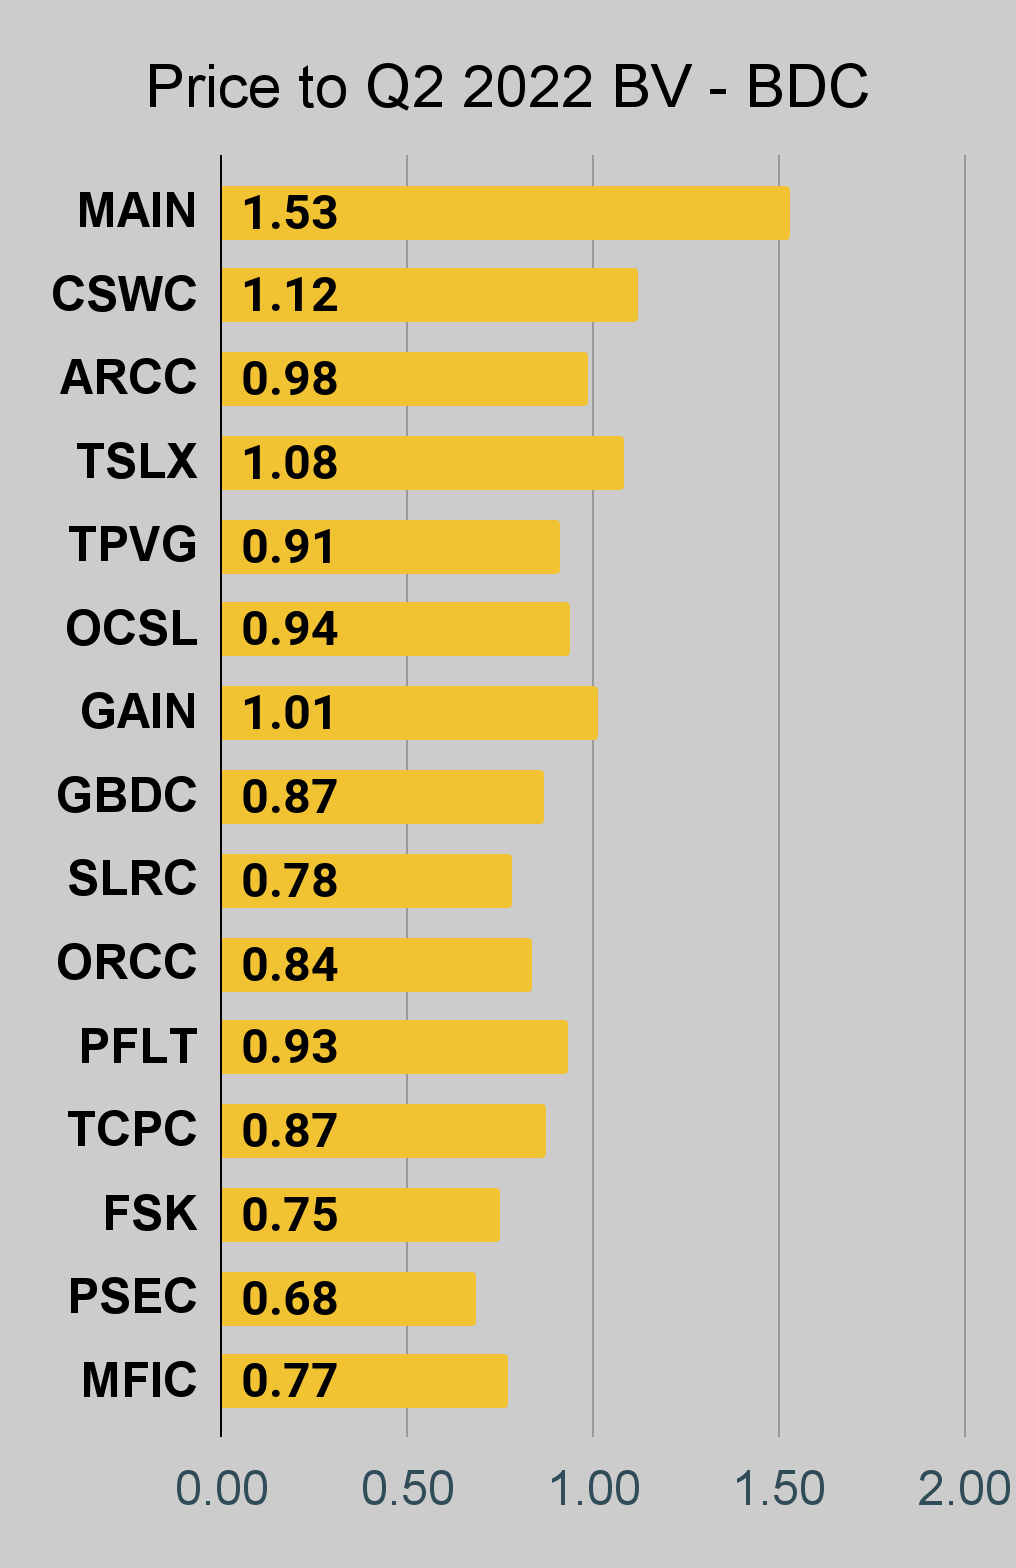
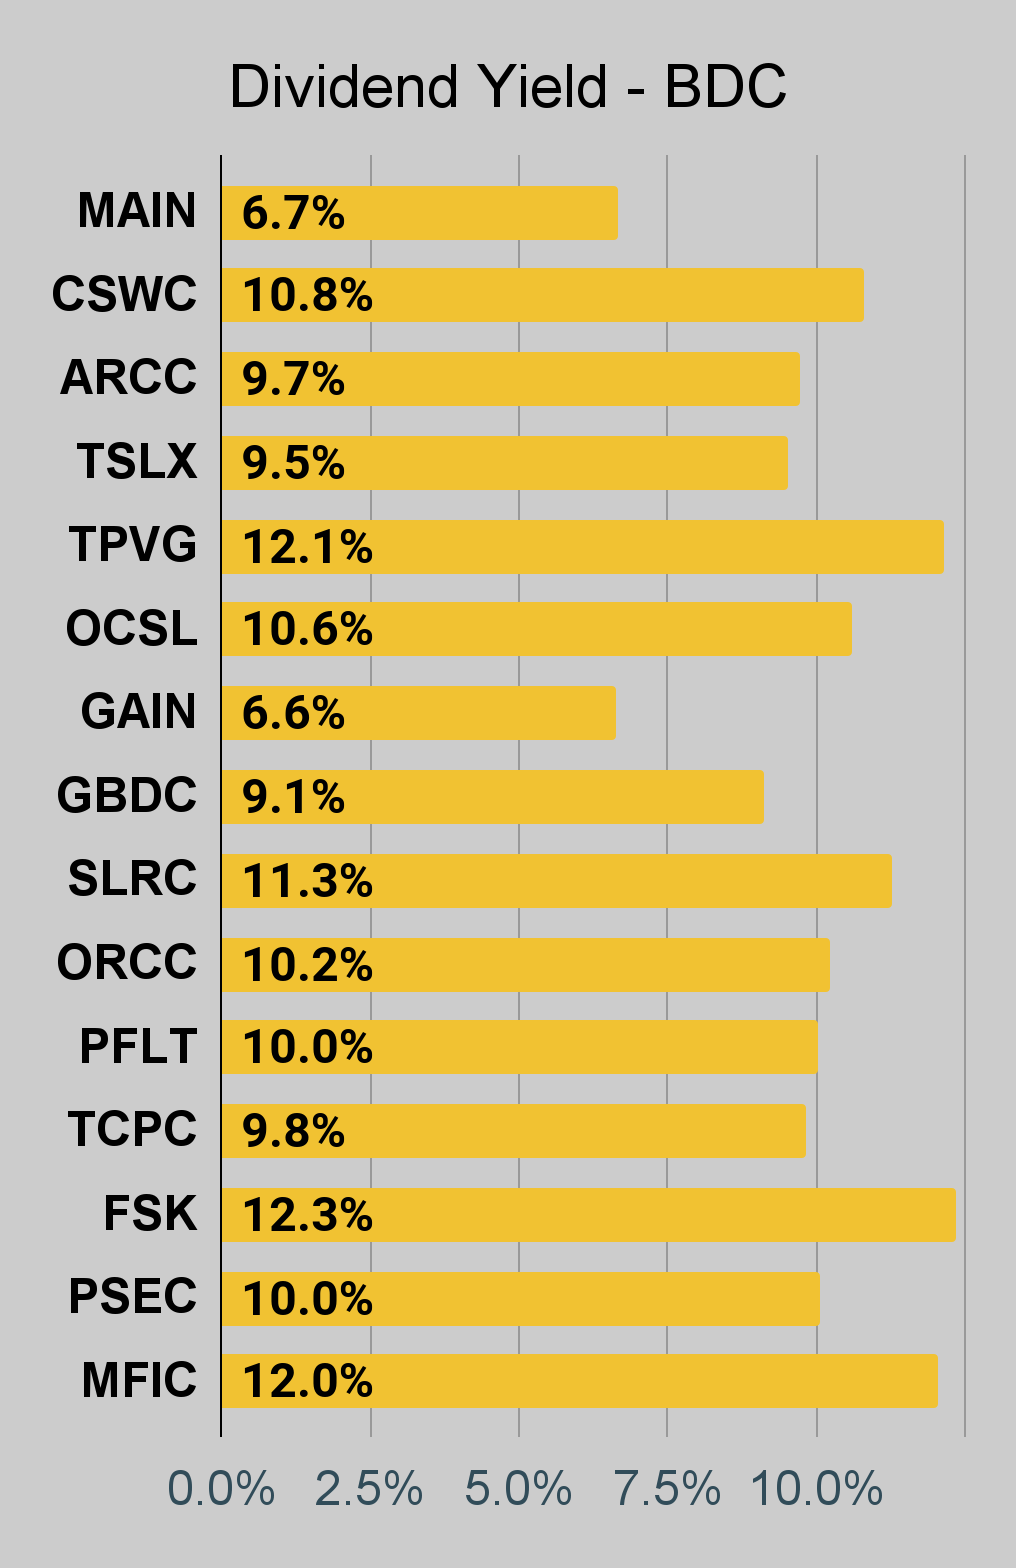
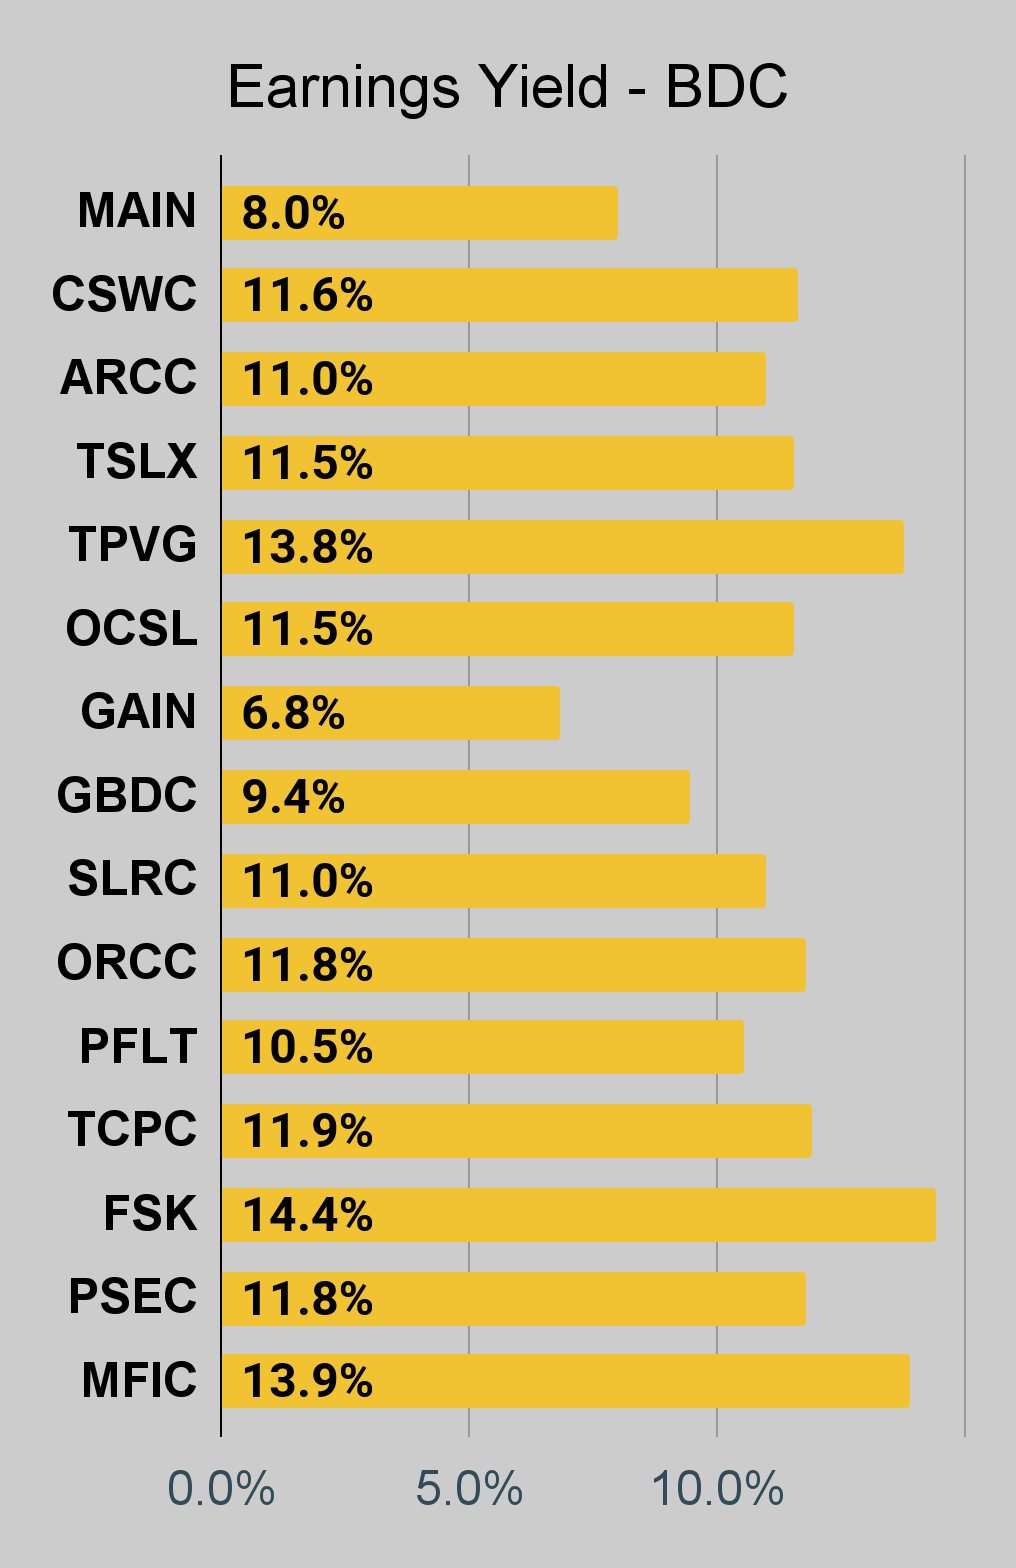
BDC Charts
 The REIT Forum |
 The REIT Forum |
 The REIT Forum |
Preferred Share Charts
 The REIT Forum |
 The REIT Forum |
 The REIT Forum |
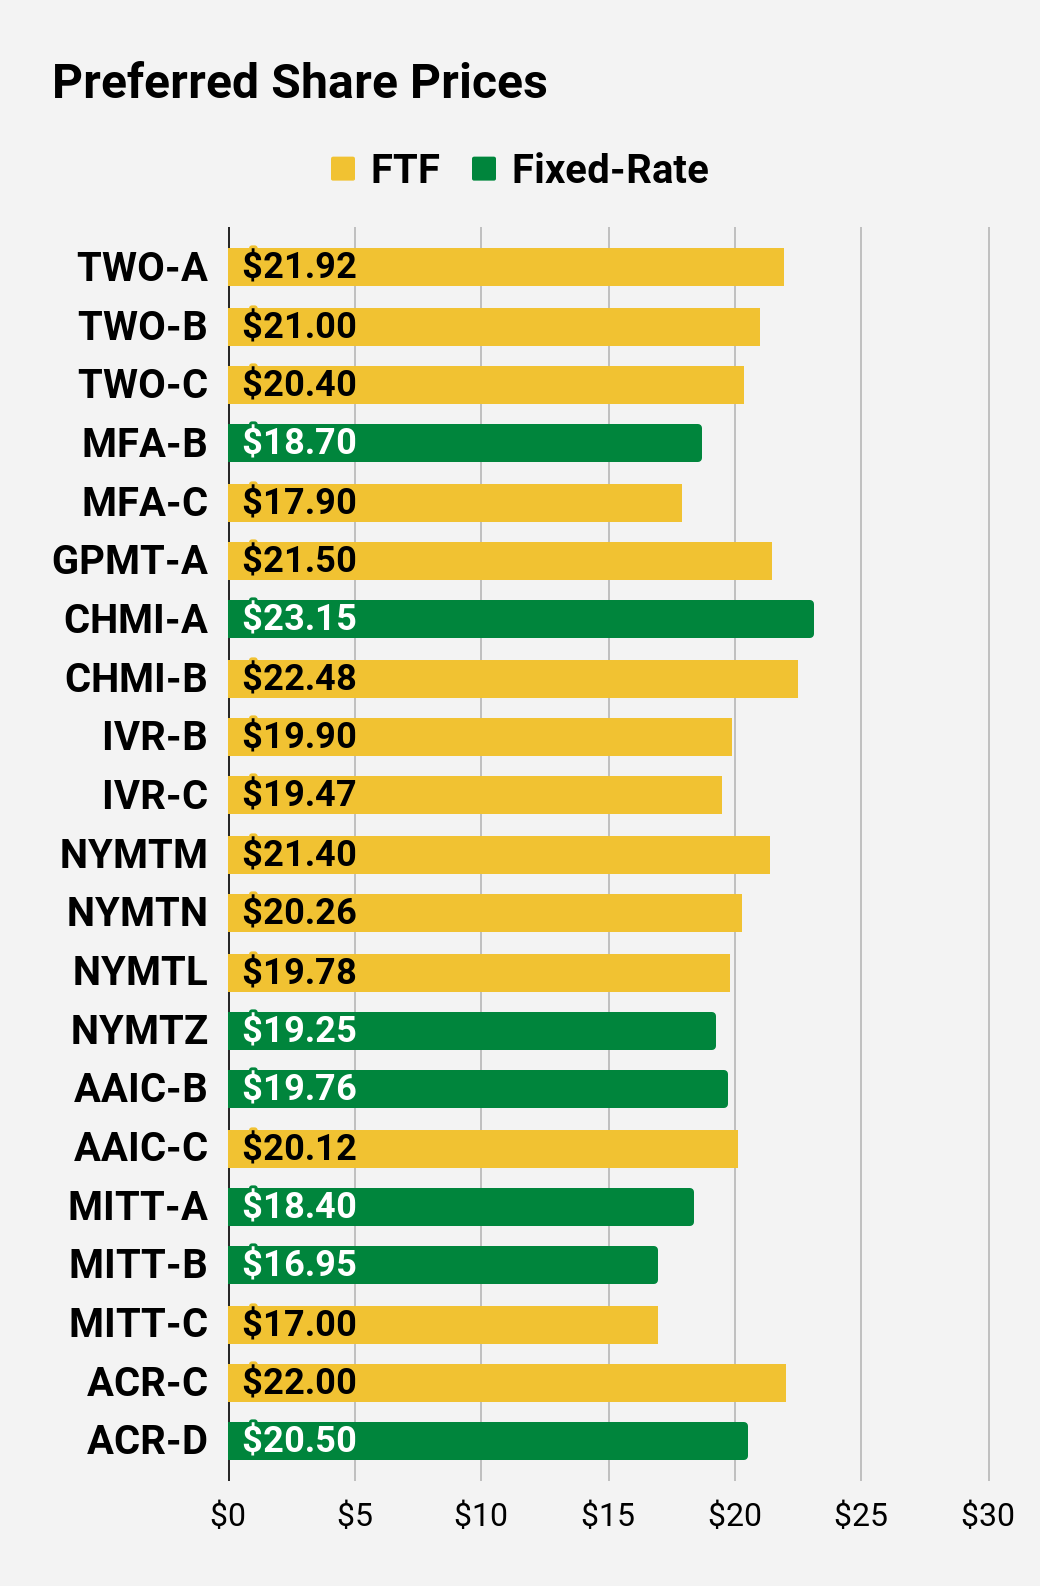 The REIT Forum |
 The REIT Forum |
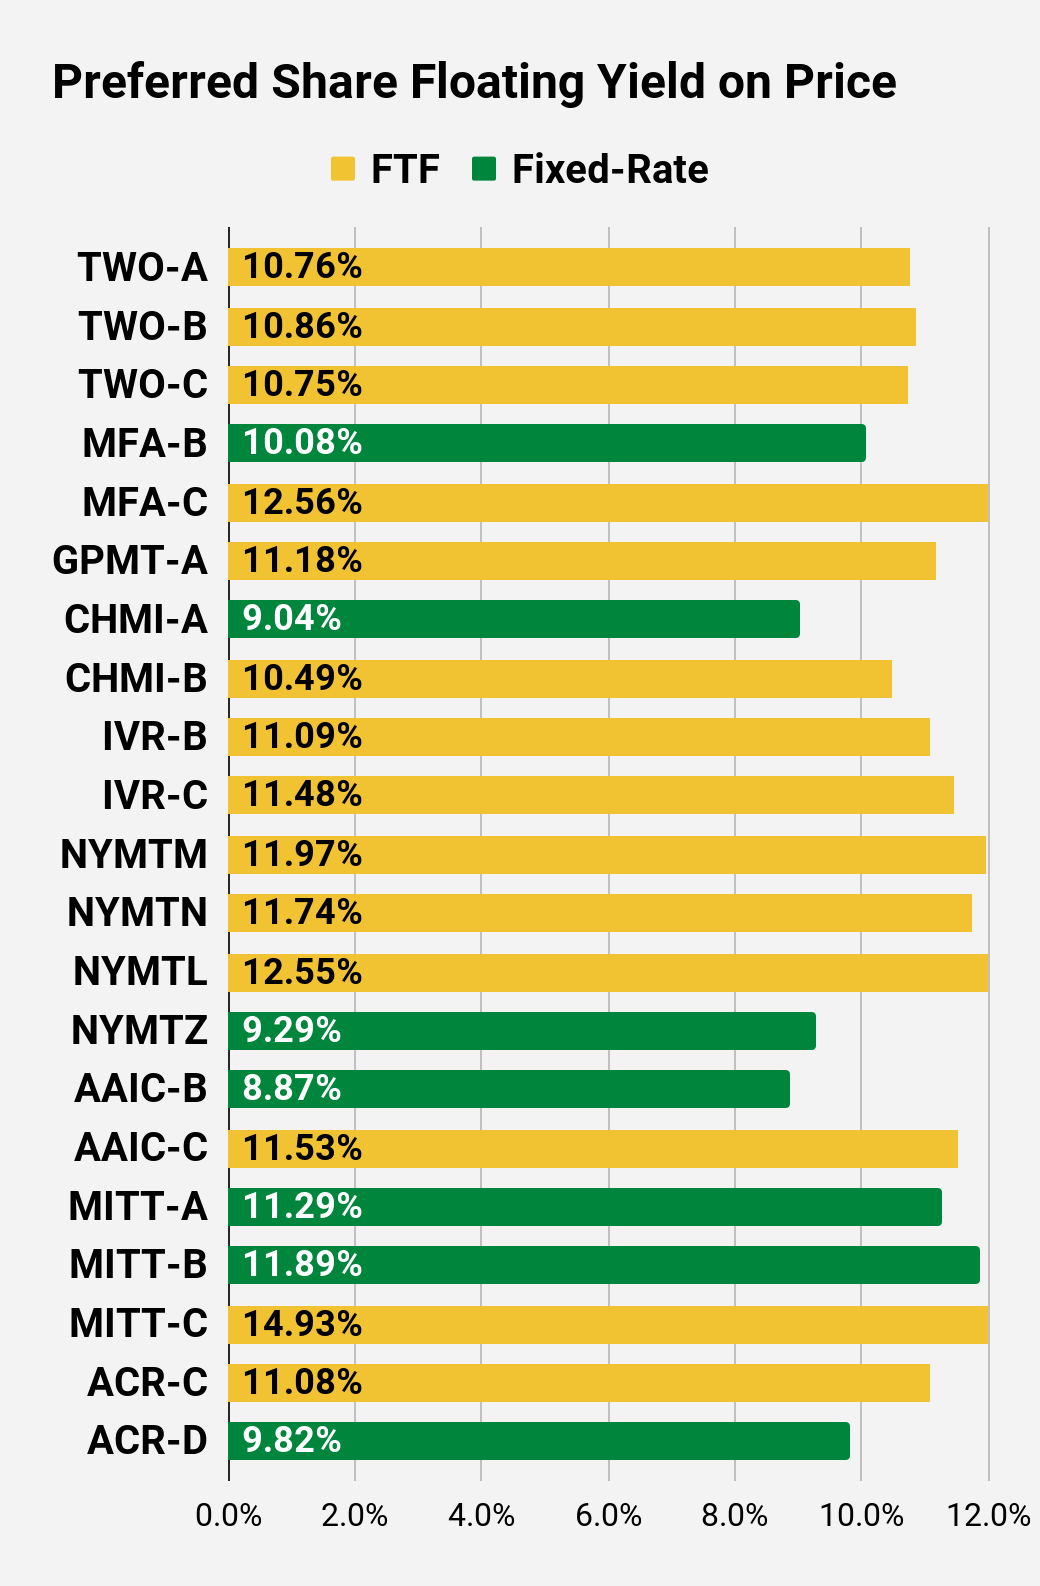 The REIT Forum |
Preferred Share Data
Beyond the charts, we’re also providing our readers with access to several other metrics for the preferred shares.
After testing out a series on preferred shares, we decided to try merging it into the series on common shares. After all, we’re still talking about positions in mortgage REITs. We don’t have any desire to cover preferred shares without cumulative dividends, so any preferred shares you see in our column will have cumulative dividends. You can verify that by using Quantum Online. We’ve included the links in the table below.
To better organize the table, we needed to abbreviate column names as follows:
- Price = Recent Share Price – Shown in Charts
- BoF = Bond or FTF (Fixed-to-Floating)
- S-Yield = Stripped Yield – Shown in Charts
- Coupon = Initial Fixed-Rate Coupon
- FYoP = Floating Yield on Price – Shown in Charts
- NCD = Next Call Date (the soonest shares could be called)
- Note: For all FTF issues, the floating rate would start on NCD.
- WCC = Worst Cash to Call (lowest net cash return possible from a call)
- QO Link = Link to Quantum Online Page
Second Batch:
Strategy
Our goal is to maximize total returns. We achieve those most effectively by including “trading” strategies. We regularly trade positions in the mortgage REIT common shares and BDCs because:
- Prices are inefficient.
- Long term, share prices generally revolve around book value.
- Short term, price-to-book ratios can deviate materially.
- Book value isn’t the only step in analysis, but it’s the cornerstone.
We also allocate to preferred shares and equity REITs. We encourage buy-and-hold investors to consider using more preferred shares and equity REITs.
Performance
We compare our performance against 4 ETFs that investors might use for exposure to our sectors:
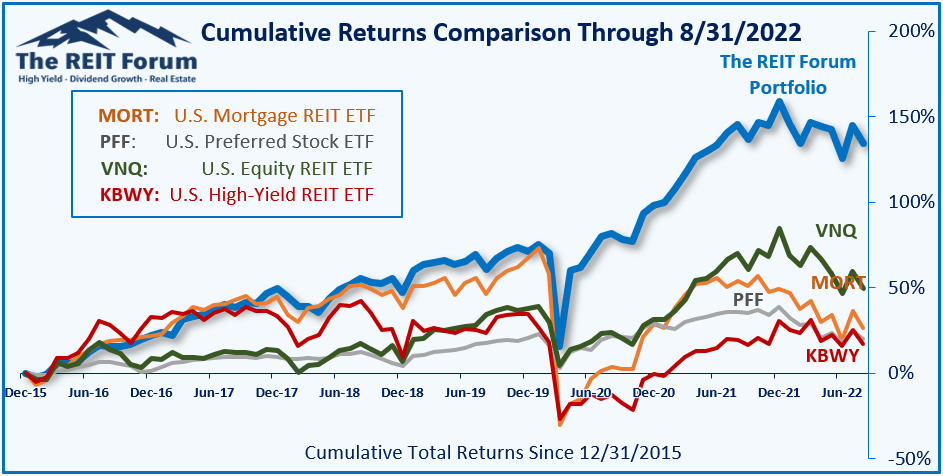
The REIT Forum
The 4 ETFs we use for comparison are:
|
Ticker |
Exposure |
|
One of the largest mortgage REIT ETFs |
|
|
One of the largest preferred share ETFs |
|
|
Largest equity REIT ETF |
|
|
The high-yield equity REIT ETF. Yes, it has been dreadful. |
When investors think it isn’t possible to earn solid returns in preferred shares or mortgage REITs, we politely disagree. The sector has plenty of opportunities, but investors still need to be wary of the risks. We can’t simply reach for yield and hope for the best. When it comes to common shares, we need to be even more vigilant to protect our principal by regularly watching prices and updating estimates for book value and price targets.
Ratings:
- Bullish on AGNCM, AGNCO, AGNCP, AGNCL, ARR-C, DX-C, PMT-C, CIM-A
Editor’s Note: This article covers one or more microcap stocks. Please be aware of the risks associated with these stocks.
Be the first to comment