

MR1805/iStock via Getty Images
The overdue fierce rebound has now arrived, and everyone is trying to figure out if there is further to go.
Yes, it can go further, but for that we need some type of cooperation on the geopolitical front and some more benign headlines when it comes to inflation and the Fed. While I used the higher-beta Nasdaq 100 Index for my “Scylla and Charybdis” comparison three weeks ago, it works just as well with the S&P 500 (for more, see “Marketmail 5-17-22: Stock Market Headed Between Scylla and Charybdis”).
In Homer’s Odyssey, Odysseus’ ship must navigate a narrow passage in the Straits of Messina (between Italy and Sicily), evading Scylla on the rocky shoals and Charybdis, a deadly whirlpool.
In this analogy from Greek mythology, Scylla is the “lesser evil” (the rocky shoal). In market terms, it’s the easier-to-attain 50-day moving average we may encounter this week. It is now declining and stands in the area of 4,249 (vs. last Friday’s close of 4,108). The harder-to-get-to Charybdis (the whirlpool at sea) is the 200-day moving average. It is also declining but stands higher, now near 4,450 (see chart, below).
StockCharts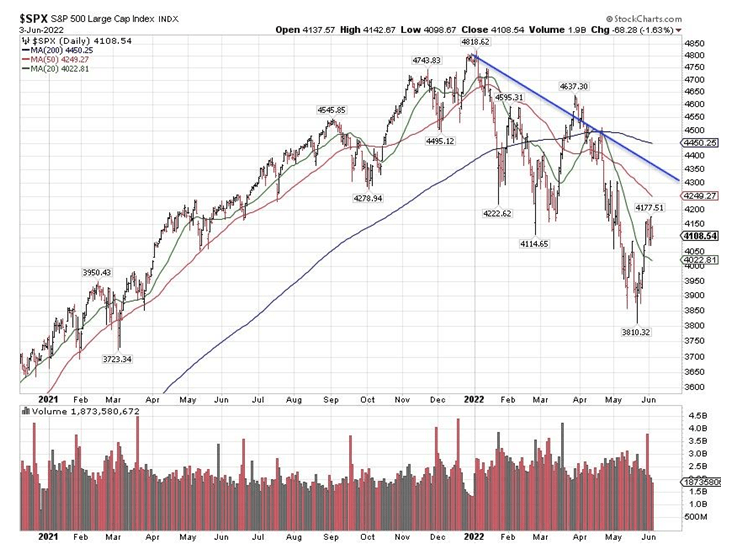
Graphs are for illustrative and discussion purposes only. Please read important disclosures at the end of this commentary.
It is not uncommon in any decline for this major index to tag both its 50- and 200-day moving averages multiple times. (The declining blue trend line is the midpoint between those two moving averages).
I think we have a better than even chance of making it to 4,250 and an about even chance to get to 4,350 (the midpoint). To get to the 4,400s we need some sort of catalyst, like the war in Ukraine winding down. The Russian military is regrettably executing on its scaled-down invasion, as it appears hell bent on taking over all of the Donetsk and Luhansk regions of Ukraine, dubbed Donbass, which according to the Ukrainian government is now 20% of the country. The way things are developing, it doesn’t look like this war will be over soon, at least not before all of Donbass is in Russian control, which is a goal they have stated openly.
(Disclaimer: Any geopolitical commentary included here is not meant to take sides but because it is moving the prices of many commodities, stocks, and bonds, and will be a major driver in the financial markets for as long as the war is ongoing. As long as there is no truce, or some way out of the fighting like a political solution, there will always be the possibility of escalation, which will remain a stock market negative).
Institute for the Study of War via BBC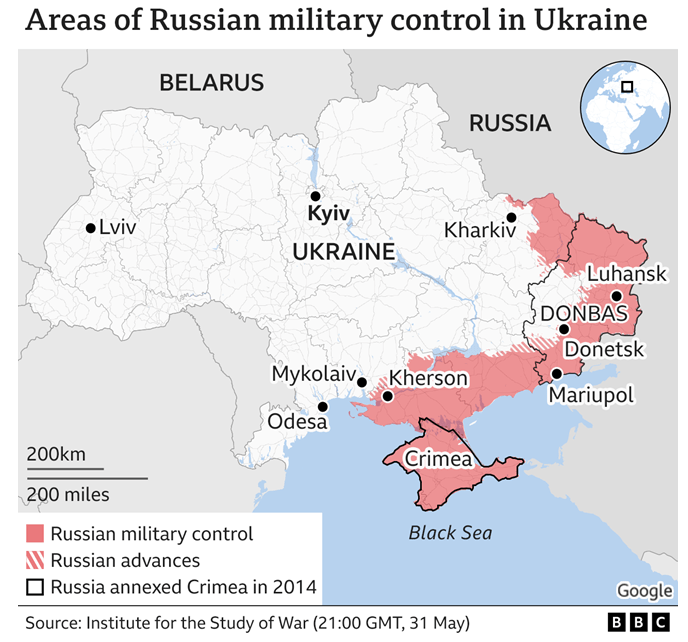
Crude oil, which was consolidating sideways, has now broken out of that sideways consolidation and is approaching $120 per barrel. High energy prices will be a major political problem in both the European Union and the United States, especially if we get to $150 this summer. The Europeans slapped new sanctions on Russian oil in tankers (but not in pipelines), and that is already being reflected in the price.
Crude at $150 introduces a huge hurdle for the S&P 500 and European and American consumers.
StockCharts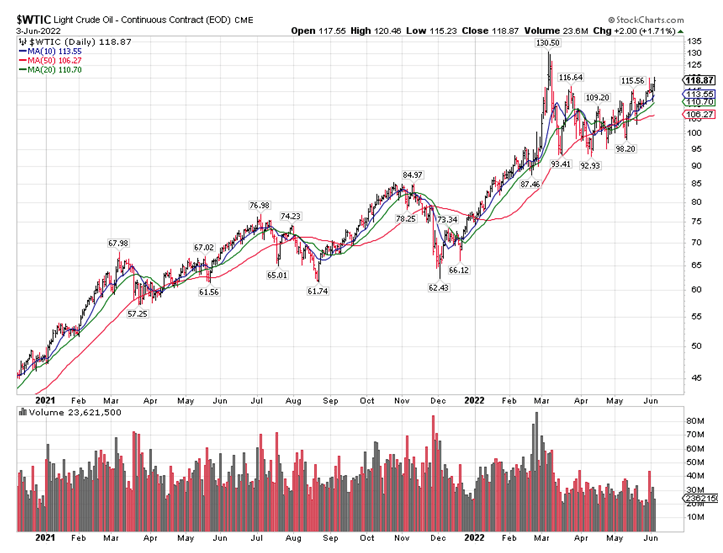
Graphs are for illustrative and discussion purposes only. Please read important disclosures at the end of this commentary.
The other issue is the bond market, which was well-behaved in May. We have gotten as high as 3.20% on the 10-year Treasury yield, then we pulled back, and rose rather dramatically last week to close at 2.95%. Any move in bond yields above 3.20% will be a major problem for the stock market.
TradingEconomics.com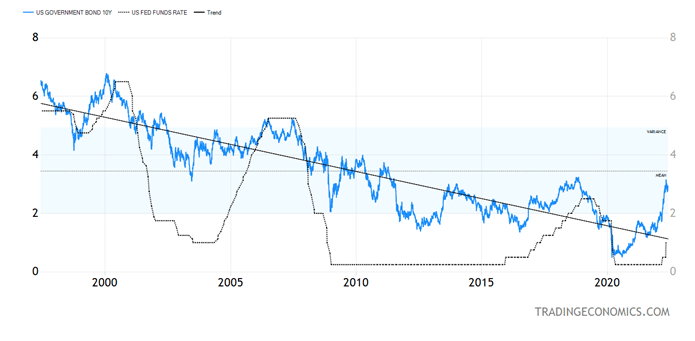
Graphs are for illustrative and discussion purposes only. Please read important disclosures at the end of this commentary.
In the past 40 years, Treasury yields have never exceeded the high from a prior Fed tightening cycle, which in the latest cycle is 3.25% from 2018. Any move above 3.20 to 3.25% is unlikely to be greeted with enthusiasm by the stock market.
Not All Commodities are Created Equal
While the CRB commodity price index is marching ahead, possibly headed to a fresh all-time high, particularly given the fact that China is reopening after their recent COVID lockdowns, lumber is down 60% since March and likely headed lower. Rising interest rates and inflation have dampened demand for lumber, despite the upcoming summer construction season. Also, output volumes at sawmills have recovered, easing supply concerns after months of tight inventories.
TradingEconomics.com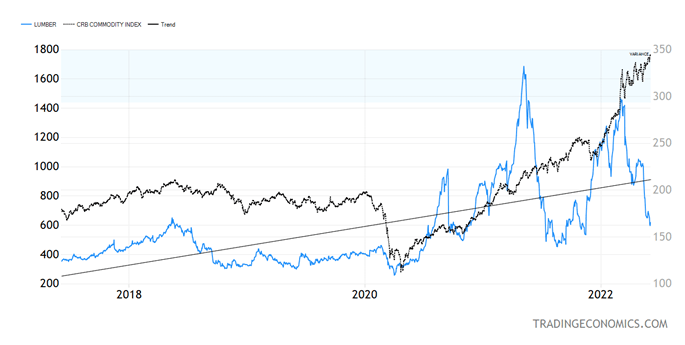
Graphs are for illustrative and discussion purposes only. Please read important disclosures at the end of this commentary.
I think lumber can go lower as the CRB index goes higher. Many commodities in the CRB Index are fungible and internationally “arbitrageable,” while lumber, like natural gas, is a highly domestic market. A slowdown in construction and improved supply to the market after months (even years) of bottlenecks can push the lumber price to pre-COVID levels while fungible commodities are in short supply.
Disclaimer: Please click here for important disclosures located in the “About” section of the Navellier & Associates profile that accompany this article.
Disclosure: *Navellier may hold securities in one or more investment strategies offered to its clients.
Editor’s Note: The summary bullets for this article were chosen by Seeking Alpha editors.
Be the first to comment