

DNY59
Second Quarter Highlights:
- Fixed income funds realized a return of negative 2.98% on average during the third quarter of 2022, marking the third consecutive negative quarterly performance for fixed income funds and the fourth over the last five quarters.
- Taxable bond funds (-2.86%) outperformed tax-exempt bond funds (-3.32%) in quarterly performance for the fourth time in the last six quarters and the seventh time over the past 10.
- Only three of the 51 Lipper fixed income classifications ended the quarter with plus- side quarterly performance. Seven Lipper classifications ended Q3 with performance better than negative 1.0%, up from the three in Q1 and four in Q2.
- Our top three Lipper classifications over the quarter were Loan Participation Funds (+0.92%), Short High Yield Funds (+0.51%), and Ultra-Short Obligations Funds (+0.23%).
- The worst-performing classifications on average were General U.S. Treasury Funds (-6.84%), International Income Funds (-6.12%), and Corporate Debt Funds A Rated (-5.02%).
Executive Summary
Fixed income funds realized a return of negative 2.98% on average during the third quarter of 2022. This was the third consecutive negative quarterly performance for fixed income funds and the fourth over the last five quarters. The last time fixed income funds reported three straight negative performing quarters was Q2 through Q4 of 2015. This was a period right before the prior Federal Reserve interest rate hiking cycle-December 17, 2015, was the first interest rate increase (+0.25%) following the Great Recession.
Taxable bond funds (-2.86%) outperformed tax-exempt bond funds (-3.32%) in quarterly performance for the fourth time in the last six quarters and the seventh time over the past 10.
We start the third quarter in July when Federal Reserve Chair Jerome Powell announced its second straight 75 basis point (bps) hike, moving the federal funds rate to the range of 2.25%-2.50%. The Federal Open Markets Committee’s (FOMC) decision on July 27 came after a shocking June CPI report which was released on July 13. The June Consumer Price Index (CPI)) showed an increase of 1.3% from May and an astounding 9.1% increase over the last 12 months, marking the largest 12-month increase since November 1981. Core-CPI, less food and energy, on an annual basis fell from 6.0% to 5.9%. After the FOMC’s rate increase, Powell’s comments gave hope of a light at the end of the tunnel. He said:
“Committee’s thinking is still, which is that we would get to a moderately restrictive level by the end of this year-by which I mean somewhere between three and three-and-a-half percent.”
On July 28, the great debate of whether we are in a recession began as the Bureau of Economic Analysis released its first estimate of Q2 Gross Domestic Product (GDP, -0.9%), which was just recently revised to negative 0.6% growth. This came following negative Q1 growth of 1.6%-a recession has typically been defined as back-to-back quarters of negative real GDP growth.
The July CPI report, published on August 10, highlighted another significant bump in headline prices-gaining 8.5% from a year ago. Core-CPI rose 5.9% over the last 12 months. Although the slight drop from June prices was encouraging to some, the headline number remained far from the Fed’s long-term goal of 2.0%.
While there was no FOMC meeting in August, it was clear to the market from the Jackson Hole Economic Symposium that interest rates were not going to end the year at a “moderately restrictive level,” causing investors to revisit their end-of-year and 2023 forecasts. Powell said in his August 26 speech:
“Reducing inflation is likely to require a sustained period of below-trend growth. Moreover, there will very likely be some softening of labor market conditions. While higher interest rates, slower growth, and softer labor market conditions will bring down inflation, they will also bring some pain to households and businesses. These are the unfortunate costs of reducing inflation. But a failure to restore price stability would mean far greater pain.”
Market participants began to price in another 50-75 bps increase for the September FOMC meeting, continuing to decrease the likelihood of any future economic soft landing. The August CPI, published on September 13, showed increases in both the 12-month headline figure (+8.3%) and core-CPI number (+6.3%).
In response to the report and in line with investor forecasts, the Fed hiked rates another 75 bps-the third 0.75% increase in as many meetings. With two more meetings planned in 2022, the market is expecting more rate hikes totaling 125 bps. It’s hard to believe the Fed Funds rate sat at 0.25% to 0.50% back in March of this year.
The one thing that has been apparently “transitory” is the Fed’s overall stance and approach to tackling inflation. The central bank’s policy has transitioned from soft-landing proponents to data-dependent advocates, to by any means necessary hawks, all in the span of three short months.
Only three of the 51 Lipper fixed income classifications ended the quarter with plus-side quarterly performance. In each of the first two quarters of 2022, all 51 classifications realized sub-zero performance. Seven Lipper classifications ended Q3 with performance better than negative 1.0%, up from the three in Q1 and four in Q2.
Of the macro-groups, Alternative Bond Funds (-1.44%), General Domestic Taxable Fixed Income Funds (-1.88%), and National Municipal Bed Funds (-2.03 %) suffered the least over the last three months.
Government/Treasury Funds (-4.47%), World Taxable Fixed Income Funds (-4.18%), and General Municipal Debt Funds (-4.04%) closed the quarter as the worst-performing macro-groups.
Our top three Lipper classifications over the quarter, and the only ones to finish in the black, were Loan Participation Funds (+0.92%), Short High Yield Funds (+0.51%), and Ultra-Short Obligations Funds (+0.23%).
On the flip side, the worst-performing classifications on average were General U.S. Treasury Funds (-6.84%), International Income Funds (-6.12%), and Corporate Debt Funds A Rated (-5.02%).
FIGURE 1: TREASURY YIELD CURVE: MOVEMENT OVER THE PAST YEAR
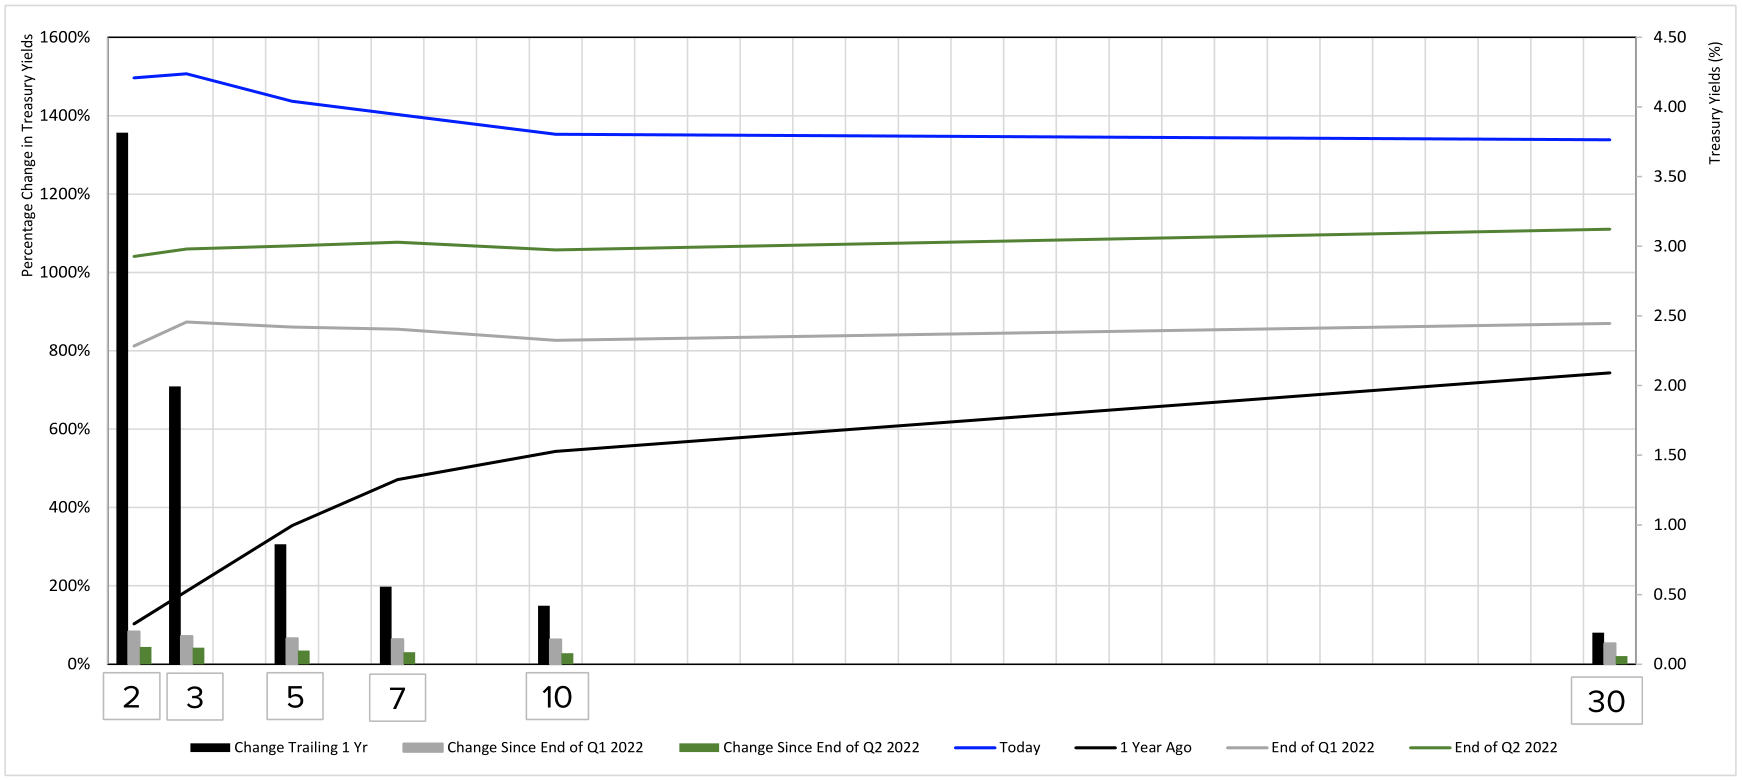
Source: Lipper, An LSEG Business
Government/Treasury Funds Summary
The Treasury yield curve ended the quarter with an inverted 10-two yield spread in 64 straight daily sessions. During the past three months, the two- and three-year Treasury yields increased 43.80% and 42.25%, respectively, while the 10- and 30-year yields rose 27.91% and 20.56%. The 10-two Treasury yield spread fell from positive 0.05 to negative 0.41 over the quarter. Over the past year, the two-year Treasury yield increased by 1,356.40% while the 30-year only rose 80.01%.
The government/Treasury funds macro-group posted a negative 4.47% return on average over the quarter, marking the third consecutive negative performance quarter and the fourth time in the last 16. Q3 2022 was this macro-group’s worst-performing quarter since Q3 1981. Government/Treasury funds were one of two macro-groups to suffer worse quarterly performance in Q3 than in Q2.
Longer-duration funds across the board performed poorly once again with shorter-dated Treasury yields drastically increasing over the last three months. General U.S. Treasury Funds struggled the most for the third straight quarter. Lipper General U.S. Treasury Funds (-6.84%) were the lowest-performing Lipper classification during the quarter. The classification recorded its fifth negative performing quarter over the two years.
Following Lipper General U.S. Treasury Funds were General U.S. Government Funds (-5.02%), U.S. Mortgage Funds (-4.90%), and GNMA Funds (-4.86%). With many investors believing inflation has already been priced into the current funds, Lipper Inflation Protected Bond Funds logged their third straight quarter of negative performance-their first time since Q4 2015 reporting three consecutive quarters of negative inflation.
The top-performing Lipper classifications in this macro-group still realized negative quarterly performance-short U.S. Treasury Funds (-0.79%), Short U.S. Government Funds (-1.88%), and Short-Intermediate U.S. Government Funds (-2.83%)-marking the second straight quarter these three Lipper classifications finished in the top three for Government/Treasury Funds. Lipper Short U.S. Treasury and Government Funds are compiled of funds that invest primarily in bonds with a weighted average maturity of fewer than three years. Investors looking to reinvest in higher yields post- rate hiking cycles will find shorter-duration, government-backed issues more attractive.
World Fixed Income Funds Summary
World fixed income funds also struggled in Q3 2022. Their negative 4.18% performance was the second lowest among all macro-groups and the fifth straight negative quarterly performance.
The bottom three performers in this macro-group were Lipper International Income Funds (-6.12%), Global Income Funds (-4.56%), and Emerging Markets Local Currency Debt Funds (-4.51%). All three classifications have suffered six quarters of sub- zero performance in the last seven.
Lipper Global High Yield Funds (-1.57%) and Lipper Emerging Markets Hard Currency Debt Funds (-4.09%) both finished atop this macro-group but still recorded their fourth straight negative performing quarter.
FIGURE 2: Q3 2022 TAXABLE FIXED INCOME PERFORMANCE (%)
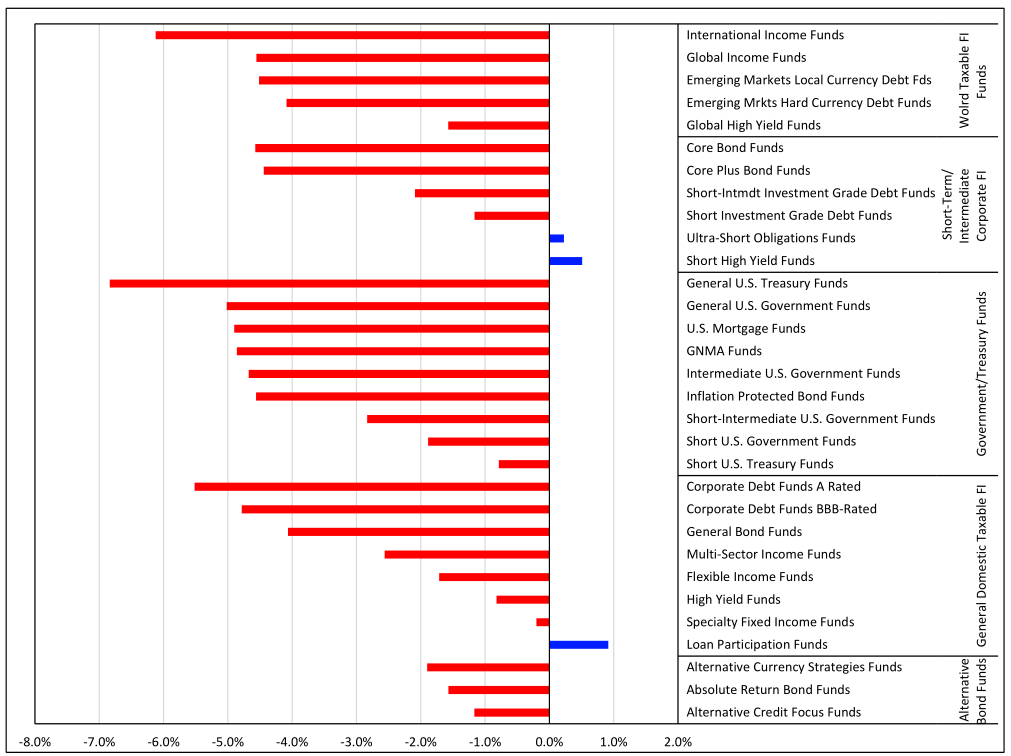
Source: Lipper, An LSEG Business
Municipal Debt Funds Summary
Municipal debt funds recorded an average loss of 3.32% in the third quarter of 2022-marking their fourth quarterly loss in the last five quarters. During Q1 2022, this macro-group also witnessed their largest quarterly depreciation in more than 30 years.
General municipal debt funds recorded the lowest macro-group quarterly performance with a negative 4.04%-marking their fourth negative quarter over the past five.
Single state municipal debt funds (-3.58%) and national municipal debt funds (-2.03%) both suffered throughout the quarter. Both single- state municipal debt funds and national municipal debt funds have also recorded four sub-zero quarters over the last five.
All 21 municipal debt funds Lipper classifications reported negative quarterly performance for the fourth quarter in five. The top-performing non-single state tax-exempt Lipper classification was Short Municipal Debt Funds (-0.98%) for the third straight quarter. This classification invests in municipal debt securities with a dollar-weighted average maturity of fewer than three years. Short Municipal Debt Funds have produced five-straight negative quarters.
The three lowest-performing municipal single-state Lipper classifications over Q3 were New York Municipal Debt Funds (-4.09%), Virginia Municipal Debt Funds (-3.93%), and Pennsylvania Municipal Debt Funds (-3.93%). These three were the lowest-performing classifications during the first quarter as well. All three classifications have suffered three straight quarters of negative performance.
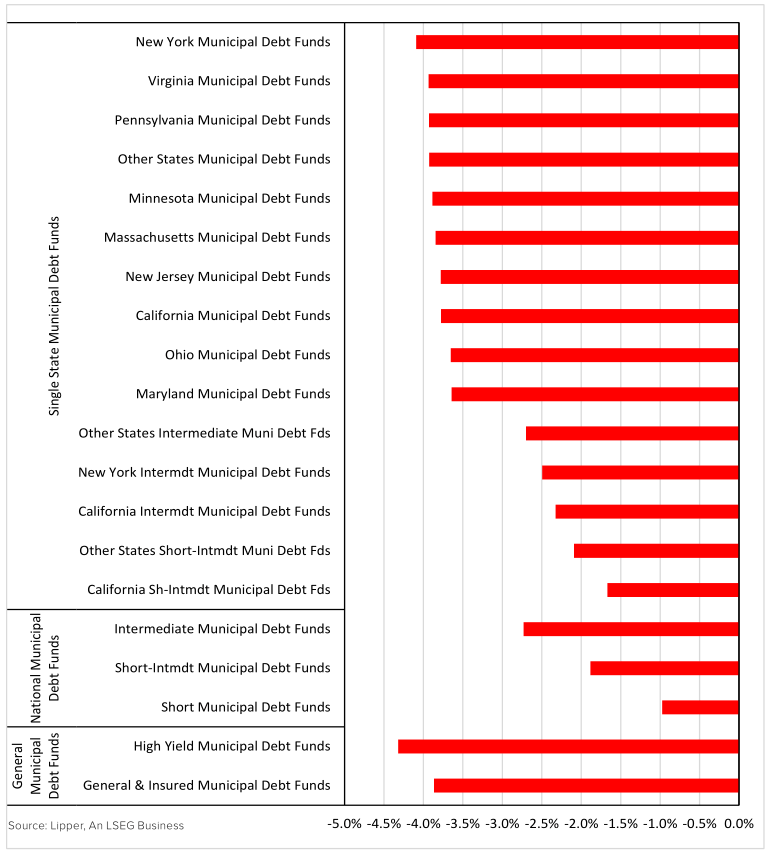
FIGURE 3: Q3 2022 TAX-EXEMPT FIXED INCOME PERFORMANCE (%)
General Domestic Taxable Bond Funds Summary
As a macro-group, general domestic taxable fixed income bond funds finished the quarter returning a negative 1.88%, which is their third straight quarter ending in the red. Q3 was up from a negative 7.13% in Q2 2022, which marked the third-lowest quarterly performance in the last three decades: Q4 2008 (-11.51%) and Q1 2020 (-9.54%).
Lipper Loan Participation Funds finished the quarter as the top performing General Domestic Taxable Bond Funds classification with a positive 0.92%, marking the second time in the last three quarters Loan Participation Funds ended the quarter with the top spot, after a negative 5.25% in Q1. Lipper Loan Participation Funds have only realized two-quarters of negative performance in the last 10.
Lipper Specialty Fixed Income Funds (-0.20%) was the top-performing classification under the macro group last quarter and ended Q3 as the second-largest quarterly performer. Still, this classification has reported five straight quarters of sub-zero performance. Lipper Specialty Fixed Income Funds typically have distinctly different performance and investment strategies- including the use of short positions and leverage-that find themselves outside of Lipper’s other fixed income classifications.
The bottom three Lipper classifications under this macro-group in Q3 2022 were Corporate Debt Funds A-Rated (-5.52%), Corporate Debt Funds BBB-Rated (-4.78%), and General Bond Funds (-4.06%). All three of these classifications have posted three consecutive negative performing quarters. Corporate Debt Funds A-Rated ended the quarter as the third-lowest performing Lipper classification.
Short-Term Intermediate Corporate Bond Funds Summary
Short-term intermediate corporate bond funds finished the third quarter with negative quarterly performance (-2.78%), their fourth straight quarter with sub-zero performance. In Q1 2022, the macro-group realized its worst quarterly performance in more than 30 years.
After finishing as the best short-term/intermediate corporate bond fund classification in two consecutive quarters, Lipper Ultra-Short Obligation Funds moved down to the second highest, returning a positive 0.23%. Ultra-Short Obligation Funds maintain a heavy allocation to investment-grade issues while maintaining an average maturity of less than one year. This is the first quarter in four where the classification ended in the black; prior to that, the Ultra-Short Obligation Funds logged six consecutive positive quarters. Lipper Ultra-Short Obligation Funds finished second highest among all Lipper fixed income classifications as well.
In our top spot was Lipper Short High Yield Funds (+0.51%). This classification was not only the top performer in the macro group but was the top performer of all fixed income Lipper classifications. Short High Yield Funds have produced only four negative performing quarters over the past 18.
The lowest returning Lipper classifications were Core Bond Funds (-4.57%), Core Plus Bond Funds (-4.44%), and Short- Intermediate Investment Grade Debt Funds (-2.09%). Both Core Bond and Core Plus Bond Funds are made up of funds with weighted average maturities of five to 10 years. Longer-duration debt and assets with higher credit risk have taken a beating throughout 2022 and have soured more so recently with the Fed looking like it will double down on its interest rate hiking policy.
|
© Refinitiv 2022. All Rights Reserved. Lipper Fund Market Insight Reports are for informational purposes only, and do not constitute investment advice or an offer to sell or the solicitation of an offer to buy any security of any entity in any jurisdiction. No guarantee is made that the information in this report is accurate or complete and no warranties are made with regard to the results to be obtained from its use. In addition, Lipper will not be Liable for any loss or damage resulting from information obtained from Refinitiv Lipper or any of its affiliates. For immediate assistance, feel free to contact Lipper Client Services toll-free at 877.955.4773 or via email at LipperUSClientServices@refinitiv.com. For more information about Lipper, please visit our website at refinitiv.com/en or lipperalphainsight.com |
Be the first to comment