

akinbostanci
Investment Thesis
Though many have said that past performance does not guarantee forward results, we finally have to beg to differ for Costco Wholesale Corporation (NASDAQ:COST). Despite the growing recessionary fears, the company continues to grow its comparable sales excellently by 9.6% in the US, 13.7% in Canada, and 6.6% internationally in FQ4’22. Its e-commerce segment outperformed as well, with an 8.4% growth in comparable sales, similarly after adjusting for the impacts of gasoline prices and foreign exchange.
In addition, COST continued to report impressive growth in comparable sales by 8% in the US, 9.6% in Canada, and 11% internationally for September 2022, while recording an increase of 2.3% in e-commerce sales as well, after adjustments. While these numbers may indicate a slight deceleration in growth compared to August 2022 at 7.6%, 11.7%, 12.5%, and 4.8%, we are not overly concerned. This is because COST reported impressive growth in FQ4’22 membership fees by 34.85% QoQ and 7.5% YoY. Otherwise, still an excellent 8.95% YoY for the whole of FY2022. Impressive, since these are for annual memberships.
Due to COST’s accelerating expansion plan at an average of 22.3 warehouses annually, the company is expected to operate 863 warehouses by FY2023, compared to 634 in FY2013. Naturally, further boosting its profitability ahead, since its membership fees directly contribute to the lion’s share of 71.03% in its net income for the quarter and 72.27% for the fiscal year.
What’s there not to like about COST, really, since we are loyal customers ourselves and always make these shopping trips a family event.
COST Continues To Impress With Stellar Execution And Forward Profitability
S&P Capital IQ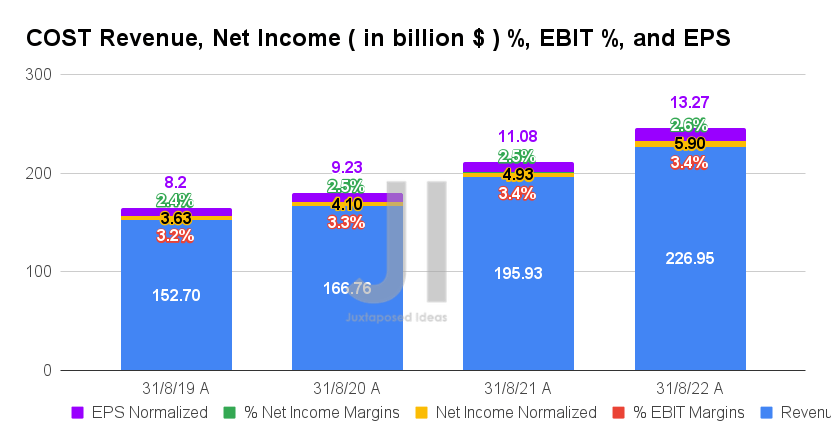
In FY2022, COST continues to report record-breaking growth with no signs of slowing down, despite Mr. Market’s concerns about the deceleration of demand post-reopening cadence. The company reported revenues of $226.95B and an EBIT margin of 3.4% for the latest fiscal year, indicating an exemplary increase of 15.8% and in line YoY, despite the tougher YoY comparison and rising costs.
This directly boosted COST’s profitability, with net incomes of $5.9B and net income margins of 2.6% in FY2022. It represented a 2.6% and 0.1 percentage point YoY growth, respectively. Thereby, boosting its EPS by 19.8% to $13.27.
S&P Capital IQ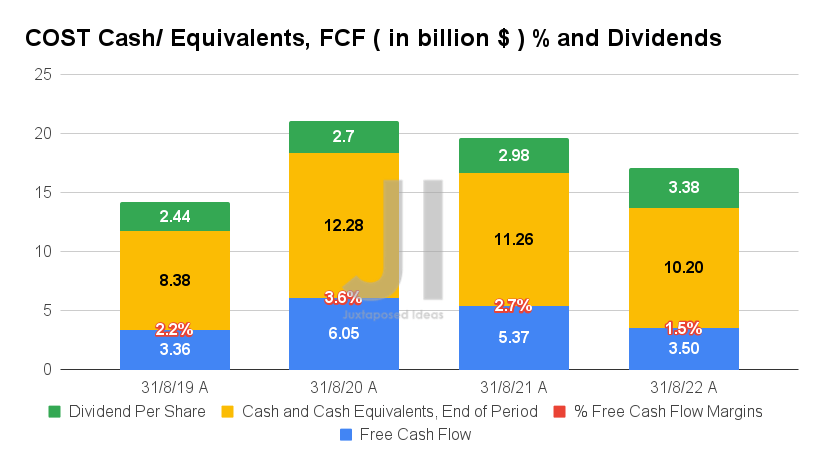
Investors must not be fooled by the perceived fall in COST’s Free Cash Flow (FCF) generation in FY2022, since it is directly attributed to its aggressive expansion within the US and internationally. The company opened 23 new warehouses in the latest fiscal year, compared to 20 in FY2021, 13 in FY2020, and 20 in FY2019. This directly contributed to the growth in its gross PPE assets from $32.62B in FY2019 to $44.32B in FY2022. Impressive indeed, given the global supply chain issues during the COVID pandemic.
COST also continues to grow its dividend payouts at a CAGR of 11.5% in the past three years to $3.38 by FY2022, indicating a decent yield of 0.68% though notably far below its 4Y average of 1.44%. However, this is attributed to the massive 238.67% rally the stock has experienced thus far, instead of a dividend cut. Despite the 25.97% YoY growth in its inventory levels to $17.9B, with the robust cash and equivalent of $10.2B on its balance sheet in FY2022, the company is more than well-equipped to handle the recession ahead.
S&P Capital IQ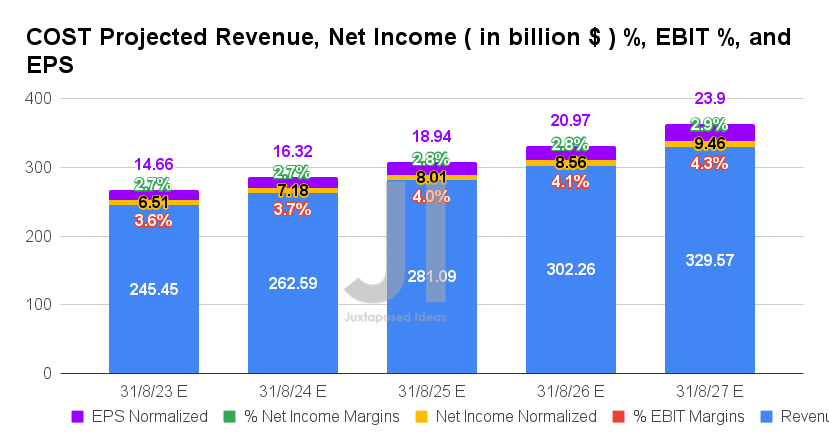
Over the next five years, COST is expected to report revenue and net income growth at an impressive CAGR of 7.7% and 9.9%, respectively. These numbers may represent a notable deceleration of growth from pre-pandemic levels of 8.8%/15.6% and pandemic levels of 13.3%/16.5%. However, we must highlight that these numbers represent notable upgrades from consensus estimates by 1.26% since our previous article in September 2022 and 2.42% since May 2022, despite the multiple downgrades multiple companies have experienced thus far.
Furthermore, Mr. Market is very optimistic about the continued improvement in COST’s profitability, from EBIT and net income margins of 3.2%/ 2.4% in FY2019, to 3.4%/ 2.6% in FY2022, and finally to 4.3%/ 2.9% by FY2027, despite the rising global inflationary pressures experienced thus far. Thereby, explaining the excellent CAGR of 12.5% in its EPS growth over the next five years.
Furthermore, analysts are projecting a very optimistic YoY growth in COST’s revenues by 8.1%, net incomes by 2.7%, and EPS by 10.5% in FY2023, despite the impending recession and the Fed’s aggressive hikes through 2023. Thereby, indicating the immense value offered to its large consumer base and, consequently, the latter’s tremendous loyalty despite the worsening macroeconomics.
S&P Capital IQ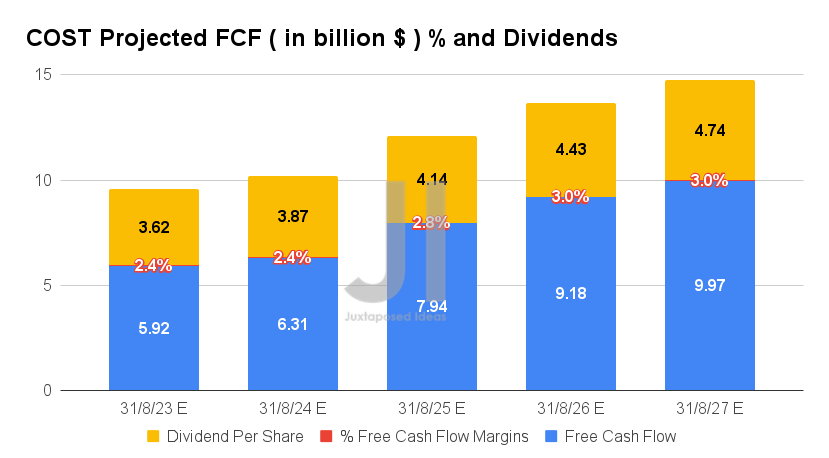
In addition, COST is expected to report an almost tripled FCF growth ahead from FY2022 levels of $3.5B at an accelerated CAGR of 23.3% through FY2027, as the company sustains its capital expansion and grows its membership base internationally moving forward. The company has already planned 25 new warehouses in FY2023, notably ten internationally, with the first locations in New Zealand and Sweden while expanding to its fourth location in China.
Therefore, we are not surprised by the projected improvement in COST’s FCF margins from 2.2% in FY2019, 1.5% in FY2022, and finally to 3% by FY2027. Consensus also estimates a sustained growth in its dividend payouts at a moderated CAGR of approximately 7% through FY2027.
In the meantime, we encourage you to read our previous article on COST, which would help you better understand its position and market opportunities.
- Costco: More Expensive Than Ever – Maybe Its Premium Is Justified
- Costco: Buy After The Blood Bath Is Over
So, Is COST Stock A Buy, Sell, Or Hold?
COST 10Y EV/Revenue and P/E Valuations
S&P Capital IQ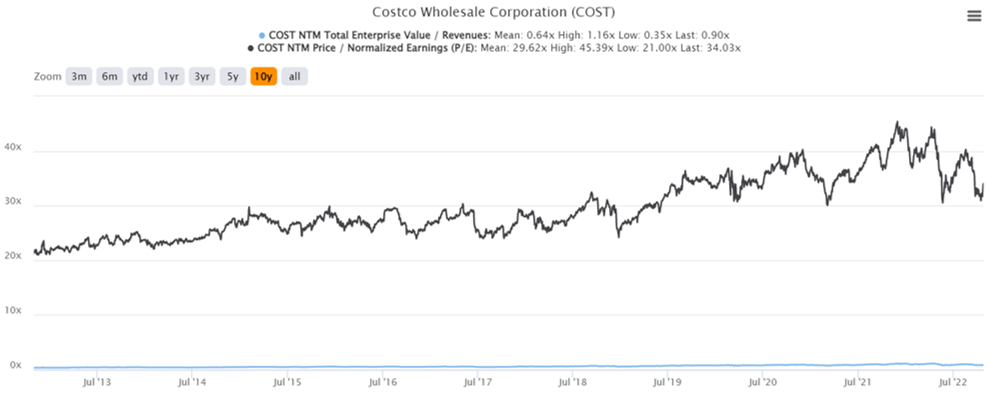
COST is currently trading at an EV/NTM Revenue of 0.90x and NTM P/E of 34.03x, higher than its 5Y mean of 0.64x and 29.62x, respectively. The stock is also trading at $499.06, down -18.49% from its 52-week high of $612.27, though at a premium of 22.76% from its 52-week low of $406.51. Nonetheless, consensus estimates remain bullish about COST’s prospects, given their price target of $564.79 and a 13.17% upside from current prices.
COST 10Y Stock Price
Seeking Alpha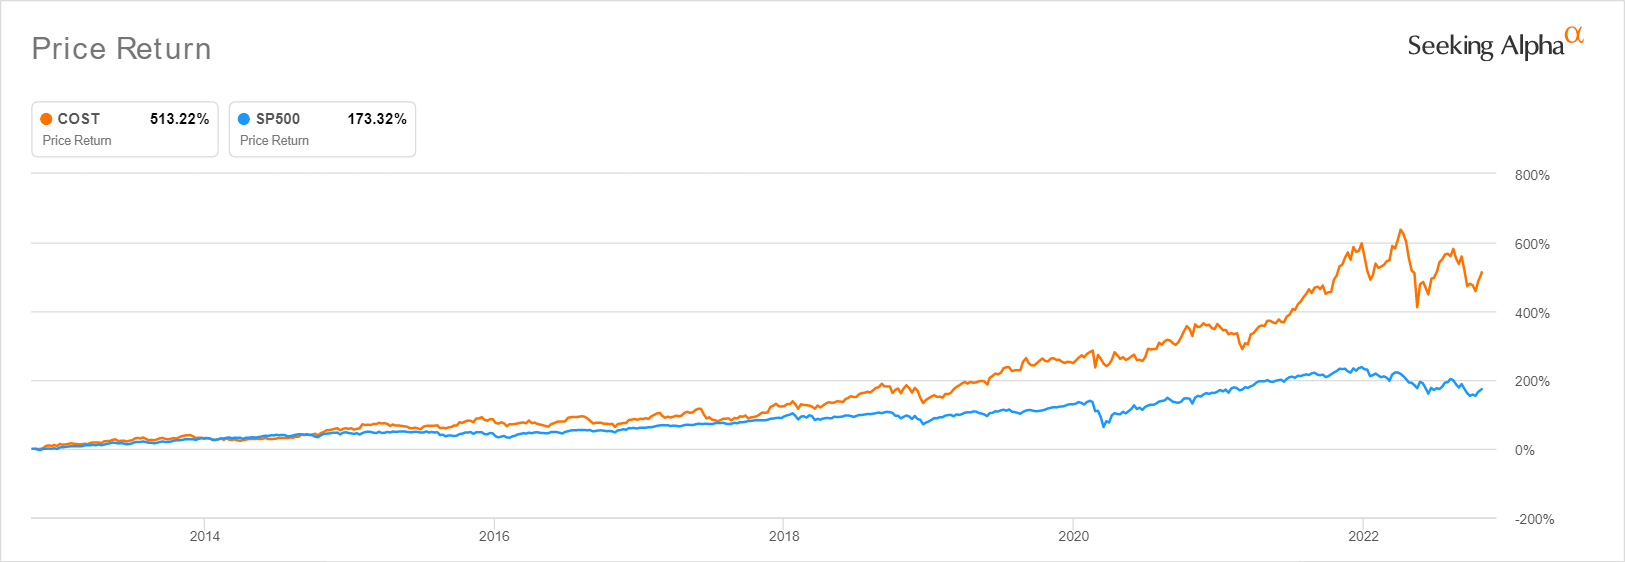
With an excellent 10Y Total Price Return of 513.22% against the S&P 500 Index’s 173.22%, it is immediately apparent that COST continues to outperform many other stocks out there, especially with the catastrophic market-wide correction witnessed since November 2021. That is an impressive feat indeed, since the stock had only fallen by -11.94% YTD against the S&P 500 Index’s plunge of -20.14% at the same time.
In the meantime, we are uncertain how COST would perform ahead, since the S&P 500 Index is exhibiting an interesting optimism since plunging below its previous June lows. The latter has reported a 7.08% recovery in the short span of two weeks. Well, no one knows for sure how long this rally will last, since these are probably attributed to the flurry of Big Tech earnings this week.
Through the coming winter, we expect more foot traffic to COST as well, as more bargain hunters seek cheaper gas prices while boosting in-store sales. Combined with its defensive position in the stock market, there may be positive catalysts for its stock to rally ahead as well, assuming a membership fee increase and special dividend over the next few quarters.
Combined with the factors discussed above, we rate COST stock as a Buy at every dip. Depending on the Fed’s stance in the November meeting, we may likely see more volatility in the short term to the mid $400s, or if we are lucky, the low $400s. However, it is also clear that the company will continue “printing money” moving forward, due to its stellar domestic and international renewal rates of 92.6% and 90.4% in FQ4’22, as consumers flock to COST directly aided by the rising inflationary pressures. Cheers, all.
Be the first to comment